This display shows areas of expanded surface water during flooding, as well as the observed history of flooding commencing in the year 2000. See the Drought Display for areas of reduced surface water during times of drought.
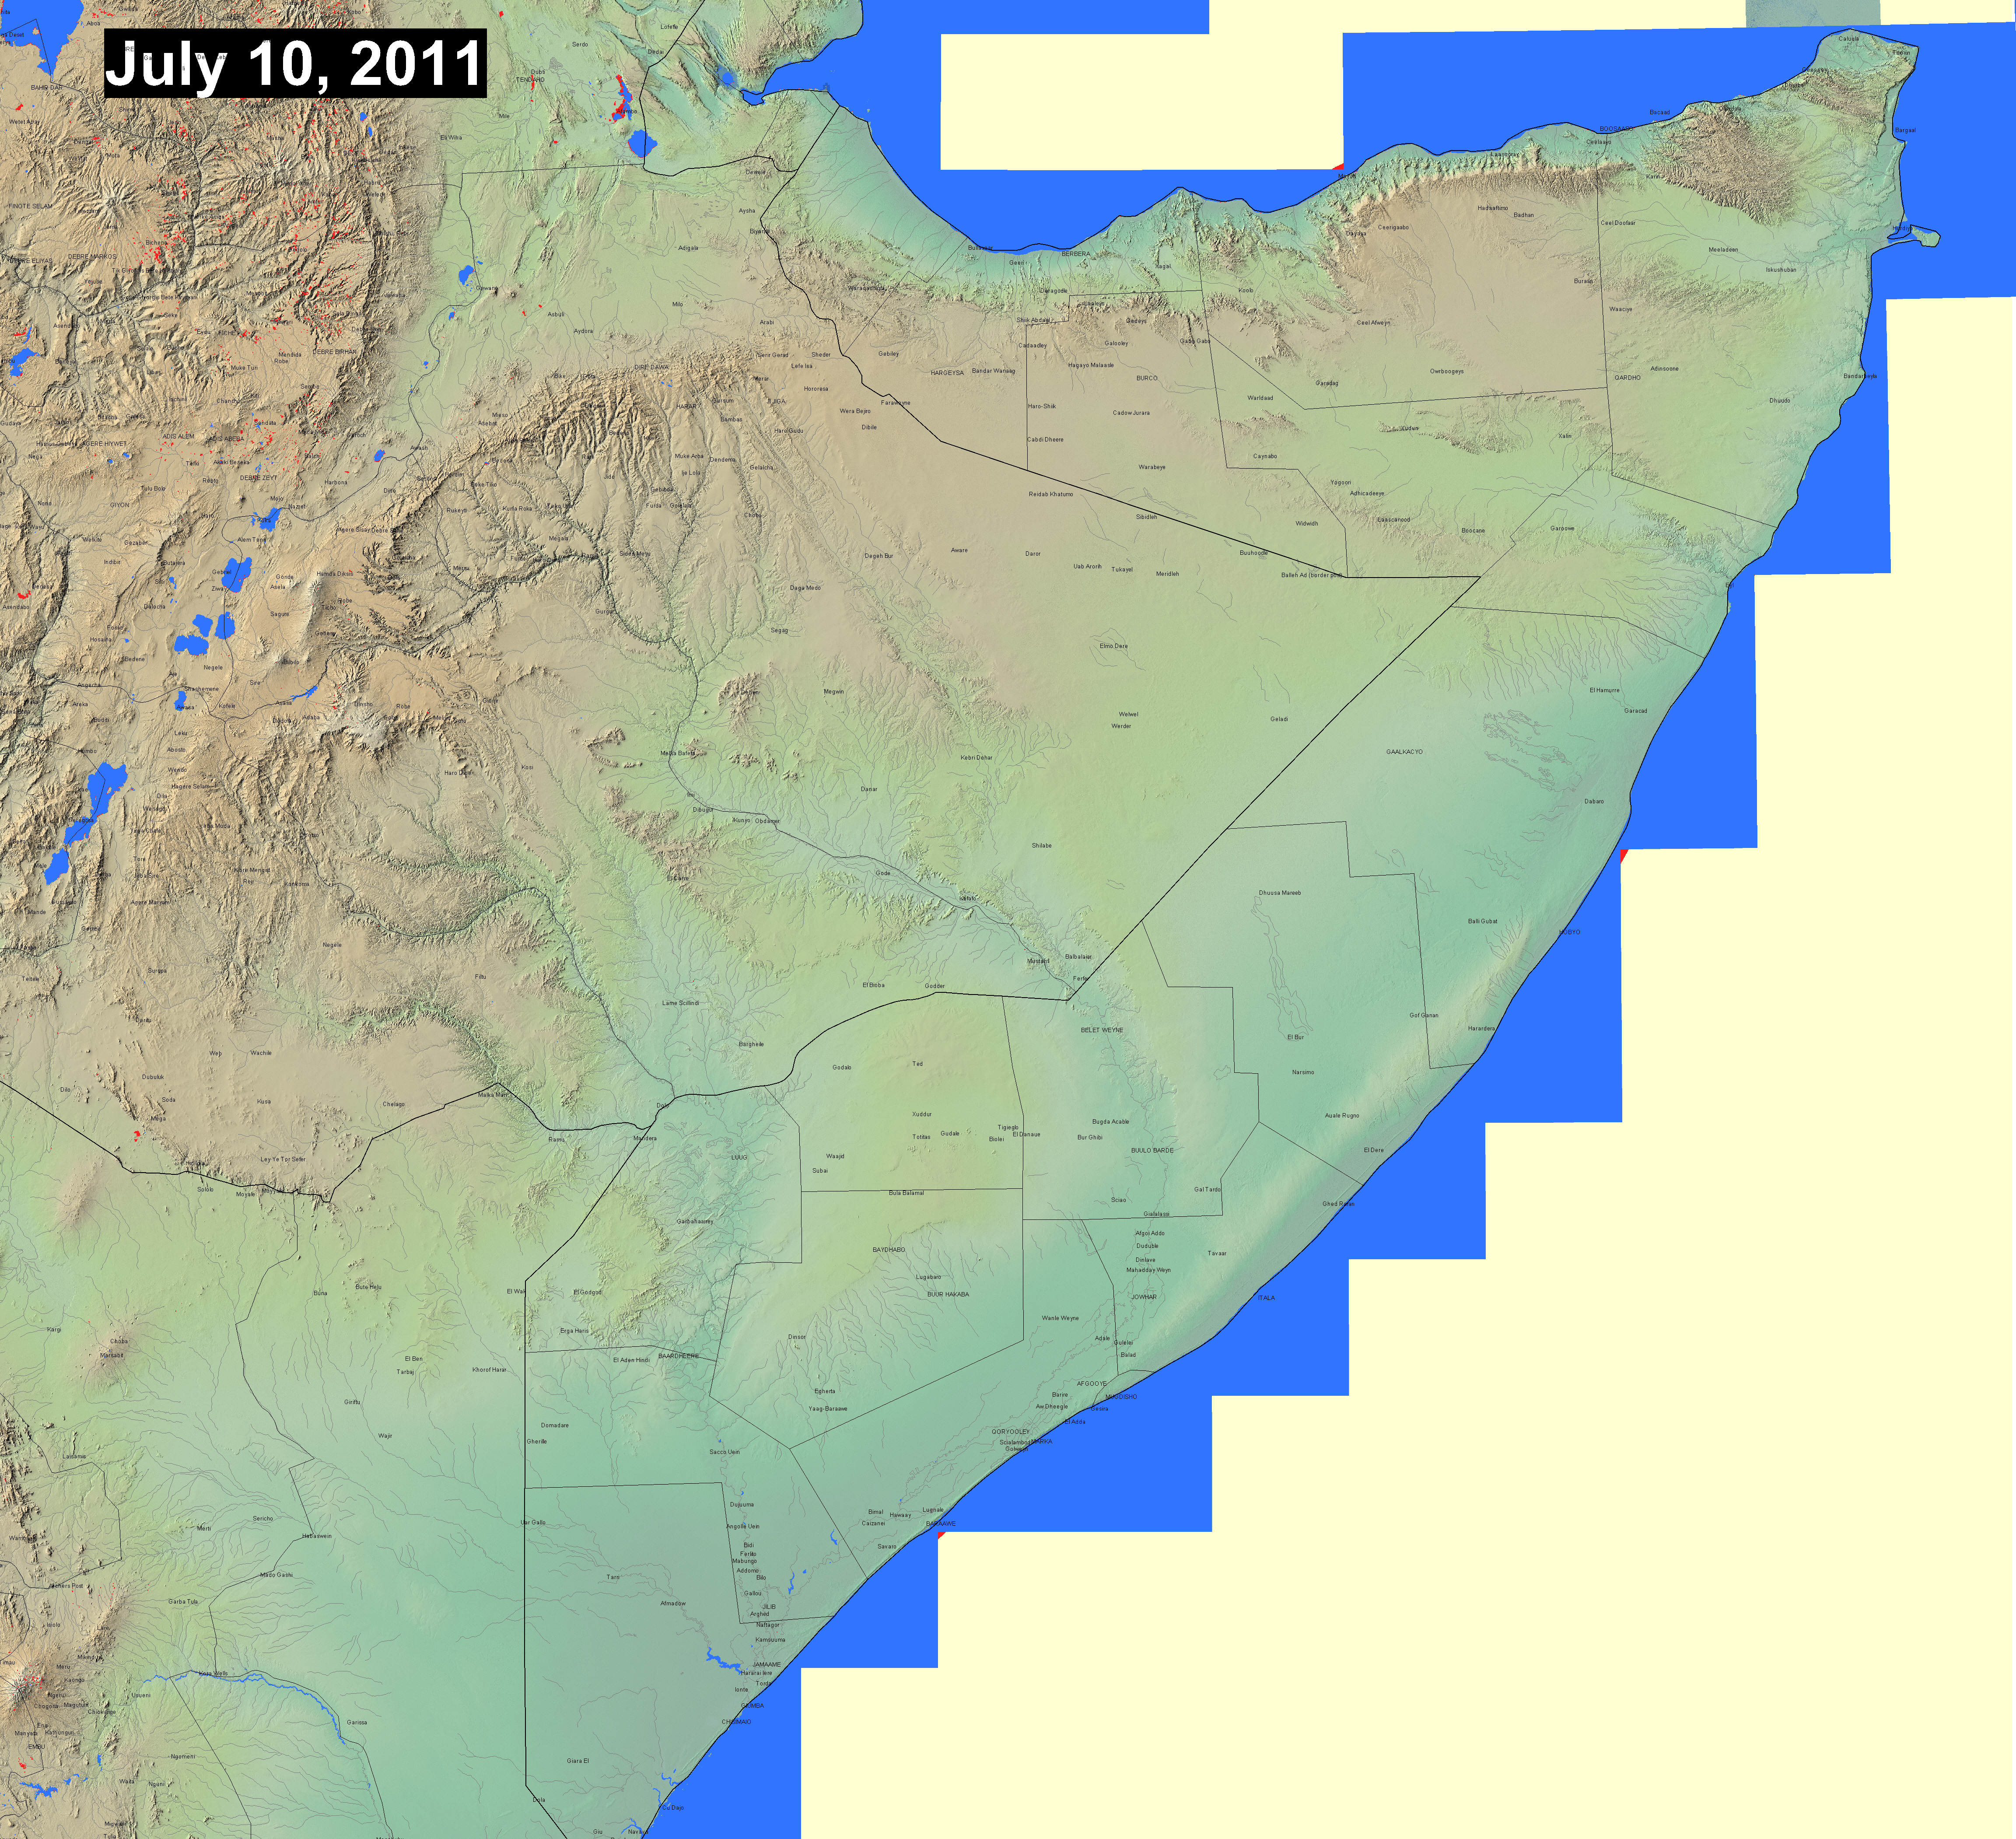
Shown in dark blue and red is the extent of current surface water as imaged by the two MODIS sensors aboard Terra and Aqua. Water areas are accumulated over 7 days to remove obscuration by cloud cover. Red indicates currently flooded land as compared to (dark blue) a reference date (February, 2000, from the Shuttle Radar Topography Mission Water Body dataset). During flooding, and as the extent of lakes, reservoirs, and rivers expand, red areas appear and increase in size. See also the FAQ. In mountainous regions, terrain shadows mimic surface water and are mis-classified as water in our current algorithm; we are working to reduce such noise. Note: reservoirs/impoundments constructed since yr 2000 also appear in red, and dam operation can affect the size of any artificial impoundment.
Light blue areas include all land observed to be inundated by flooding, 2000 to the present year (to be added from DFO records). This MODIS-based observational record may not include all floods: prior to 2011 the records were obtained manually and focus was only selected major flood events. Clickable black dots link to experimental AMSR-E river discharge estimates. The shaded relief background is from topography provided by NASA SRTM data. For the most recent MODIS-based surface water available, see the NASA NRT Experimental Flood Maps. Recent GIS data from the automated MODIS-LANCE NRT processor for this display are located at http://csdms.colorado.edu/pub/flood_observatory/MODISlance/ . See also the technical description, and a history of updates, when available, via powerpoint slides.