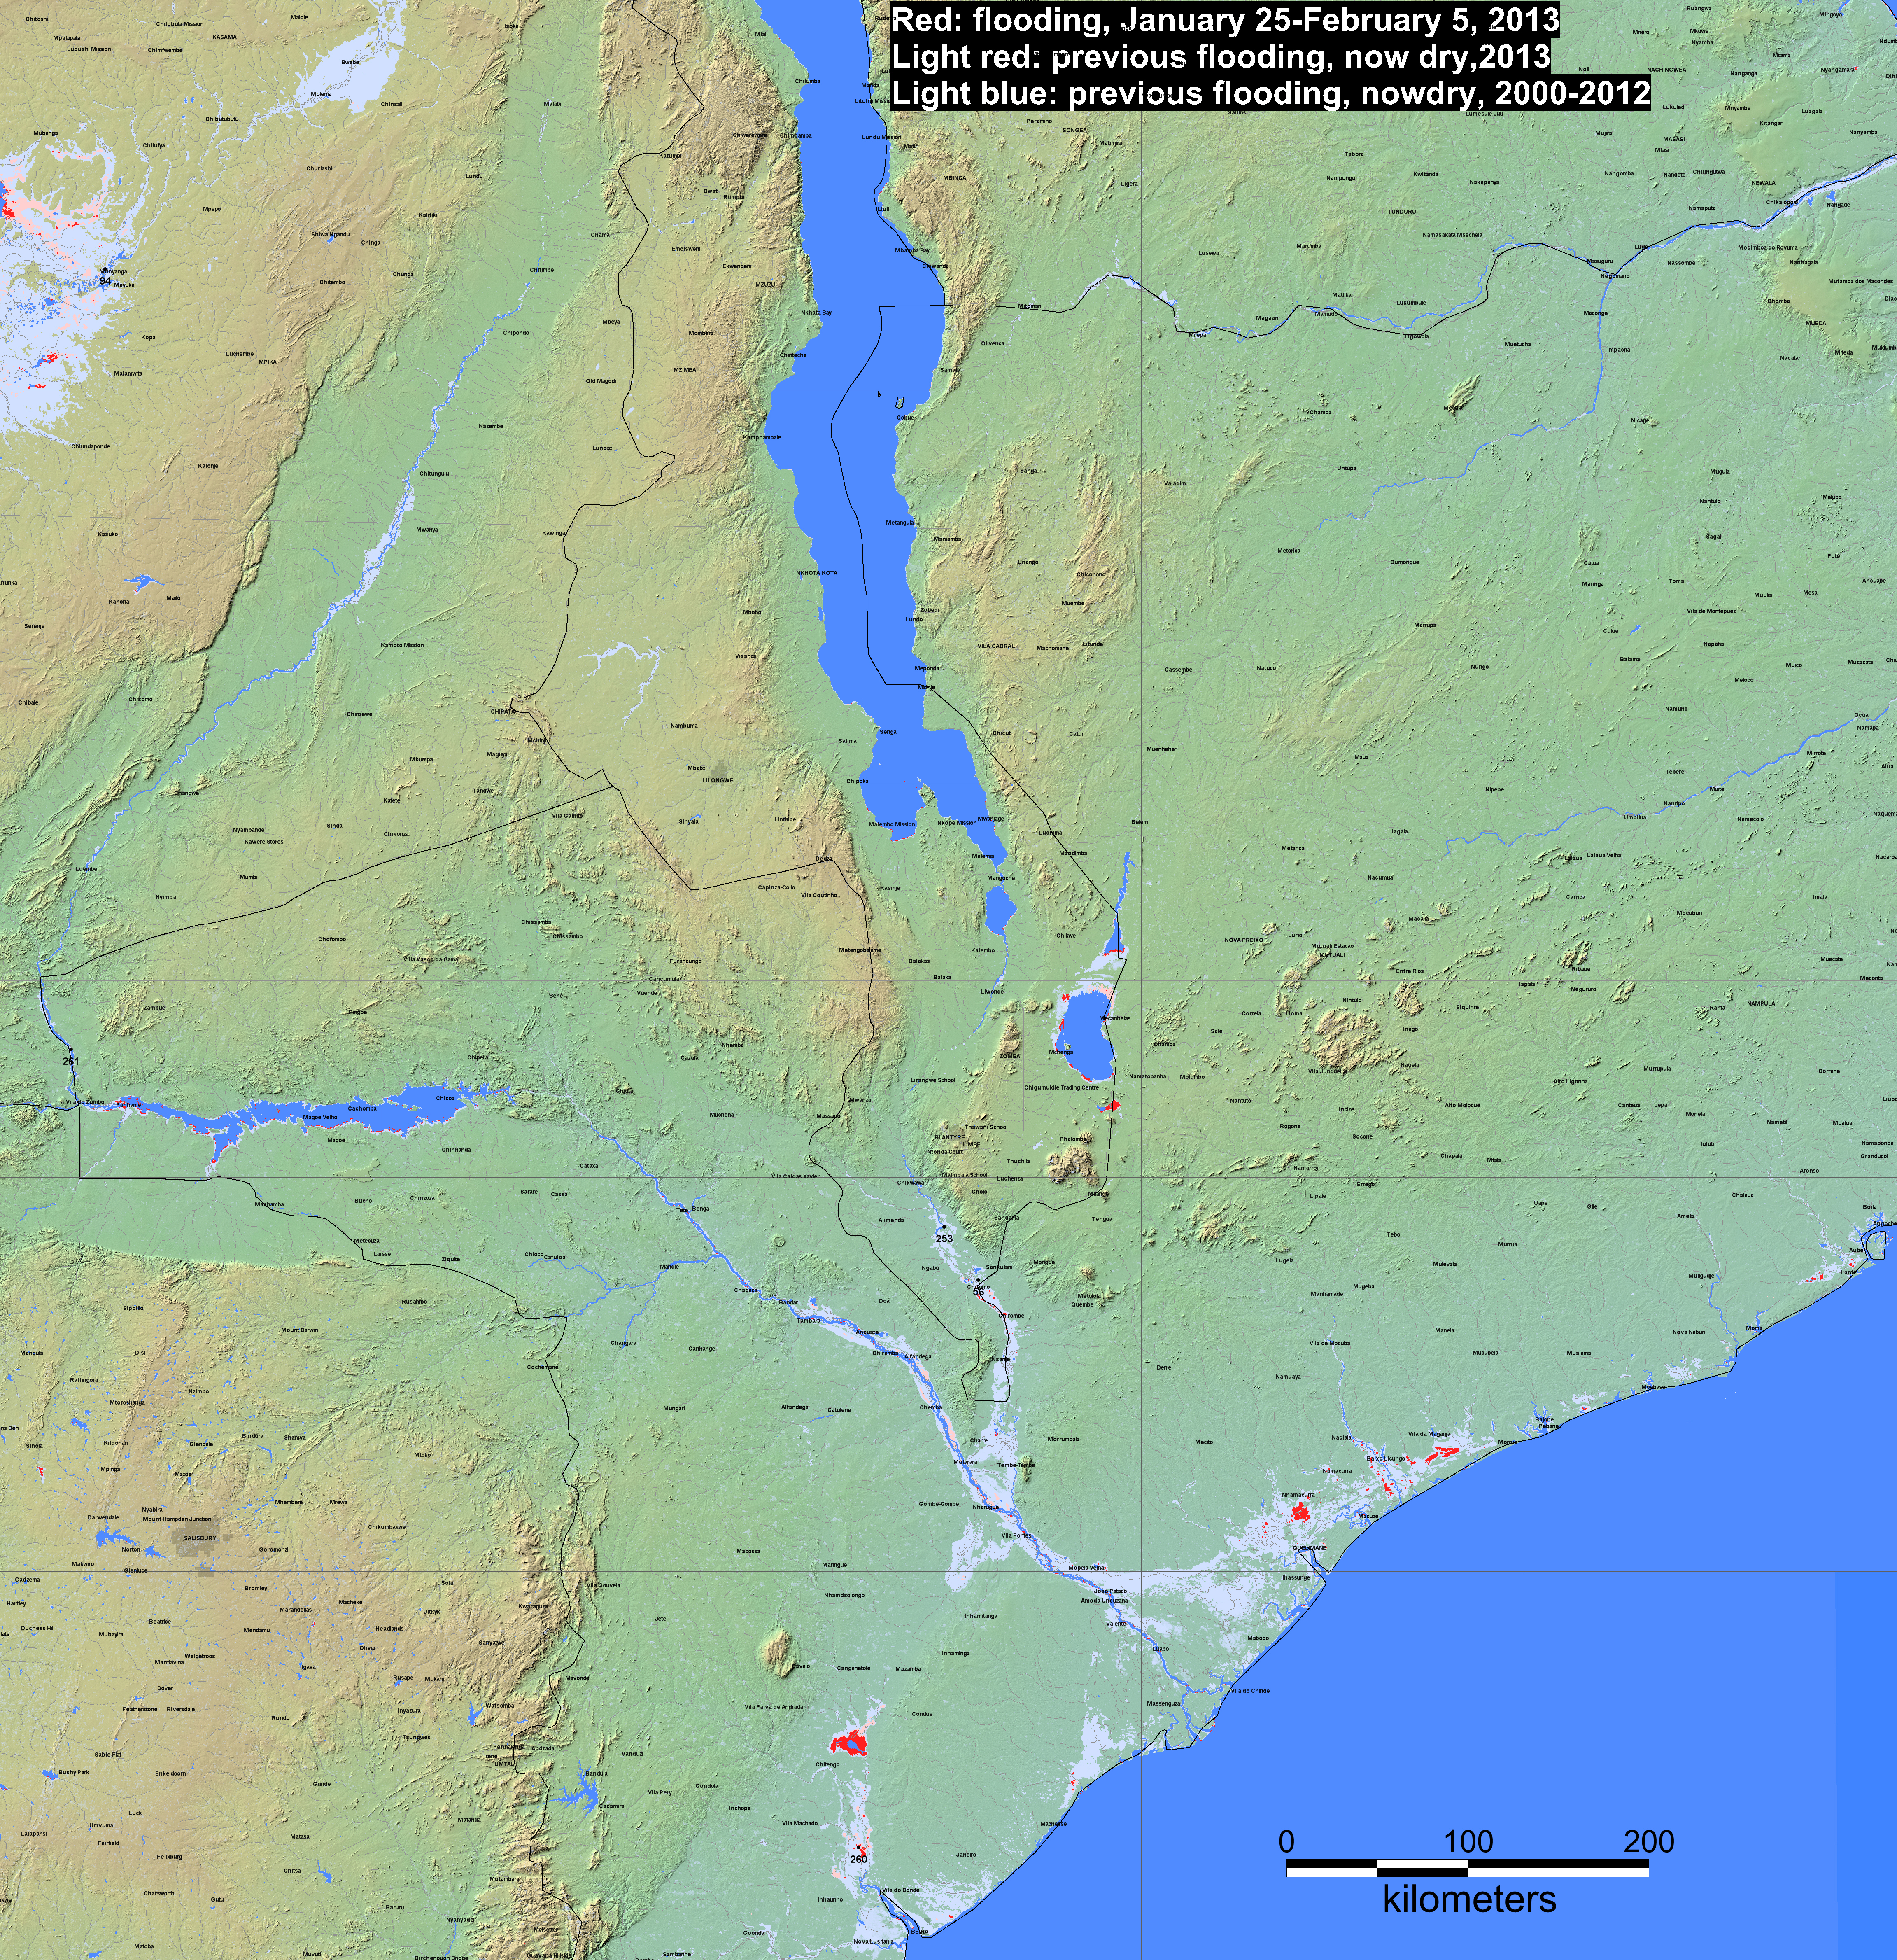
This display shows areas of expanded surface water during recent flooding. It also provides the observed history of flooding, commencing in the year 2000. See the Drought Display for areas of reduced surface water.
Red is most recent flooding mapped. Water areas are accumulated over 10 days to remove obscuration by cloud cover. See also NRT Global MODIS Flood Mapping for today's two-day composite, including areas of cloud cover. Very recent flooding (past several days) may not appear on this map if cloud cover is heavy.
Light red is previous flooding in the current year.
Light blue is previous flooding since January, 2000.
Dark blue is the reference water (February, 2000, from the Shuttle Radar Topography Mission Water Body data).
During flood events, and as the extent of lakes, reservoirs, and rivers expand, red areas appear and increase in size. As flooding wanes and floodplains dry, red transitions to light red and then (in the new year) to light blue.
Error notes: 1) In mountainous regions, terrain shadows mimic surface water and are mis-classified as water in our current algorithm. We are working to reduce such noise. 2) Reservoirs and impoundments constructed since yr 2000 appear permanently in red. 3)The observational record illustrated may not include all floods: prior to 2011 the records were obtained manually and focus was on major flood events.
Other information: See also the FAQ. Any clickable black dots on these displays link to the River Watch satellite discharge measurement sites. The shaded relief background is from topography provided by NASA SRTM data. Recent GIS data (daily surface water information, as .shp file water boundaries) from the automated MODIS-LANCE NRT Flood processor are located (find appropriate 10 degree folder) at http://csdms.colorado.edu/pub/flood_observatory/MODISlance/ . GIS data (MapInfo format) of the long term record of flooding are also available: at this location. Finally, see the technical description, and the time series of annual flooding via a powerpoint slide file.
Also obtain: