| River and Reservoir Watch
Version 4.6 |
|
|
|
|
|
|
|
|
| River
Discharge and Reservoir Storage Changes Using Satellite Microwave Radiometry |
|
Location of this Satellite Gauging Reach |
|
|
|
|
|
|
|
Ganges |
|
Center: |
87.93 |
Long. |
Signal/Noise: |
8.6 |
|
| GFDS Area ID: |
51 |
|
|
India |
|
Center: |
25.03 |
Lat. |
|
Good |
|
| GEE
Time Lapse |
|
WorldView
Time Lapse |
Learn
more about this river |
|
|
915908 |
sq km |
WBM contributing area |
| Last measured: |
13-Oct-25 |
|
|
|
|
|
|
|
|
|
|
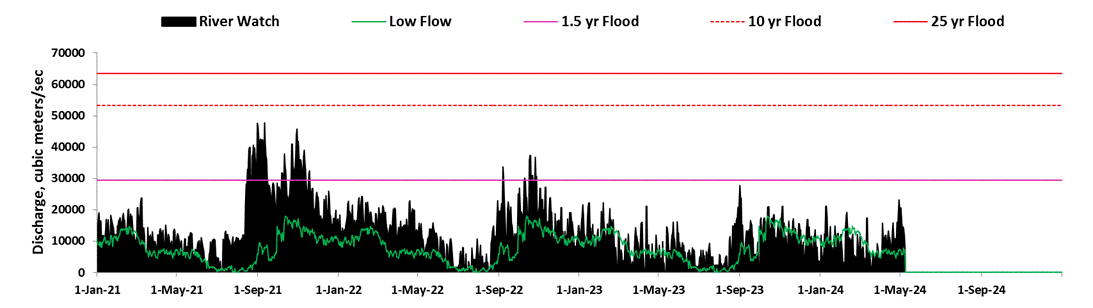
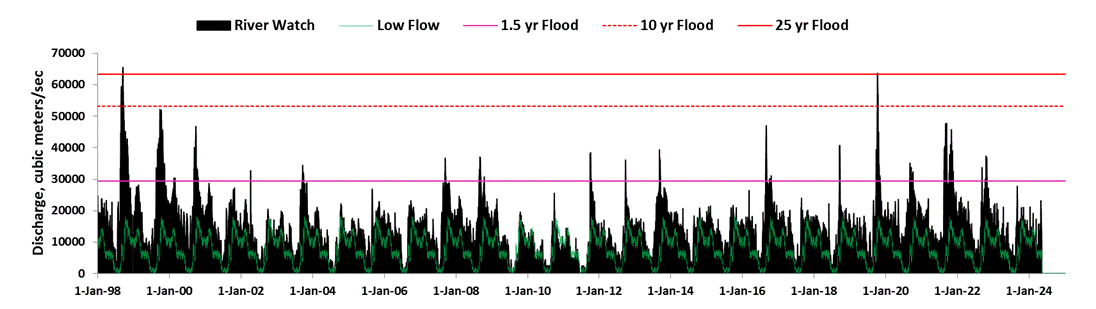
| Discharge: |
|
23753 |
m3/sec |
|
Status: |
2 |
(1, low; 2, normal flow; 3, moderate flood, r
>2.33 y; 4, major flood, r >5 y) |
|
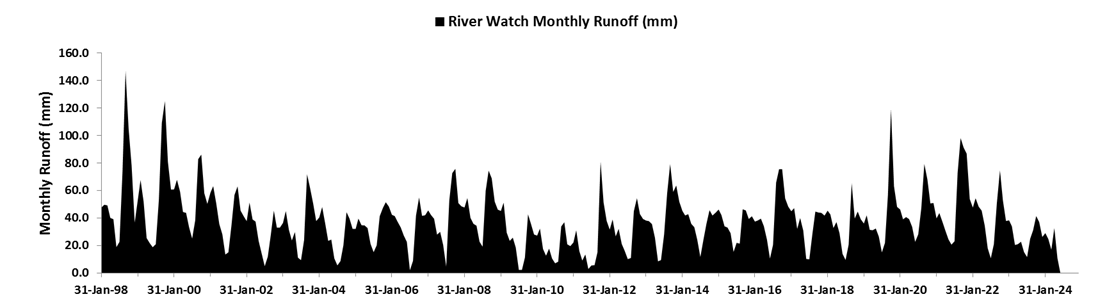
| 7-day Runoff |
13.2 |
mm |
|
|
102% |
(7-day runoff compared to 20 y average for this
date, 2004-2023) |
|
| Flood Magnitude: |
0.0 |
Scale of 0-10 |
|
Flood
Magnitude Defined |
|
|
Technical
Summary |
|
|
|
|
|
|
|
|
|
|
|
|
|
|
|
|
|
|
|
|
|
|
|
|
|
|
|
|
|
|
|
|
|
|
|
|
|
|
|
|
|
|
|
|
|
|
|
|
|
|
|
|
|
|
|
|
|
|
|
|
|
|
|
|
|
|
|
|
|
|
|
|
|
|
|
|
|
|
|
|
|
|
|
|
|
|
|
|
|
|
|
|
|
|
|
|
|
|
|
|
|
|
|
|
|
|
|
|
|
|
|
|
|
|
|
|
|
|
|
|
|
|
|
|
|
|
|
|
|
|
|
|
|
|
|
|
|
|
|
|
|
|
|
|
|
|
|
|
|
|
|
|
|
|
|
|
|
|
|
|
|
|
|
|
|
|
|
|
|
|
|
|
|
|
|
|
|
|
|
|
|
|
|
|
|
|
|
|
|
|
|
|
|
|
|
|
|
|
|
|
|
|
|
|
|
|
|
|
|
|
|
|
Notes: |
7-day forward moving average is applied. |
|
Geolocation correction, commencing April 1,
2012: |
0 |
|
|
|
Low flow is 20th percentile discharge for this
day, 2003-2013. |
Noise filter: |
>.05 daily signal change |
|
|
|
|
|
|
|
|
|
|
|
|
|
|
|
|
|
|
|
|
|
|
|
|
|
|
|
|
|
|
|
|
|
|
|
|
|
|
|
|
|
|
|
|
|
|
|
|
|
|
|
|
|
|
|
|
|
|
|
|
|
|
|
|
|
|
|
|
|
|
|
|
|
|
|
|
|
|
|
|
|
|
|
|
|
|
|
|
|
|
|
|
|
|
|
|
|
|
|
|
|
|
|
|
|
|
|
|
|
|
|
|
|
|
|
|
|
|
|
|
|
|
|
|
|
|
|
|
|
|
|
|
|
|
|
|
|
|
|
|
|
|
|
|
|
|
|
|
|
|
|
|
|
|
|
|
|
|
|
|
|
|
|
|
|
|
|
|
|
|
|
|
|
|
|
|
|
|
|
|
|
|
|
|
|
|
|
|
|
|
|
|
|
|
|
|
|
|
|
|
|
|
|
|
|
|
|
|
|
|
|
|
Notes: |
Log
Pearson Type III is used to compute recurrence intervals from 27 years of
record (1998-2024) |
|
|
|
|
|
|
|
|
|
|
|
|
|
|
|
|
|
|
|
|
|
|
|
|
|
|
|
|
|
|
|
|
|
|
|
|
|
|
|
|
|
|
|
|
|
|
|
|
|
|
|
|
|
|
|
|
|
|
|
|
|
|
|
|
|
|
|
|
|
|
|
|
|
|
|
|
|
|
|
|
|
|
|
|
|
|
|
|
|
|
|
|
|
|
|
|
|
|
|
|
|
|
|
|
|
|
|
|
|
|
|
|
|
|
|
|
|
|
|
|
|
|
|
|
|
|
|
|
|
|
|
|
|
|
|
|
|
|
|
|
|
|
|
|
|
|
|
|
|
|
|
|
|
|
|
|
|
|
|
|
|
|
|
|
|
|
|
|
|
|
|
|
|
|
|
|
|
|
|
|
|
|
|
|
|
|
|
|
|
|
|
|
|
|
|
|
|
|
|
|
|
|
|
|
|
|
|
|
|
|
|
|
|
|
|
|
|
|
|
Mean discharge |
12876 |
m3/s |
|
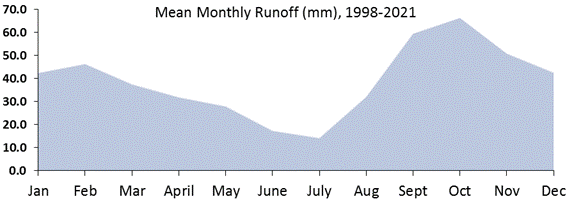
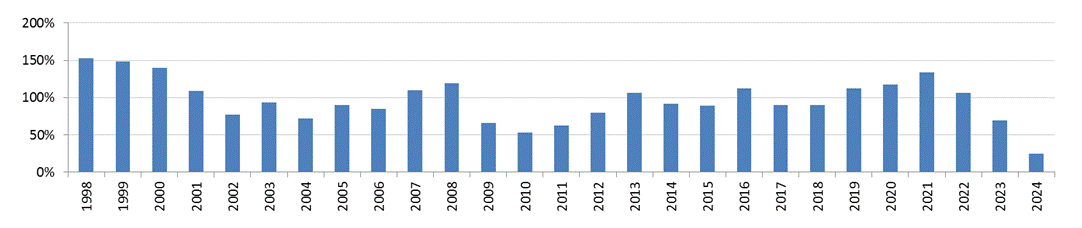
| Annual Runoff (percent of mean, 1998-2021) |
|
|
|
Mean Runoff |
|
443 |
mm |
|
|
|
|
|
|
|
|
|
|
|
|
|
|
|
|
|
|
|
|
|
|
|
|
|
|
|
|
|
|
|
|
|
|
|
|
|
|
|
|
|
|
|
|
|
|
|
|
|
|
|
|
|
|
|
|
|
|
|
|
|
|
|
|
|
|
|
|
|
|
|
|
|
|
|
|
|
|
|
|
|
|
|
|
|
|
|
|
|
|
|
|
|
|
|
|
|
|
|
|
|
|
|
|
|
|
|
|
|
|
|
|
|
|
|
|
|
|
|
|
|
|
|
|
|
|
|
|
|
|
|
|
|
|
|
|
|
|
|
|
|
|
|
|
|
|
|
|
|
|
|
|
|
|
|
|
|
|
|
|
|
|
|
|
|
|
|
|
|
|
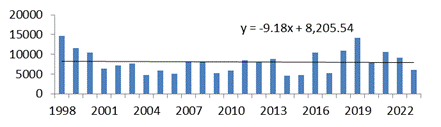
| Mann-Kendall
Runoff Trend Analysis (5%) |
M-K |
-11 |
Significant? |
no |
Major Floods |
|
10 = flood of record |
|
|
|
|
0.00 |
|
z-stat |
-0.22 |
|
|
|
|
|
|
|
| Regression
slope: |
0.00 |
|
p-value |
0.83 |
|
|
|
|
|
|
|
|
|
|
|
|
|
|
|
|
|
|
|
|
|
|
|
|
|
|
|
|
|
|
|
|
|
|
|
|
|
|
|
|
|
|
|
|
|
|
|
|
|
|
|
|
|
|
|
|
|
|
|
|
|
|
|
|
|
|
|
|
|
|
|
|
|
|
|
|
|
|
|
|
Annual Maximum Q, m3/s |
|
|
|
|
|
|
|
|
|
|
|
|
|
|
|
|
|
|
|
|
|
|
|
|
|
|
|
|
|
|
|
|
|
|
|
|
|
|
|
|
|
|
|
|
|
|
|
|
|
|
|
|
|
|
|
|
|
|
|
|
|
|
|
|
|
|
|
|
|
|
|
|
|
|
|
|
|
|
|
|
|
| Brakenridge,
G. R., Nghiem, S. V., Kugler, Z., Kettner, A. J., Paris, S., Cohen, S. |
|
|
|
|
|
Access
to Data |
| River and
Reservoir Watch Version 4.6, DFO Flood Observatory, University of Colorado |
Mann-Kendall Max Q Trend Analysis (5%) |
M-K |
|
|
| Robert.Brakenridge@Colorado.edu |
|
|
|
|
Sen's slope: |
|
51.12 |
z-stat |
|
|
|
|
|
|
|
|
|
Regression slope: |
-29.36 |
p-value |
0.72 |
|
|
|
|
|
|
|
|
|
|
|
Significant? |
no |
|
|
|
|
Coefficients of
Polynomial or Linear Rating Curve used: |
|
0.00 |
|
-247114.59 |
239824.38 |
|
|
|
|
|
|
|
|
x^4 |
x^3 |
x^2 |
x |
+ |
|
|
|
|
|
|
|
|
|
|
|
|
|
|