
NASA-MODIS Record of the 2011 Sendai Tsunami
G. R. Brakenridge, Dartmouth Flood Observatory, University of Colorado
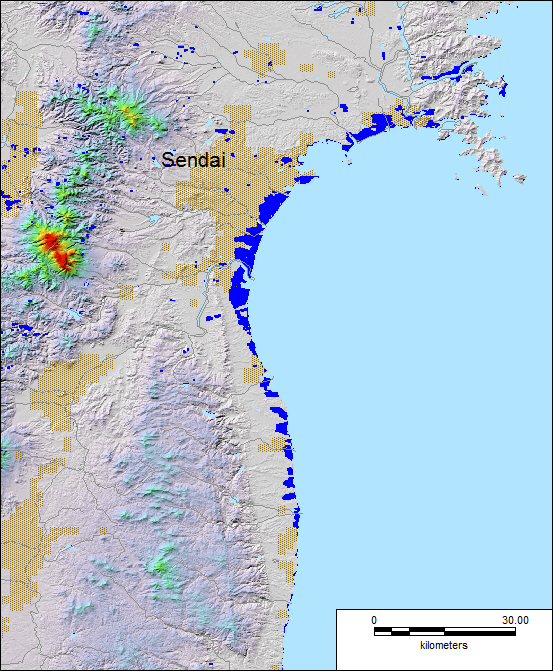
Explanation
The above shows, in dark blue, the landward extent of the March 11 Sendai Tsunami as imaged on March 13 by the two MODIS sensors. The shaded relief background illustrates topography provided by the NASA SRTM data. See also a Powerpoint file, which will also be updated as new results are produced.
NASA's MODIS sensors provide always-on coverage of the Earth's surface at a maximum spatial resolution of 250 m. Coverage is thus not very detailed, but this remote sensing is often the first available after a major disaster; and is also the best choice for rapid location of affected areas or for mapping surface water changes over large areas.
These data are processed at the Observatory to provide consistent water/land classification and boundaries. The data are then ingested into GIS (geographical information system) software. Output data products include map displays such as the above, but also the GIS water area outlines (in .shp and other standard formats). These can be accessed by end users in an ftp directory at http://floodobservatory.colorado.edu/GISdata/
GIS data and graphics are both online publications of the Dartmouth Flood Observatory, G. R. Brakenridge, 2011. Unrestricted use. Please cite this source.