
River Watch 2
Río Satélite de descarga y escorrentía Medidas: Resumen Técnico
(Satellite River Discharge and Runoff Measurements: Technical Summary)
G. Robert Brakenridge, Albert Kettner, James Syvitski, and Irina Overeem
CSDMS, INSTAAR, University of Colorado
Tom De Groeve
Joint Research Centre of the European Commission, Ispra, Italy
Sagy Cohen
Surface Dynamics Modeling Laboratory, Dept. of Geography, University of Alabama
Son V. Nghiem
Jet Propulsion Laboratory, California Institute of Technology, Pasadena, CA
Updated: February 4, 2014
Proyecto, en preparación
Sensores de microondas por satélite proporcionan cobertura global de la superficie terrestre de la Tierra sobre una base casi diaria y, en ciertas longitudes de onda, sin mayor interferencia de la cubierta de nubes. Usando una estrategia primero desarrollado para sensores ópticos de área amplia (véase, por ejemplo: Brakenridge and others, 2005), estos sensores (por ejemplo, AMSR-E, AMSR-2, TRMM y GPM) se pueden medir los cambios de descarga de los ríos. Como los ríos suben, y aumenta de descarga, sitios de medición de los ríos (~ 10 km x 10 km), observadas desde el espacio, puede controlar de forma muy sensible de estos cambios ( Brakenridge and others, 2007; Brakenridge and others, 2012). Un píxel de la imagen de estas dimensiones centrado sobre un río es comúnmente mezclado: incluidas el agua, bajas emisiones, y la tierra, el aumento de las emisiones. Como la proporción de estas superficies cambia, la radiación emitida neta varía.
Transformation of the remote sensing signal to actual discharge values is accomplished via use of a rating equation (as is the case for stage-based discharge measurements on the ground). For River Watch 2, the calibrating discharge values are obtained by runs of a global runoff model (WBM). Five years (2003-2007) provide abundant data for calibration. The model produces daily discharge values for these years, at each measurement site (the global grid resolution is 10 km). As shown on the site displays (click "obtain data" on each site), a signal-discharge rating curve results. The rating curve equation then transforms the daily signal data to discharge.
The rating curve uses monthly maximum, minimum, and mean daily discharges for both model output and the remote sensing (n=180). We expect scatter: both model and remote sensing error are included. Thus, the model may perform poorly at a site, while the remote sensing is tracking discharge changes very well. Or the site may be poorly located and the remote sensing signal may not sensitively record discharge changes: even while the model performs well. However, in many cases, at well-chosen sites, there is strong correlation of modeled discharge values and the independent remote sensing signal. In such cases, it is clear that both are tracking discharge changes. The degree of correlation does not, however, verifiy the discharge magnitudes (there could be model bias, thus making the discharge values uniformly too high or too low). Testing is therefore performed to compare River Watch 2 discharge output with ground-based gauging station data. See the online U.S. examples in this regard. Where ground gauging stations and satellite gauging sites are co-located, the remote sensing can be calibrated to discharge directly via the ground information. These sites therefore compare model-based and ground station-based rating curves. This allows evaluation of model bias and the overall accuracy and precision of this method of measuring discharge changes.
River Watch 2 uses the NASA/Japanese Space Agency "Advanced Scanning Microwave Radiometer (AMSR-E)" band at 36.5 GHz, the NASA/Japanese Space Agency TRMM 37 GHz channel,, and 37 GHz information from the new AMSR-2 sensor. The discharge estimator (the remote sensing signal) is a ratio of the daily calibrating value ("C") that represent that day's driest (brightest) emissivity within a 7 pixel x 7 pixel array surrounding the site, and "M", the emissivity from a measurement pixel centered over the river and its floodplain. C/M is very sensitive to changing surface water area within the M pixel and removes most other sources of emission variation that affect all of the pixels.
At mid-latitudes, the microwave pixel dimensions in the gridded global data products uses are approximately 10 km. It is important that the M pixel be large enough to avoid saturation (complete filling of the measurement pixel by water) during flood events. It is also important that the pixel include a relatively uniform stretch of river without major tributary junctions, or nearby streams, or other variable water bodies. Local site characteristics strongly affect the sensitvity and signal/noise ratio of this method. Each site display thus provides a link to visualize the measurement pixel being used as the monitoring site. Careful quality control must be provided at each site, beginning with visual examination of the site characteristics. We are still performing such work, so that some sites may be deleted in the future. However, there are thousands of more potential river measurement sites to be added.
The initiation and removal of river ice cover can also be detected: ice breakup immediately affects the C/M ratio as low-emission water replaces ice within the pixel. See Brakenridge and others (2007) for the initial research paper describing this approach, Brakenridge and others (2012) for updated information, and another technical report by Kugler and De Groeve (2007). A list of relevant references is also available.
The River Watch approach is novel in that microwave sensors designed to monitor the atmosphere and precipitation are here employed to directly measure river discharge changes and watershed runoff on the ground. This is possible because the sensors used include multiple microwave bands designed for different purposes. Thus, to examine atmospheric conditions, such as precipitation, ground-sensing channels were included in order to provide the background component of upwelling microwave radiation. River Watch uses just these ground-sensing channels to monitor surface water changes. River Watch 2 replaces an earlier version that used only AMSR-E, somewhat different signal algorithm, and a different calibration approch. River Watch 2 is now running forward in time using TRMM and ASMR-2 information (AMSR-E has ceased operation).
Currently, all data are processed as forward-running 4 day means. This is because, especially for lower latitudes and AMSR-E, sensor coverage at a given measurement pixel sometimes skips a day or two. When ground station date are used for comparisons, these too are refomulated into 4 day means.
Discharge data are fundamental for observation of surface runoff (commonly expressed as discharged water volume/watershed area, in mm). Seven day runoff maps showing runoff and runoff anomaly values for each watershed associated with a discharge measurement site.
This is a cooperative project between the University of Colorado, Boulder, CO, USA and GDACS-GFDS (Global Disaster Alert Coordination System, Global Flood Detection System), European Commission Joint Research Centre, Ispra, Italy, the University of Alabama, and the Jet Propulsion Laboratory. The Dartmouth Flood Observatory at the University of Colorado is supported in part by grants from NASA. We wish to thank Dr. Bob Adler, University of Maryland, for initial suggestion that the TRMM sensor data could be used in addition to that from AMSR-E.
Accuracy assessment:
Compared to Ground Data
Within the U.S., where abundant gauging station-based discharge data are available, the accuracy of the River Watch measurements can be directly evaluated. Nash-Sutcliffe (N-S) statistics are commonly used to evaluate time series from hydrological model outputs. They can also compare remote sensing information to observed ground truth (local gauging station data). At River Watch sites, there are commonly at least 10 years of daily data for such comparisons. Based on such, an accuracy classification of River Watch site data outputs is implemented using these statistics. From the Wikipedia link provided above: "Nash–Sutcliffe efficiencies can range from −∞ to 1. An efficiency of 1 (E = 1) corresponds to a perfect match of modeled discharge to the observed data...Essentially, the closer the model efficiency is to 1, the more accurate the model is."
N-S values of 1 thus indicate a perfect fit; and values as low as .75 are commonly used in the literature to indicate that a model, or, in this case, the remote sensing, is performing very well in predicting the actual time series. Therefore, N-S statistics are computed for all sites where ground truth data are available, and for both daily (mean discharge, M3/sec) and monthly (total runoff, mm) time series. We average the published N-S values for both, at each site that is supported by local ground station data, to determine the "site accuracy": as a consistent means to compare performance of the method at each site. As follows (averaged monthly and daily N-S statistic):
>.8, Excellent
.7-.79, Very Good
.6-.69, Good
.47-.59, Fair
<.47, Poor
A separate measure of agreement is provided as a simple scatter plot of all available daily discharge value pairs (station and remote sensing). Linear regression for such comparisons yield R-squared values (several thousand observations). This correlation coefficient is not formally incorporated in the accuracy evaluation, but is provided as complementary information. Note also that N-S values are commonly higher for monthly runoff observations than for daily discharge and that the overall accuracy averages both.
Compared to Modeling
The U.S. sites with associated ground gauging station date allow the most rigorous evaluation of the accuracy of this method. However, most existing River Watch 2 measurement sites are not supported by local ground station data. These sites are calibrated to discharge units, as noted, by the use of the WBM hydrological model run for a standard 5 year interval (2003-2007). A model-based rating curve is thereby developed, and the shape of this curve can greatly affect the accuracy of the results. We can, however, assess how well the independent modeling agrees with the remote sensing signal. The rating "curves" are linear or second-order polynomial equations. For all River Watch measurement sites, whether supported by ground station data or not, the WBM model results are compared to the remote sensing using both Nash-Sutcliffe statistics and a simple scatter plot. Five years of monthly daily maximum, minimum, and mean values are plotted and evaluated: thus there are 180 observations.
Where only model-based calibration is available, accuracy of the rating curve is assessed by the value of the scatter plot R-squared, using the following scale:
>.7, Excellent
.6-.69, Very Good
.5-.59, Good
.4-.49, Fair
<.4, Poor
N-S values for the time series are also provided as complementary information, and the associated plots are helpful in, for example, determining if the model/remote sensing series are offset in time and should be adjusted. Note again that significant scatter is expected in this comparison of global-scale hydrological modeling and at-a-site discharge-sensitive remote sensing.
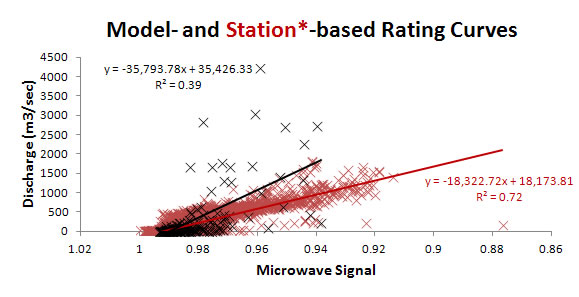
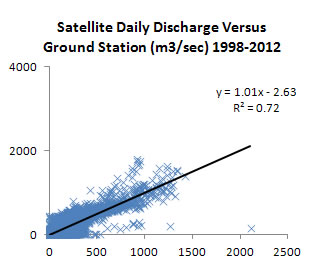
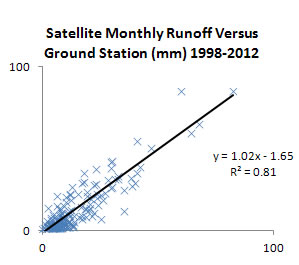
In regard to overall accuracy of discharge and runoff values produced by River Watch 2, comparison results for the measurement sites within the U.S. (those supported by ground station data) suggest consistent WBM model bias: towards generally higher discharge, with the difference increasing for higher flows (example comparison below). Thus, we anticipate that, even when model and remote sensing time series are very strongly correlated, the model-based rating curves somewhat over-estimate runoff volumes and daily discharges. Further analysis can remove such systematic bias from the River Watch sites.
Example: River Watch 2 Site 446, Trinity River, Texas, USA. Left shows two scatter plots as per text above and associated rating equations and R-squared values. Center shows the independent daily discharge output of River Watch 2 remote sensing at this site as compared with the ground gauging station. Right shows the independent monthly runoff output, again as compared to that of the ground station.
Brief listing of known errors: 1) In agricultural areas, irrigation of the measurement and comparison pixels can affect the signal. 2) Intermittent sensor noise (commonly marked in the "M" remote sensing data files by occasional very negative values) occasionally produce intermittent positive spikes in discharge. We are working to filter such instrument noise. 3) Comparison to ground station (stage-based) daily data sometimes indicates significant (1-3 day) lags between the stage peak and the water area (River Watch) flood peak: this introduces error into the scatter plots used to develop rating equations. This is removed, in some cases and as noted in the site displays, by adjusting the two time series to incorporate the observed lag. 4) For rivers flowing along forested floodplains, such as in Amazonia, the daily ratio signal exhibits periodic, high frequency (several days to ~ a week) variabilty about a mean, which itself tracks discharge very well (high model/remote sensing correlation). The daily results may be affected by the tree canopy obscuration of the floodplain and intermittent water on the vegetation: causing the daily discharge signal to be noisy but monthly runoff values to be accurate. Smoothing options for daily data at such sites are being explored.