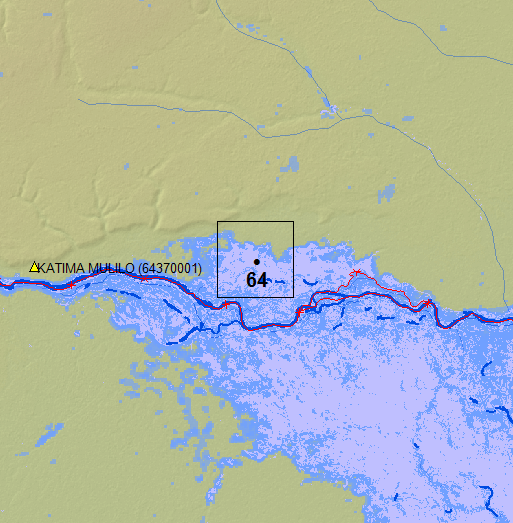
Location of this Satellite Gauging Reach
Medium blue: DFO Maximum Observed Flooding, all sensors, 1993 to present
Light blue: Landsat maximum water over 37 years and DFO Mean Annual Flood. Much of this land floods nearly every year.
Dark blue: NASA Shuttle Water Boundary Data (winter, 2000).
Red: NASA SWOT River Reaches.
Black rectangle: the gauging reach.
The River Watch passive microwave radiometry (PMR) signal records changing water surface area within this SGR (black square): the "M" pixel.
The SGR is .09 x .09 degrees latitude and longitude in size or (at low and middle latitudes) approximately 10 x 10 km.
Each day, the GFDS at the European Commission's Joint Research Center automatically chooses driest pixel comparison values from a 22 x 22 pixel array surrounding this measurement pixel (the "C" values). The resulting M/C ratio is the water area monitoring signal used in the River Watch time series.
Notes for this SGR: 1) Does not include main channel; will show only overbank flooding.
Information on River Watch observation method