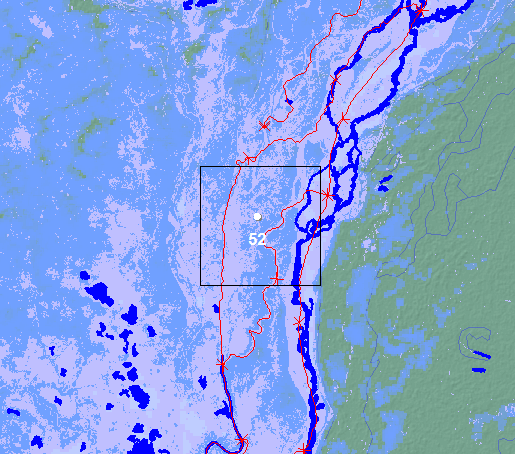
Location of this Satellite Gauging Reach
Medium blue: DFO Maximum Observed Flooding, all sensors, 1993 to present
Light blue: Landsat maximum water over 37 years and DFO Mean Annual Flood. Much of this land floods nearly every year.
Dark blue: NASA Shuttle Water Boundary Data (winter, 2000).
Red: NASA SWOT River Reaches.
Black rectangle: the gauging reach.
The River Watch passive microwave radiometry (PMR) signal records changing water surface area within this SGR (black square): the "M" pixel.
The SGR is .09 x .09 degrees latitude and longitude in size or (at low and middle latitudes) approximately 10 x 10 km.
Each day, the GFDS at the European Commission's Joint Research Center automatically chooses driest pixel comparison values from a 22 x 22 pixel array surrounding this measurement pixel (the "C" values). The resulting M/C ratio is the water area monitoring signal used in the River Watch time series.
Notes for this SGR: 1) The SGR also monitors flood flows west of the Kosi channel and adjacent floodplain. 2) In 2008, the Kosi, upstream of this SGR, avulsed and much flood flow was diverted to the east of this location. 3) The SWOT reaches diverge into three at this location.
Information on River Watch observation methodology
Flag Counter Started: August 26, 2023