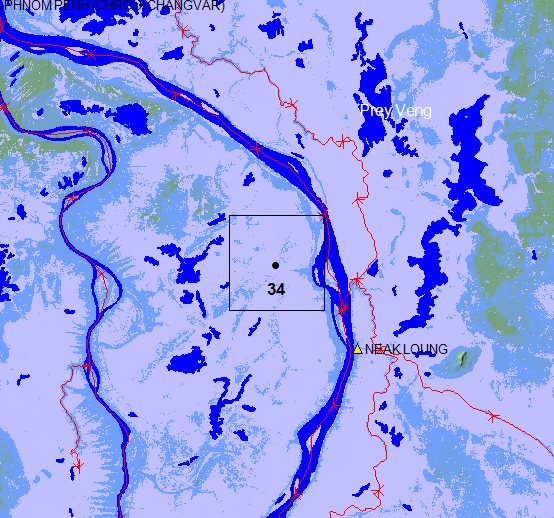
Location of this Satellite Gauging Reach
Medium blue: DFO Maximum Observed Flooding, all sensors, 1993 to present
Light blue: Landsat maximum extent (J-F Pekel and others, 2016, Nature) and DFO "Mean Annual Flood" water extent. Much of this land floods nearly every year.
Dark blue: NASA Shuttle Water Boundary Data (winter, 2000).
Red: NASA SWOT River Reaches
Black rectangle: the measurement reach
The River Watch passive microwave radiometry (PMR) signal records changing water surface area within this SGR (black square): the "M" pixel.
The SGR is .09 x .09 degrees latitude and longitude in size or (at low and middle latitudes) approximately 10 x 10 km.
Each day, the GFDS at the European Commission's Joint Research Center automatically chooses driest pixel comparison values from a 22 x 22 pixel array surrounding this measurement pixel (the "C" values). The resulting M/C ratio is the water area monitoring signal used in the River Watch time series.
Notes for this SGR: 1) The location is nearly completely innundated every year. 2) Irrigated agriculture seasonally floods much of the land area shown and the PMR signal thus is mainly recording these changes in water surface area. 3) The SWOT measurement reaches along the river channels sense the changing river water levels.
For information on data and processing by GFDS and River Watch see: GR Brakenridge, SV Nghiem, Z Kugler, 2023, Earth and Space Science.
Flag Counter Started: August 22, 2023