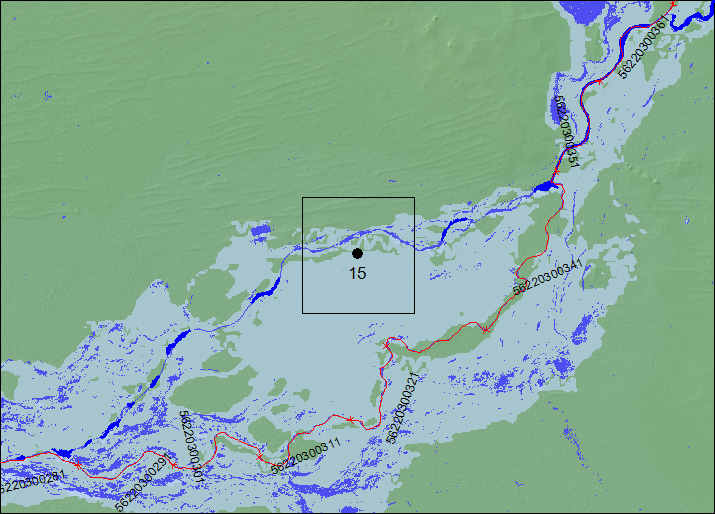
Location of this Satellite Gauging Reach
Medium blue: DFO Maximum Observed Flooding, all sensors, 1993 to present
Light blue: Landsat maximum water over 37 years and DFO Mean Annual Flood. Much of this land floods nearly every year.
Dark blue: NASA Shuttle Water Boundary Data (winter, 2000).
Red: NASA SWOT River Reaches.
Black rectangle: the gauging reach.
The River Watch passive microwave radiometry (PMR) signal records changing water surface area within this SGR (black square): the "M" pixel.
The SGR is .09 x .09 degrees latitude and longitude in size or (at low and middle latitudes) approximately 10 x 10 km.
Each day, the GFDS at the European Commission's Joint Research Center automatically chooses driest pixel comparison values from a 22 x 22 pixel array surrounding this measurement pixel (the "C" values). The resulting M/C ratio is the water area monitoring signal used in the River Watch time series.
Notes for this SGR: 1) This location only meassures one of three branches of the river. 2) The SWOT reaches monitor the middle branch. 3) This SGR provides reliable information concerning major floods, during which all three branches carry water and the floodplains between are also inundated. 4) A better SGR location using these data would be 2 pixels east and one pixel north, in order to monitor all of the river flow. 5) The WBM modeling results used to calibrate the SGR signal to discharge refer to total river flow.
Information on River Watch observation method
Flag Counter Started: August 21, 2023