


Citation: Brakenridge, G.R., Anderson, E., Kettner, A.J., Slayback, D. and Policelli, F., date accessed, "Global Atlas of Floodplains, Sheet #", Dartmouth Flood Observatory, University of Colorado, Boulder, CO, USA, http://floodobservatory.colorado.edu/.
To create this Atlas, satellite data are obtained by the Flood Observatory, processed to detect water/land boundaries, and analyzed to produce flood inundation limits in vector GIS format. The maps are updated when new floods occur. The Observatory also accepts GIS flood inundation limits from other sources and incorporates this information with permission of the authors. The Atlas becomes increasingly comprehensive as new events are added. The date of last update is shown on each map. Archival satellite data are also being used to map older flood events and are described here when used.
The map sheet number gives geographic coordinates of the upper left corner of map. Most maps measure 10 degrees in both longitude and latitude and are in plate-carree (equirectangular) projection. Sheets above 60 degrees north are in UTM projections and measure 20 degrees in longitude. A large scale Geotif version is also available.
Color coding: 2015, 2014, 2013, 2012, 2011, 2010, 2009, 2008, 2007, 2006, 2005, 2004, 2003, 2002, 2001, 2000, pre-2000. The Shuttle Water Boundary Data (SWBD, February, 2002) are at 90 m spatial resolution and provide a useful reference water between latitudes 60 degrees south and 56 degrees north. Where used, it is the uppermost map layer (this color). Otherwise, the map layers are arranged sequentially by year, with oldest at bottom.
Floods in mountainous regions are exceptionally hazardous, but they are difficult remote sensing targets and not always observable. Additionally, cloud cover or other constraints sometimes restrict the ability to capture peak inundation everywhere. The maps in this Atlas do not illustrate all areas of possible flood hazard.
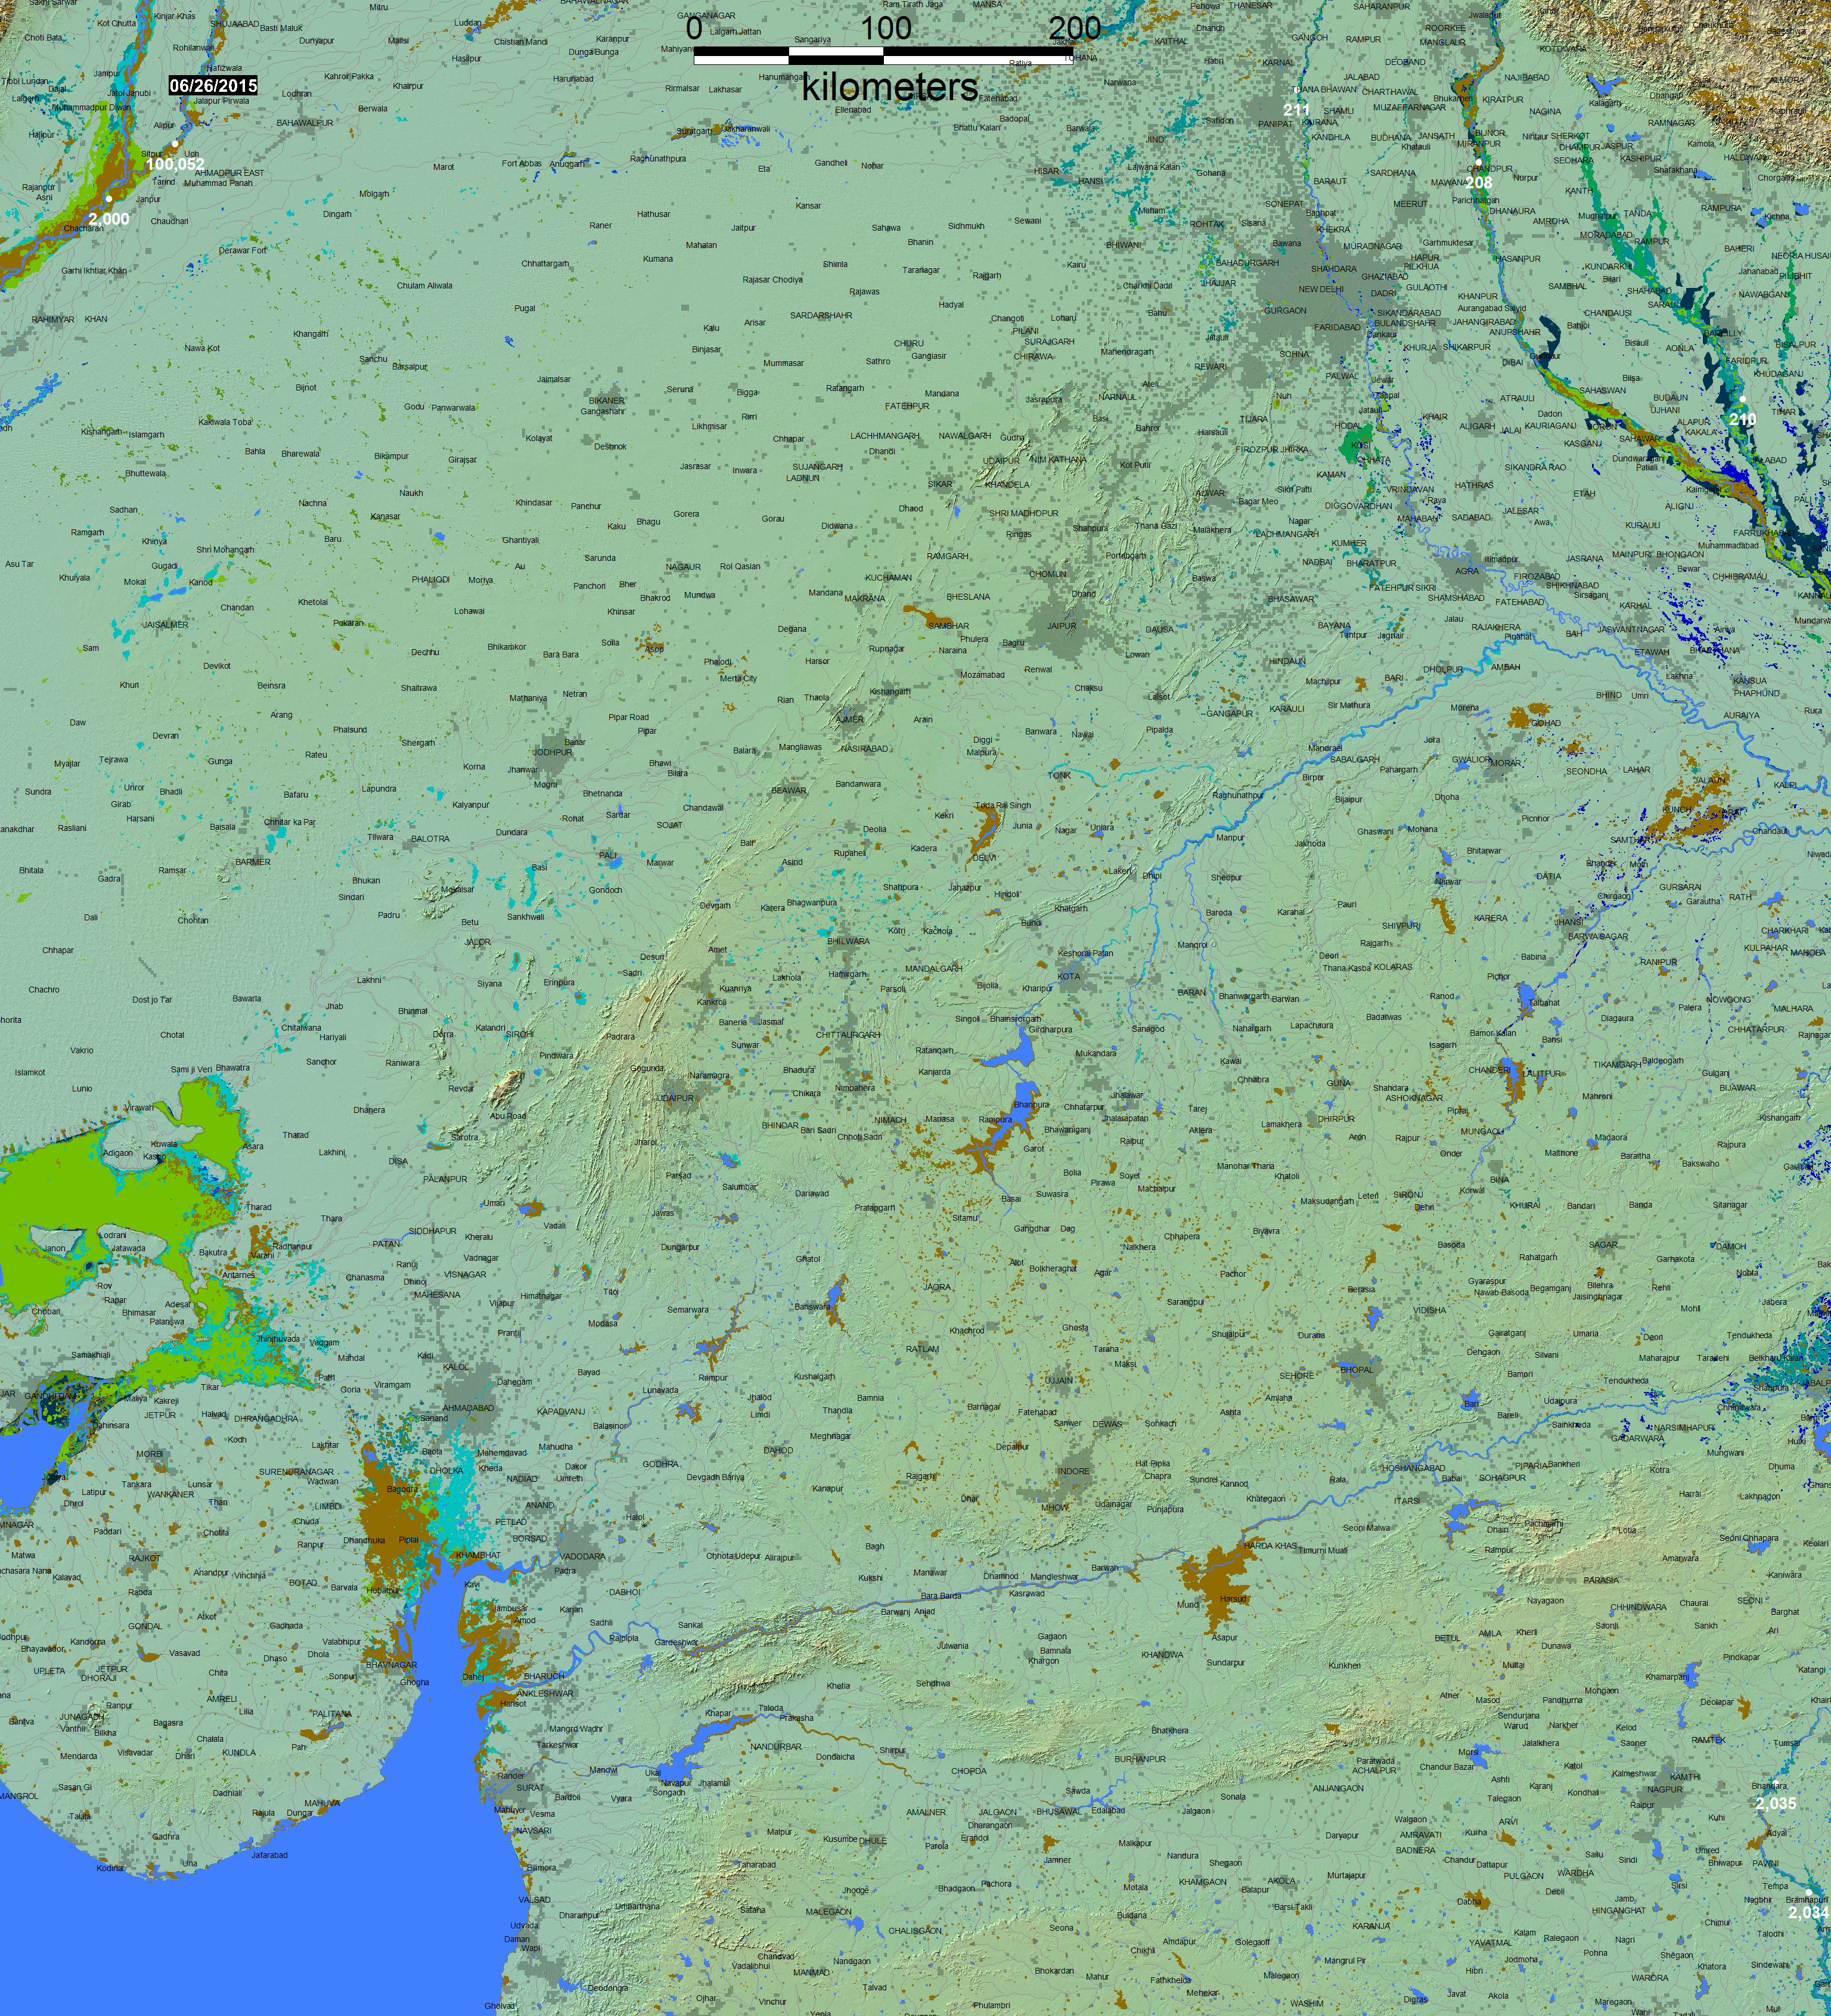
At selected locations, a time series of satellite microwave-based daily river discharge measurements are available from the Flood Observatory. See River Watch Global Display for more information. A sample from Site 211 in this map sheet is shown below. In the online version of this map sheet, the river reaches monitored by each site are clickable and provide data access.

The Land Atmosphere Near-real time Capability for EOS (LANCE) system, operated by NASA/GSFC, provides daily MODIS data at 250 m spatial resolution. Landsat 8 data, if used, are provided by the U.S. Geological Survey Hazards Data Distribution System. Landsat 8 is jointly managed by NASA and the United States Geological Survey. COSMO-Sky Med SAR data are occasionally provided by the Italian Space Agency (ASI) as contribution to the CEOS Flood Pilot. Sentinel 1 SAR data, when used, are provided by the European Space Agency. NASA EO-1satellite tasking and data are provided by Stuart Frye and colleagues at the NASA Goddard Space Flight Center. MODIS data beginning in year 2012 are based on an automated product provided by NASA Goddard Space Flight Center. The non-automated, MODIS-based .shp or MapInfo files before year 2012 are located in a special map sheet folder, here together with any other higher resolution (Landsat 8, EO-1, etc) .shp or MapInfo files (including all third party data available for redistribution). Click here for access to the automated daily .shp file GIS record (record commences in 2011). Choose map sheet directory and appropriate dates.
As part of collaborations with other disaster response/satelllite mapping organizations, and the Global Flood Partnership, our maps and other data are provided through the above links. With appropriate citation, they can be used freely, including for commercial purposes, under the terms of the Creative Commons Attribution 3.0 Unported License.