![]()
Published: November 10, 2022
G. Robert Brakenridge, Albert J. Kettner, Frederick S. Policelli, and Dan A. Slayback
Blue: Permanent Surface Water
Very Light Gray: Estimate of Mean Annual Flood using MODIS and LANDSAT time series data
Gray: Maximum Observed Flooding, all sensors, 1993 to present
Clickable and numbered black circles: River Watch Satellite Gauging Reaches
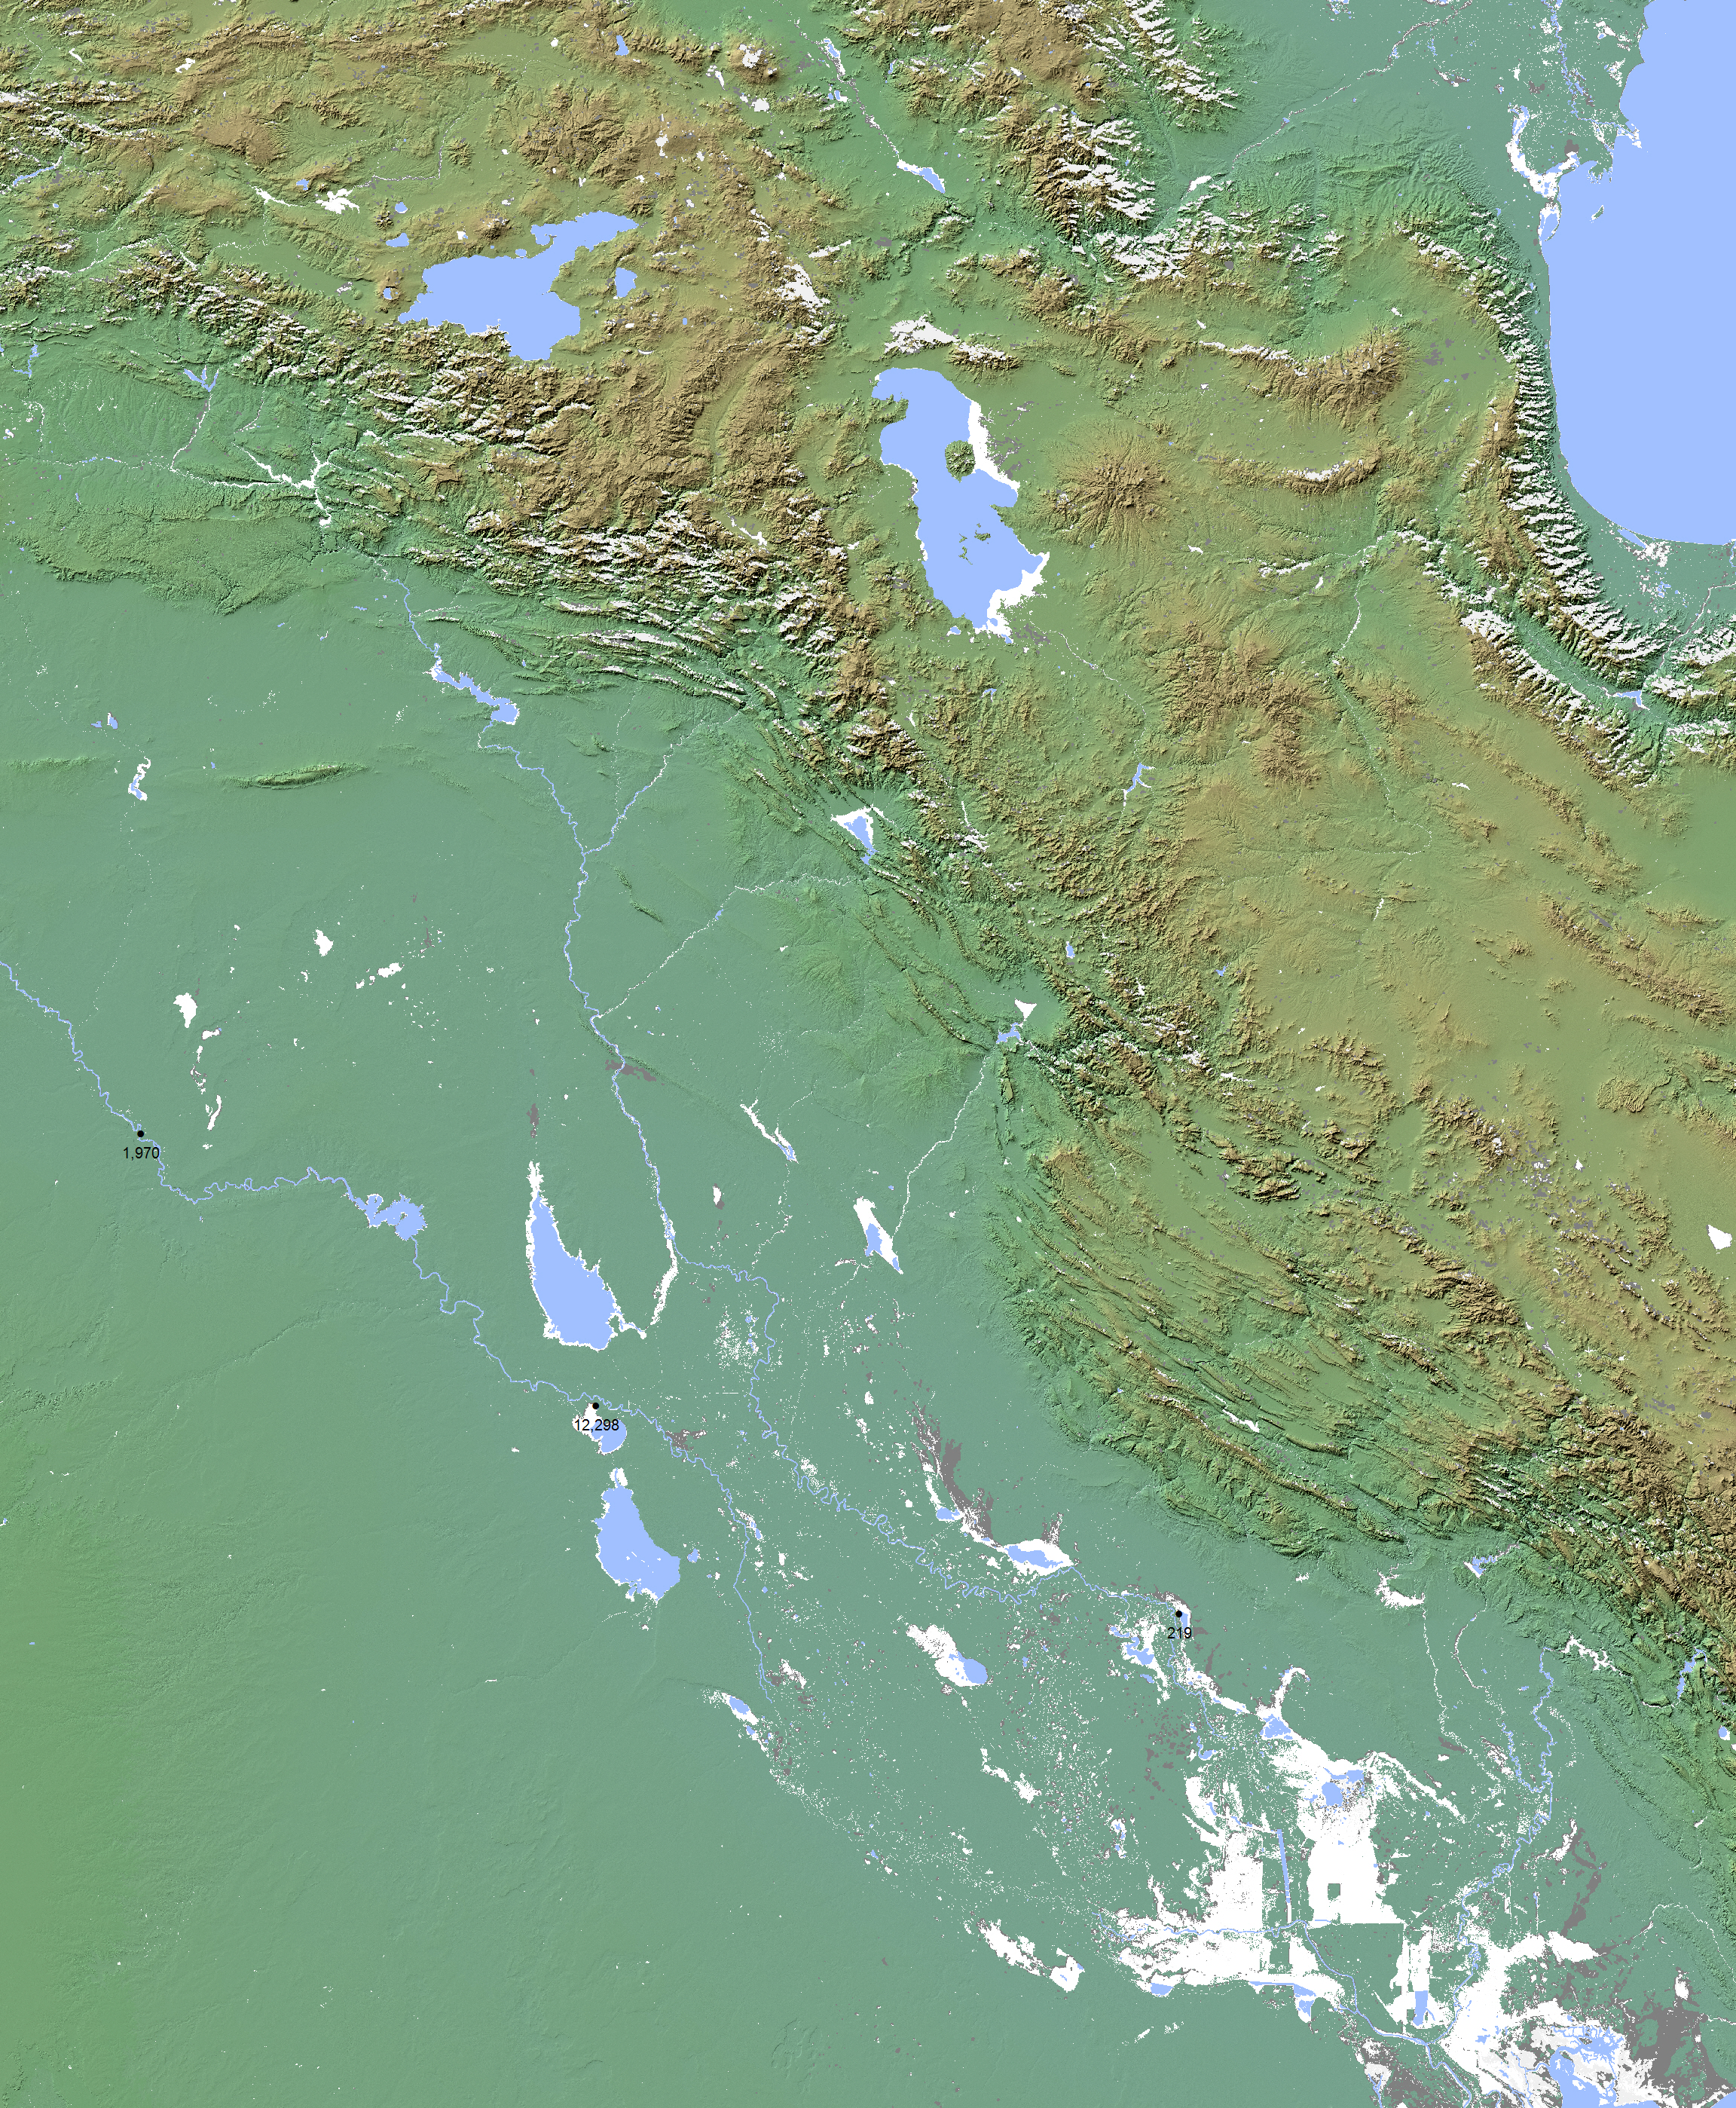
Permanent Surface Water is from the Shuttle Radar Topography Mission Water Body Data at 90 m spatial resolution (February, 2000).
The Estimate of Mean Annual Flood includes two data layers: 1) Surface water detected in three out of five years by the MODIS sensors (2012-2016), 250 m spatial resolution. 2) Data from the Global Surface Water Explorer 30 m resolution (from their "recurrence" layer). This land floods frequently: approximately 6 out of 10 years; recurrence interval of approximately 1.6 yr. The latter data are from Jean-Francois Pekel, A. Cottam, N. Gorelick, A. S. Belward, High-resolution mapping of global surface water and its long-term changes. Nature 540, 418-422 (2016). Data Source: EC JRC/Google. For the MODIS information, shadows may cause false-positive "water" areas in rugged topography.
Maximum observed flooding is a composite of water mapped by DFO since 1993 using a variety of sensors and at spatial resolutions ranging from 10 m to 250 m. This information includes daily MODIS water detection from the near real time flood processor since 2012. Many large floods since 1993 are included but others may have been missed. The Landsat data from the Global Surface Water Explorer showing maximum water extent observed is also used. This land floods infrequently.
This map series is one outcome of a NASA Applied Sciences Project: Integrating Global Remote Sensing and Modeling Systems for Local Flood Prediction and Impact Assessment.