River Watch Regional Display for Latin America
River Watch Display para América Latina
Supported by CAF, The Latin American Development Bank, in collaboration with GeoSUR.
Updated Daily at 13:15 MST
Operational Notes: Draft, in preparation
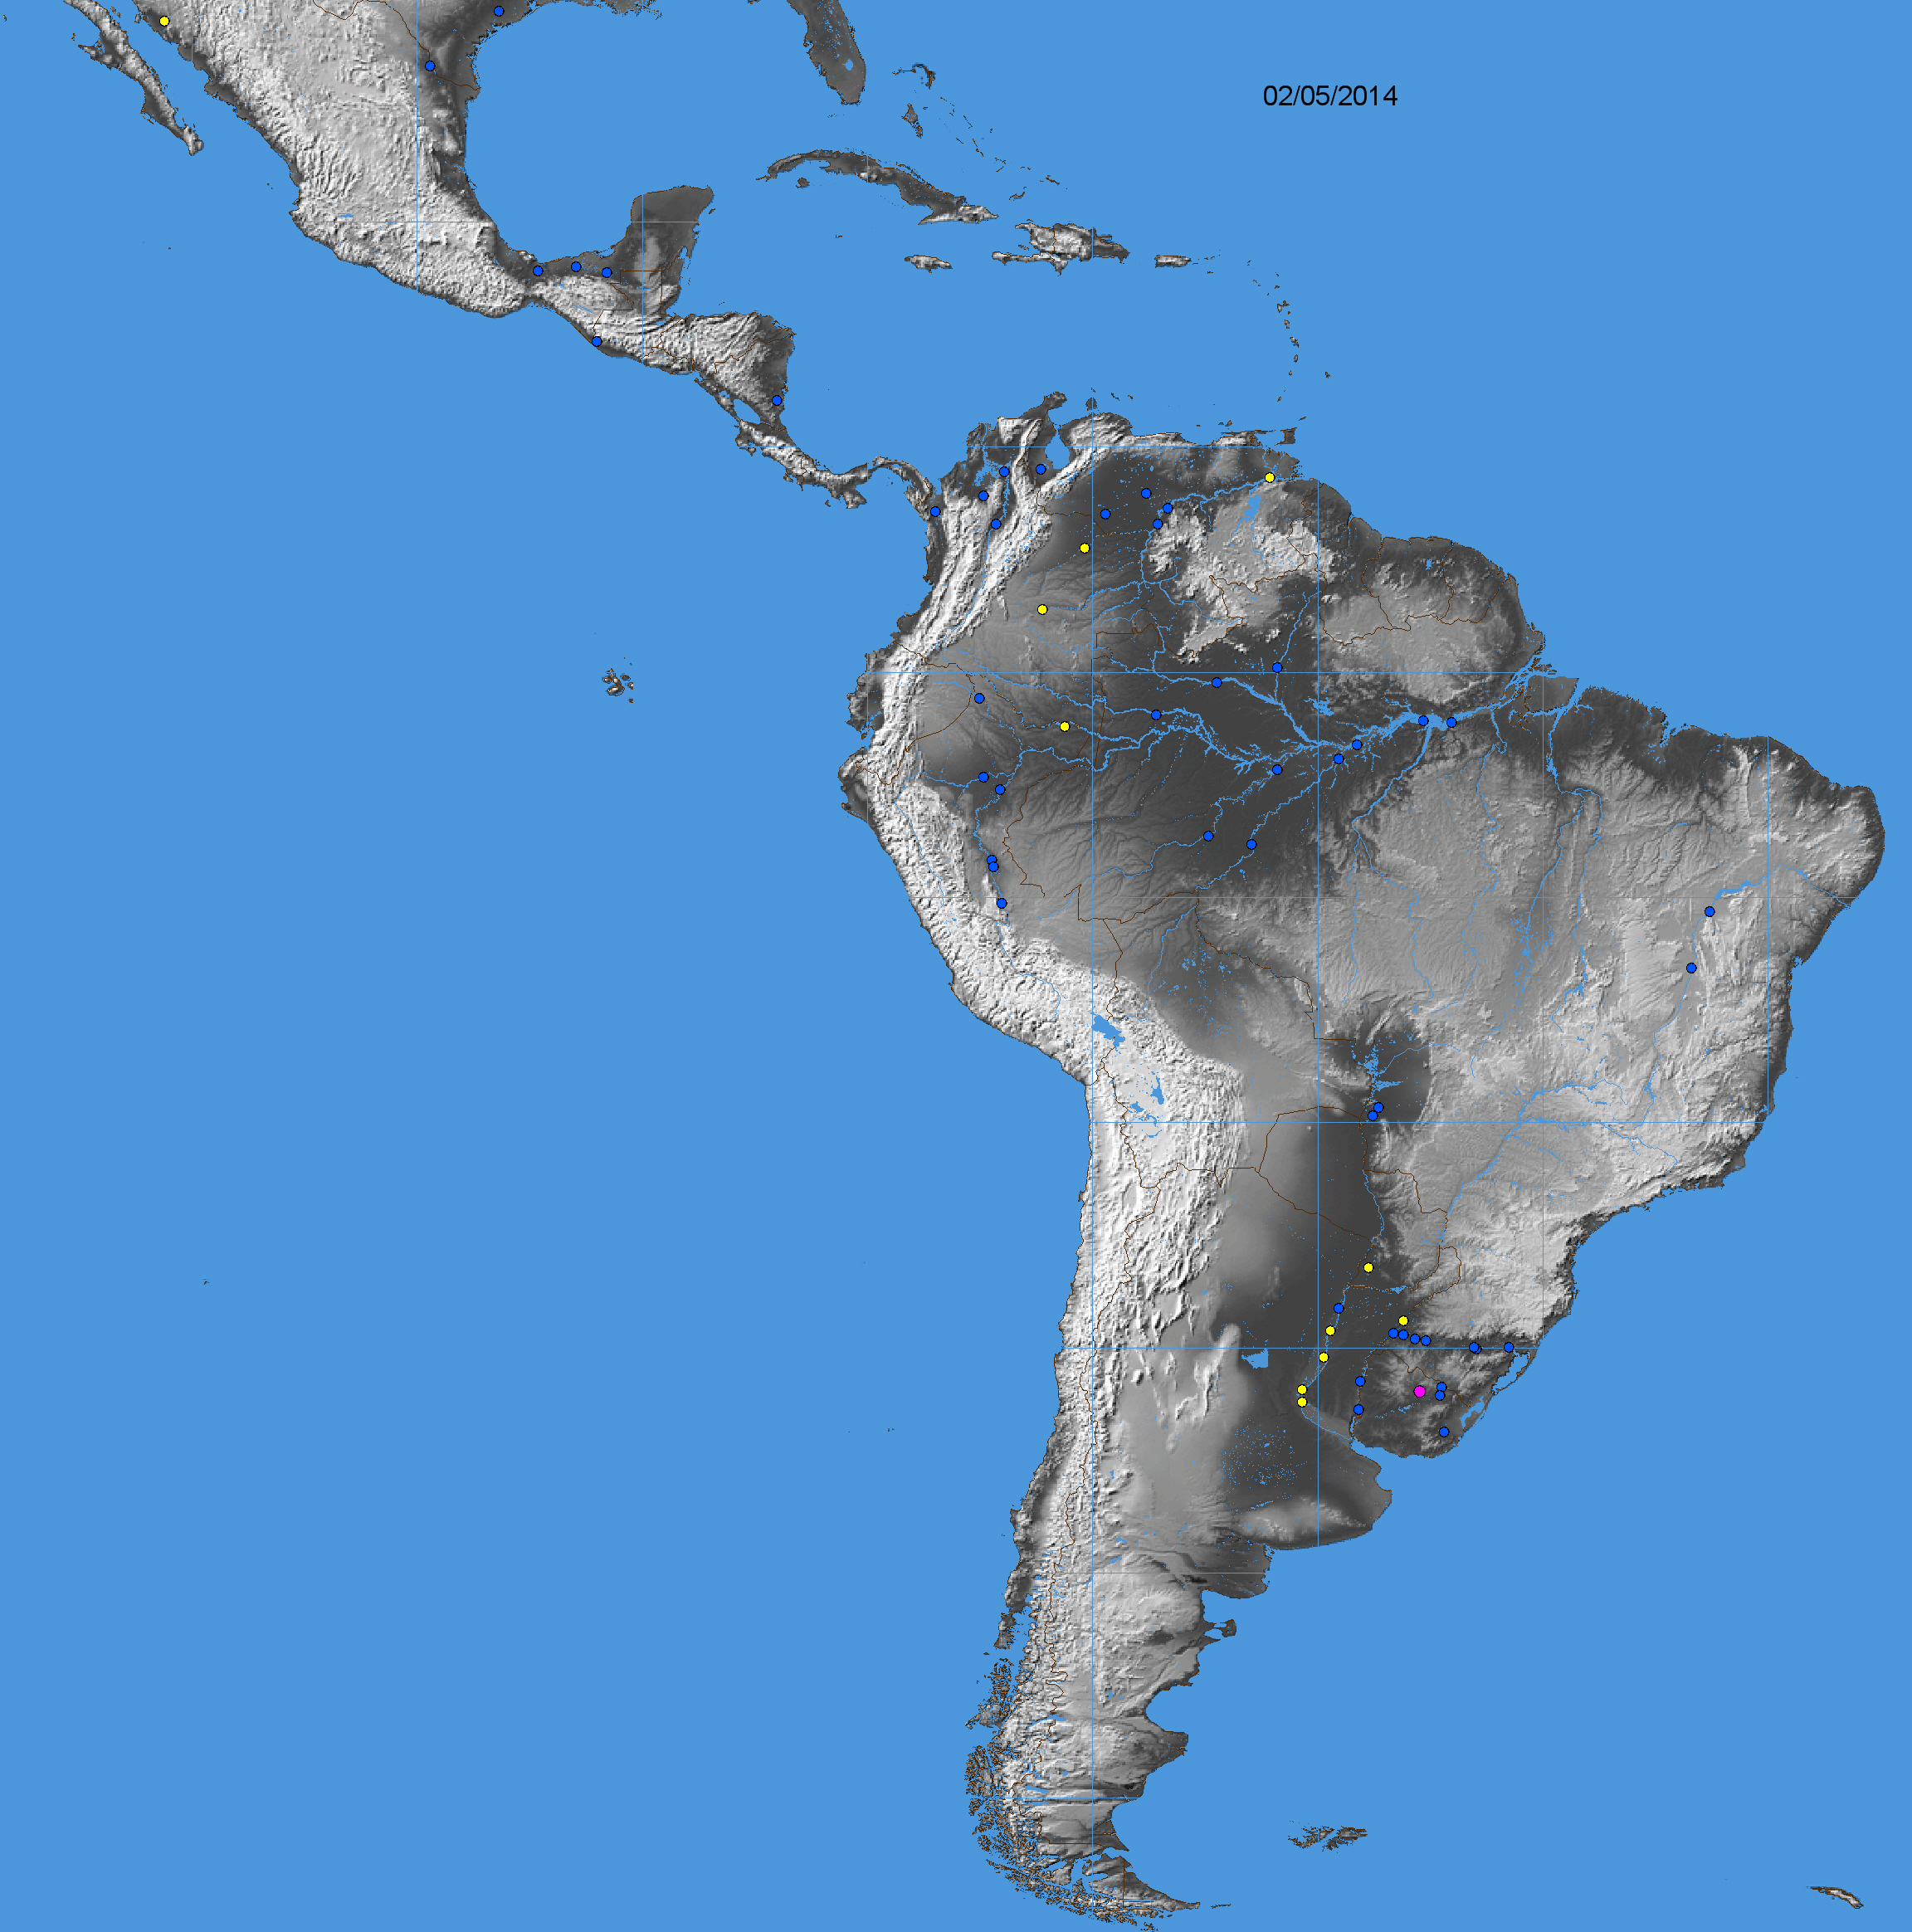
Yellow dots: low flow (<50 % mean daily runoff for this date); Blue dots: normal flow; Purple dots: moderate flooding (>1.33 yr recurrence); Red, major flooding (> 5 yr recurrence).
Period of record for most sites begin January 1, 1998. The Log Pearson III distribution is used for recurrence interval calculation, 1998-2012.
A tabular listing of all sites is available also.
Citation: Brakenridge, G.R., De Groeve, T., Cohen, S., and Nghiem, S. V., date of display, River Watch, Version 2: University of Colorado, Boulder, CO, USA (http://floodobservatory.colorado.edu/DischargeAccess.html). Or individual site display and data: Brakenridge, G.R., De Groeve, T., Cohen, S., and Nghiem, S. V., date of display, River Watch, Version 2, Site #: University of Colorado, Boulder, CO, USA (http://floodobservatory.colorado.edu/SiteDisplays/#.htm).