


![]()
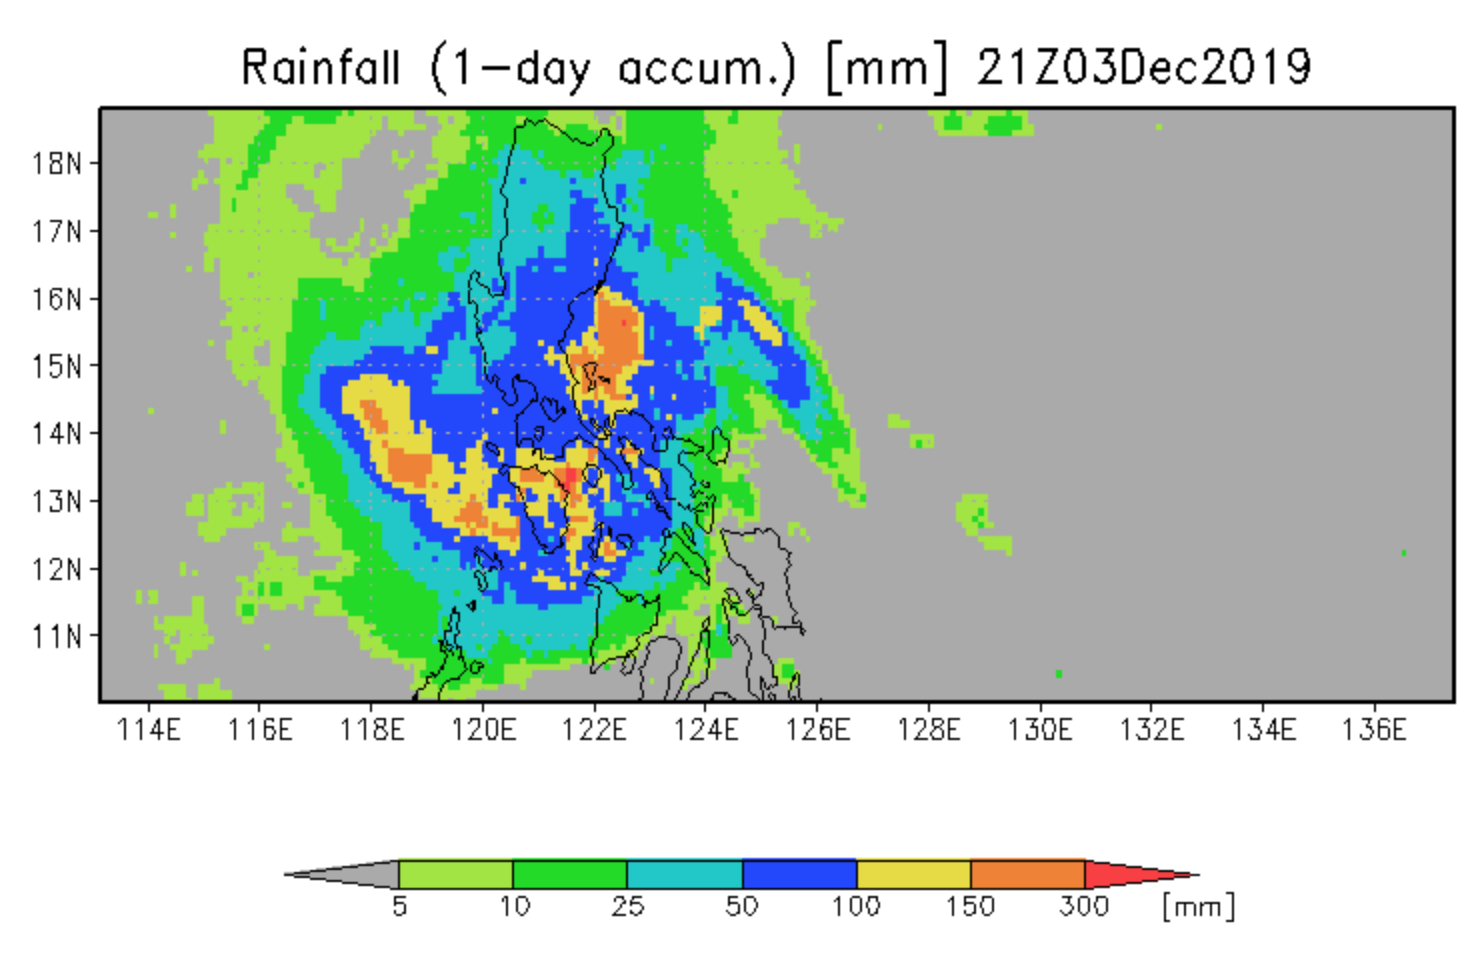
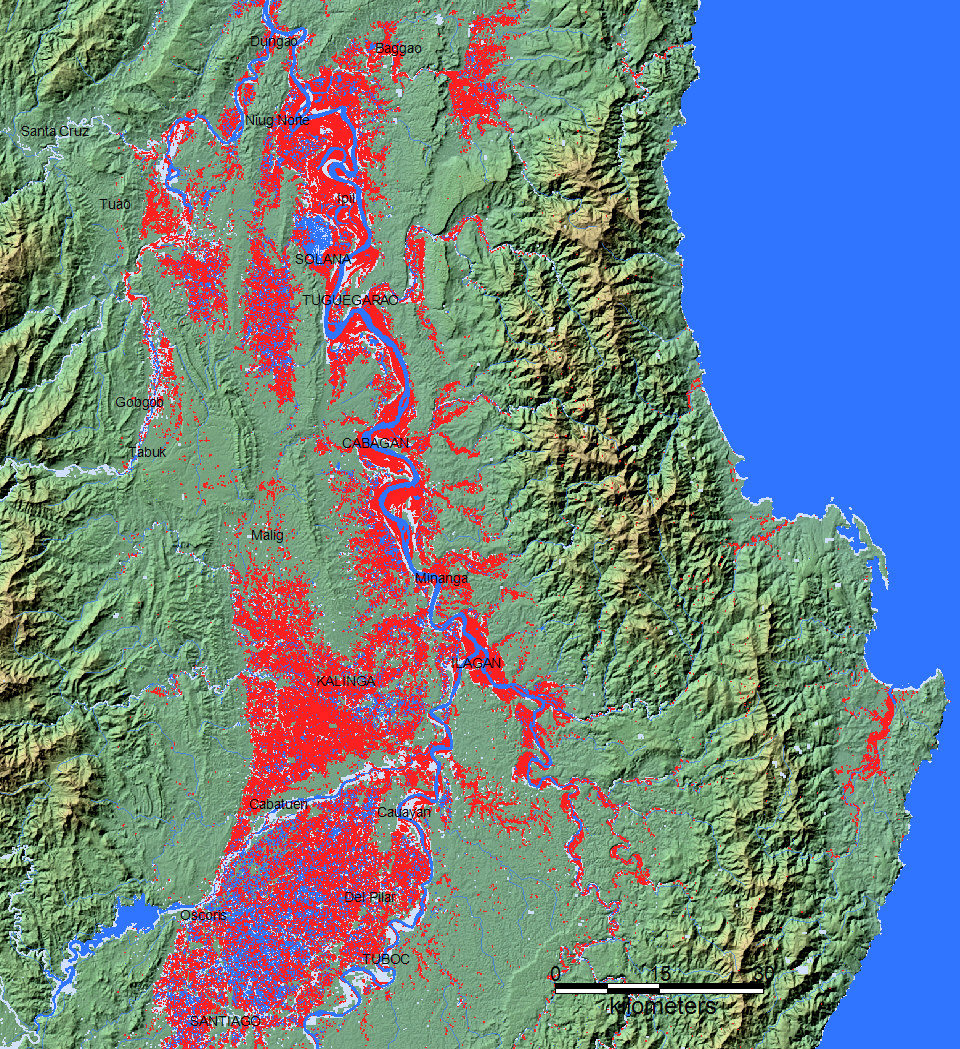
"Philippines – Typhoon Kammuri Leaves Trail of Destruction 4 DECEMBER, 2019 BY FLOODLIST NEWS IN ASIA, NEWS Typhoon Kammuri (known locally as Tisoy) has left a trail of destruction after making landfall in the Philippines several times between 02 and 03 December. Wind gusts of over 200 km/h caused widespread damages, tearing down trees and power lines, and ripping roofs from houses. Local media reported that at least 17 people have died, 2 are missing and 18 were injured, while two others were reported missing. These figures are yet to be officially confirmed. Dozens of roads blocked by fallen trees, with some also blocked by rockfalls or flooding. National Disaster Risk Reduction and Management Council (NDRRMC) said that 18 houses were destroyed and 20 damaged, over 500 flights were cancelled and around 30,000 schools closed. Pre-emptive evacuations were carried out and by 04 December almost half a million people were displaced, including 187,384 in Albay, 162,736 in Camarines Sur and 45,802 in Sorsogon. Several areas received heavy rainfall from 02 December. Masbate City recorded 182.6mm of rain in 24 hours to 03 December and Legazpi in Albay Province 223.5mm during the same period. NDRRMC reported flooding in areas of Panitan and Panay in Capiz Province, Calabarzon and Pagbilao in Quezon, along with parts of Rizal Province. Kammuri made a total of 4 landfalls, one in each of the provinces of Sorsogon, Masbate, Marinduque and Oriental Mindoro provinces. As of 04 December, Philippine Atmospheric, Geophysical and Astronomical Services Administration (PAGASA) reports that Kammuri has weakened into Tropical Storm as it moves west-northwestward over the West Philippine Sea. It is forecast to exit the Philippine Area of Responsibility (PAR) between 04 and 05 December 2019 and become a Tropical Depression by 06 December 2019.." Quoted from Flood List. "The Philippines' north has been hit by some of its worst flooding in decades, with torrents of muddy runoff forcing 66,000 from their homes and prompting rescues of trapped locals, authorities said Friday. Luzon island, the nation's largest, has been hit by a string of storms that have battered its northern tip while monsoon rains were intensified by the passage of Typhoon Kammuri this week. Large swaths of lush green land were inundated after rivers burst their banks, leaving only treetops visible above the waterline. Landslides have cut off roads to some isolated towns and some bridges are covered by the flooding. However, authorities said they have not confirmed any deaths caused by the high water. "This is one of the biggest floods in decades," Rogelio Sending, information officer for Cagayan province in the northeast of Luzon, told AFP. The flood waters have have forced about 66,000 people to flee their homes, some of whom had to be rescued by emergency crews in boats, local disaster authorities said. The north of the country has had heavy rains for nearly a month as part of monsoon season, which was worsened by at least three typhoons that have passed the Philippines since November. Typhoon Kammuri pounded the storm-prone nation this week, leaving at least 13 people dead." Quoted from Physics.org
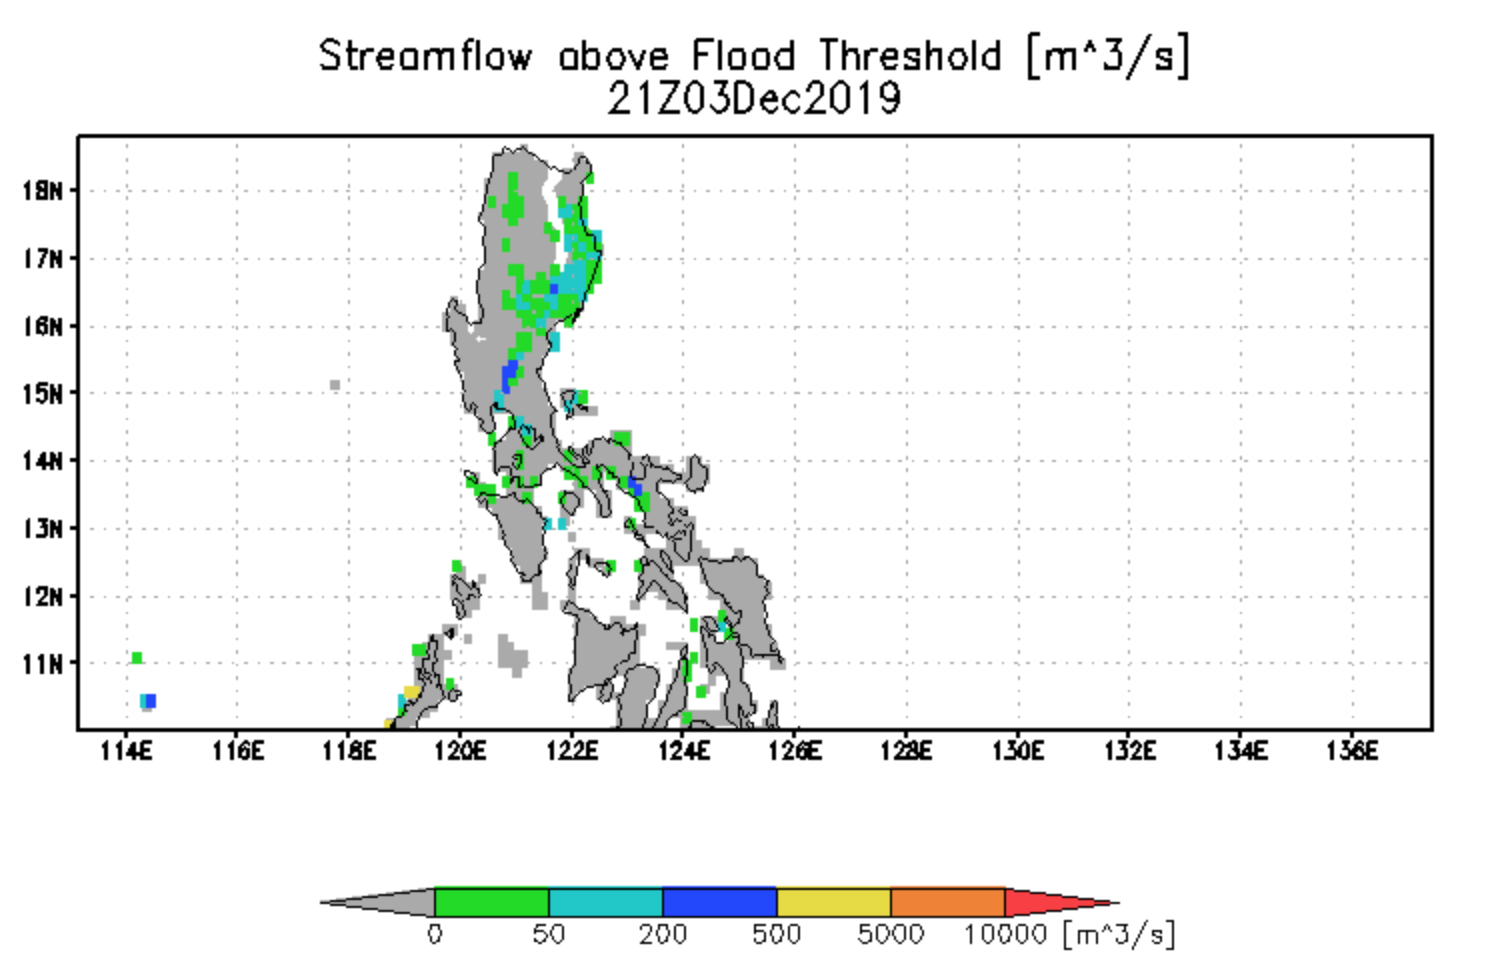
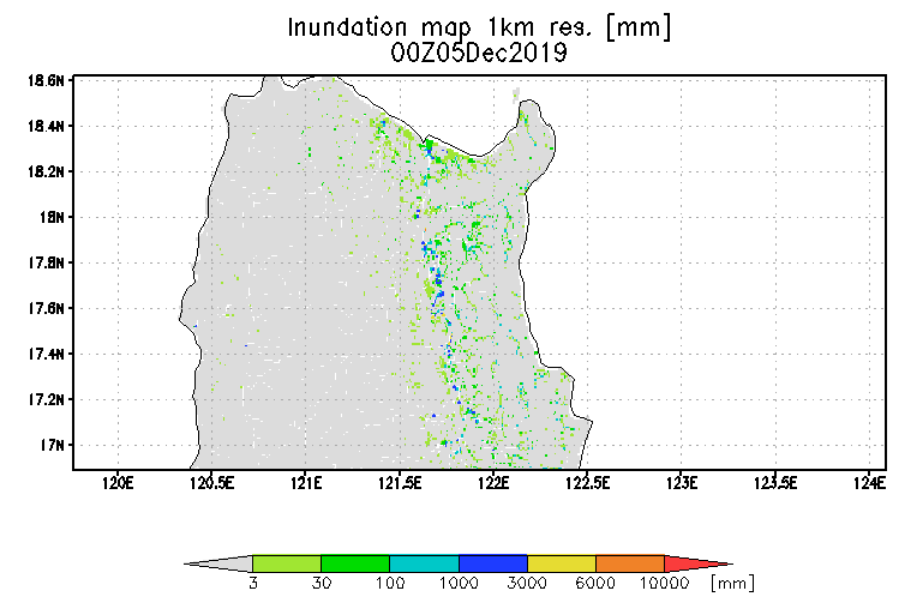
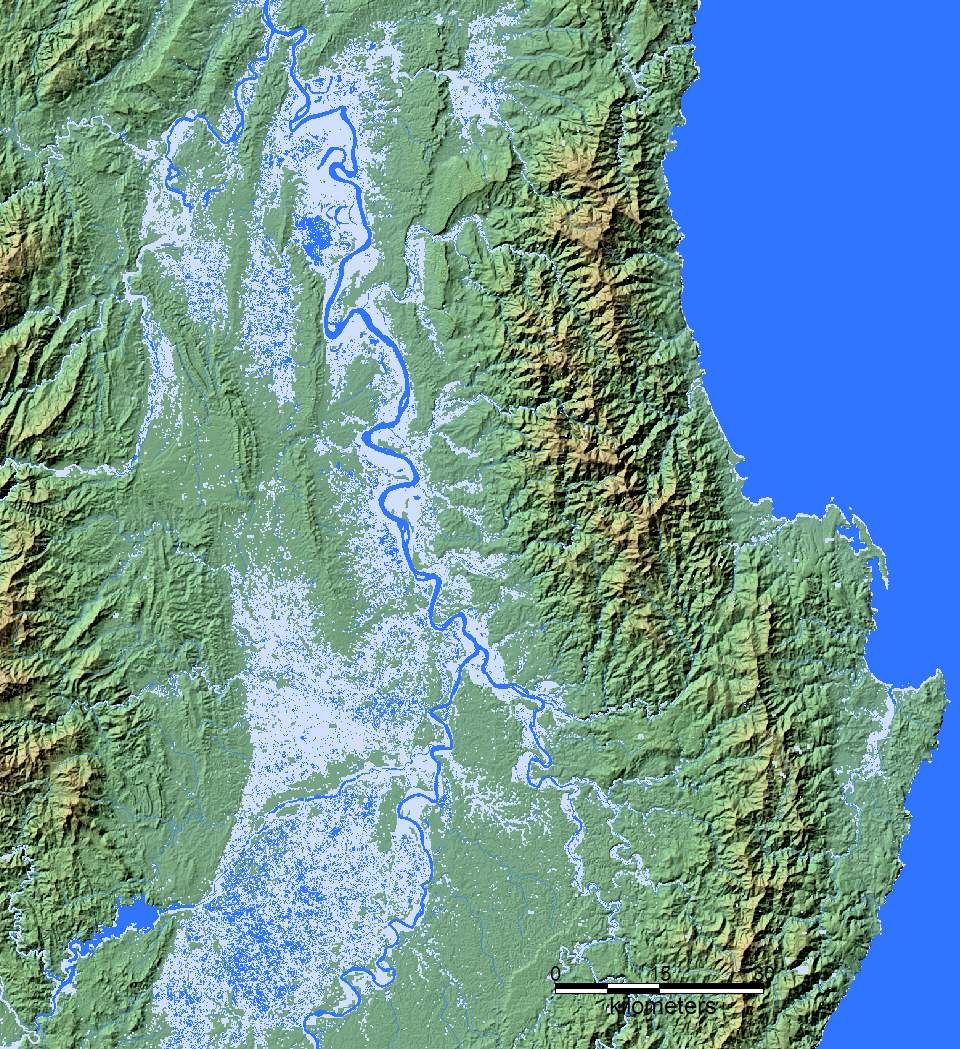
Results from the NASA-supported Global Flood Monitoring System (GFMS) at ESSIC, University of Maryland. Date and UTC time is shown. This is flooding as modeled from input precipitation data and topography. .
Red is all satellite-mapped flooding from this event. Blue is a reference normal water extent. Light gray is all previously mapped flooding, since 1999. Over the course of the event, remote sensing data are combined to show all flooded areas. A larger scale geotif version and flood and reference water GIS files are located here. See also Web Map Server display.
Last update of this map: December 6, 2019.
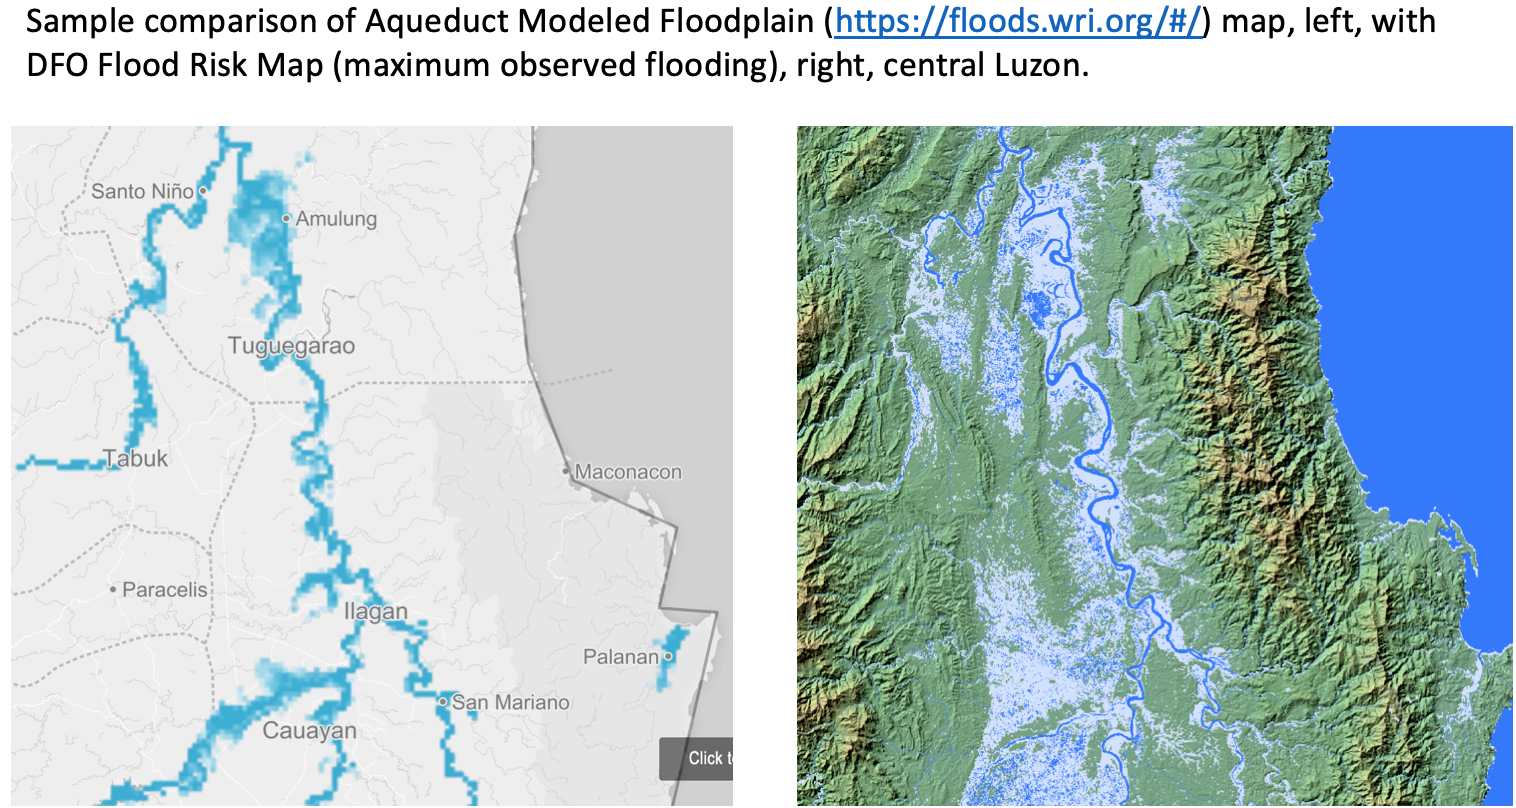
Blue is a reference normal water extent. Light blue-gray is all previously mapped flooding, since 1999. These were areas of known flood risk prior to this flood event. Pink is additional land flooded during this event. This shows the expansion of land with documented flood risk. A large scale geotif version is located here.

Blue is a reference normal water extent. Light blue-gray is all previously mapped flooding including this flood event. This is the revised flood risk map for the area shown. A large scale geotif version is located here.
The Flood Observatory maintains a Global Active Archive of large flood events, 1985 to present. New major flood events are entered into this archive each week. A hand-drawn GIS polygon for each event outlines the region affected.
This event was selected for Observatory production of map and GIS data products. After final updating, this web page and associated image and map (GIS) files become the permanent Flood Observatory record of this flood event, and any new areas inundated are added to the DFO Flood Risk Map for this area (see below).
As part of collaborations with other organizations, including
GEO and the Global Flood
Partnership, the Observatory's maps are made available here to the public.
Geotif versions and GIS files are also available. With attribution, maps and
data can be used freely for non-commercial purposes. With permission, they can
be used for commercial purposes. Consult the Creative Commons Attribution-NonCommercial-ShareAlike 4.0
International License and Robert.Brakenridge or Albert.Kettner (at
Colorado.edu) if questions. Attribution for the Maximum Observed Flooding map when Sentinel SAR data are
included: "Dartmouth Flood Observatory at the University of Colorado, from satellite
data provided by NASA and Copernicus/European Space Agency". When using GIS data
(see below) provided to DFO from other sources, please acknowledge original
source (e.g., AER for the FloodScan product, Cloud 2 Street, etc).
NASA Landsat 8 and Copernicus/ESA Sentinel SAR data if used in this map were obtained from the the U.S. Geological Survey Hazards Data Distribution System. and, for DFO-produced flood mapping, the Sentinels Science Data hub, respectively. Landsat 8 is jointly managed by NASA and the United States Geological Survey. Copernicus is supported by the European Commission. MODIS data are obtained from the NASA NRT Global Flood Mapping facility (surface water extents) and from NASA Worldview (image files); SUOMI/VIIRS image data are also retrieved from NASA Worldview.
Flood and reference water extent files (Shp and Mapinfo versions) supporting this Flood Event Map are located here.
These files may include high spatial resolution mapping such as from Sentinel or Landsat, or lower resolution files from MODIS. File names commonly include the sensor source (e.g., S1 for Sentinel 1, LS8 for Landsat, MODIS, Aqua, or Terra for MODIS, AER for the FloodScan product) and the image date, and also UTC time where availabl..
The NASA Earth Sciences Program, the Latin American Development Bank, the World Bank, the European Commission's Global Disaster Alert and Coordination System, GDACS, and Copernicus Emergency Management Service, the Google Earth Engine research awards program, the Committee on Earth Observation Satellites (CEOS) Disasters Working Group-Flood Pilot, the Japanese Space Agency, and the European Space Agency all have supported the Observatory's work via research grants and contracts or free satellite-derived data.
The Dartmouth Flood Observatory was founded in 1993 at Dartmouth College, Hanover, NH USA and moved to the University of Colorado, INSTAAR, CSDMS in 2010. Its operation depends on continued grant and project support. If your organization uses these data and maps, please consider becoming a Sustaining Partner and helping to sustain this effort. The institutional support of both universities is gratefully acknowledged.
(counting since December 6, 2019)