


![]()
"South Sudan – 200,000 Hit by "Unprecedented Flooding" Says UN 18 OCTOBER, 2019 BY FLOODLIST NEWS IN AFRICA, NEWS The UN High Commissioner for Refugees (UNHCR) reports that unprecedented heavy flooding in South Sudan's Maban County has affected nearly 200,000 people, including refugees and host population. "People are seeking safety from the flood waters wherever they find dry land, mostly on small islands as unprecedented water levels have submerged vast areas," UNHCR said. Situated in the Upper Nile State, the affected area is home to more than 150,000 refugees from Sudan. The area, near Maban's capital town of Bunj, is prone to flooding this time of year because of heavy seasonal rains. Excess water from the Ethiopian highlands, where rainfall is becoming more intense and irregular, is also carving its way through neighbourhoods in broad, swift rivers.
UNHCR, working with its partners and the local authorities said it is rushing emergency support. The affected population is in dire need of humanitarian assistance. "Refugees and South Sudanese locals fled their homes, carrying their belongings and seen gathering together on little islands of dry ground," said Adan Ilmi, UNHCR's Representative to South Sudan. "Flood waters have submerged, making access to the refugee camps difficult for humanitarians. Schools in the region also remain closed," he added. The floods have also impacted access to public services, including hospitals and damaged sanitation facilities– increasing health risks. There is concern that the flooding may increase the risks and spread of diseases. South Sudan was recently declared cholera free last year with the fears that the deadly disease could make a comeback. "UNHCR and partners together with the government have already begun assessments in refugee camps in Maban and surrounding communities. Among main needs identified so far are emergency shelter, food, water, and sanitation. Refugees and local communities urgently need international support as it faces one of the worst floodings within the last decades." Mr. Ilmi emphasized. As an immediate response, UNHCR has pre-positioned emergency shelter kits and material assistance to help more than 5,000 affected families/some 25,000 people to rebuild and repair damaged shelter, but more support is needed. Recently media reported that 2,000 homes were destroyed by flooding in Torit in the far south of the country, leaving thousands homeless. The floods struck after a week of heavy rain that began around 04 October, 2019." Quoted from Flood List.
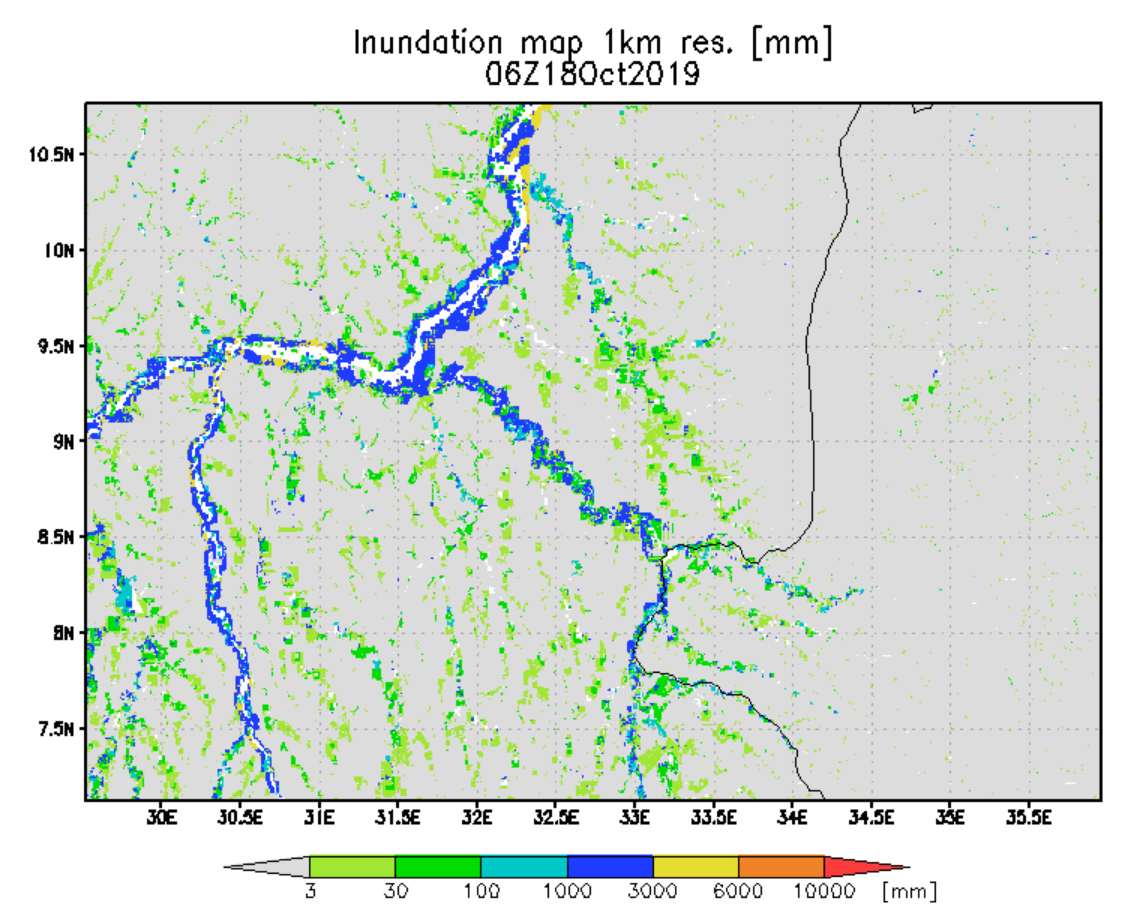
Results from the NASA-supported Global Flood Monitoring System (GFMS) at ESSIC, University of Maryland. Date and UTC time is shown. This is flooding as modeled from input precipitation data and topography.
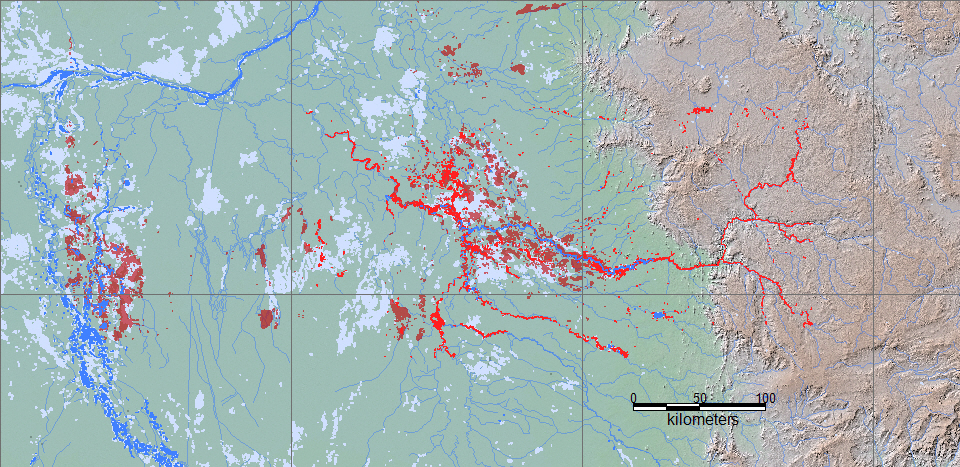
Red is all satellite-mapped flooding from this event. At present, all data from ESA/Copernicus Sentinel 2 image data, October 2-19, 2019, as mapped by produced by Cloud 2 Street. Darker Red is FloodScan-detected non-persistent water, October 1-16, 2019*. Blue is a reference normal water extent. Light gray is all previously mapped flooding, since 1999. Over the course of the event, remote sensing data are combined to show all flooded areas. A larger scale geotif version and flood and reference water GIS files are located here.
Last update of this map: September 22, 2019.
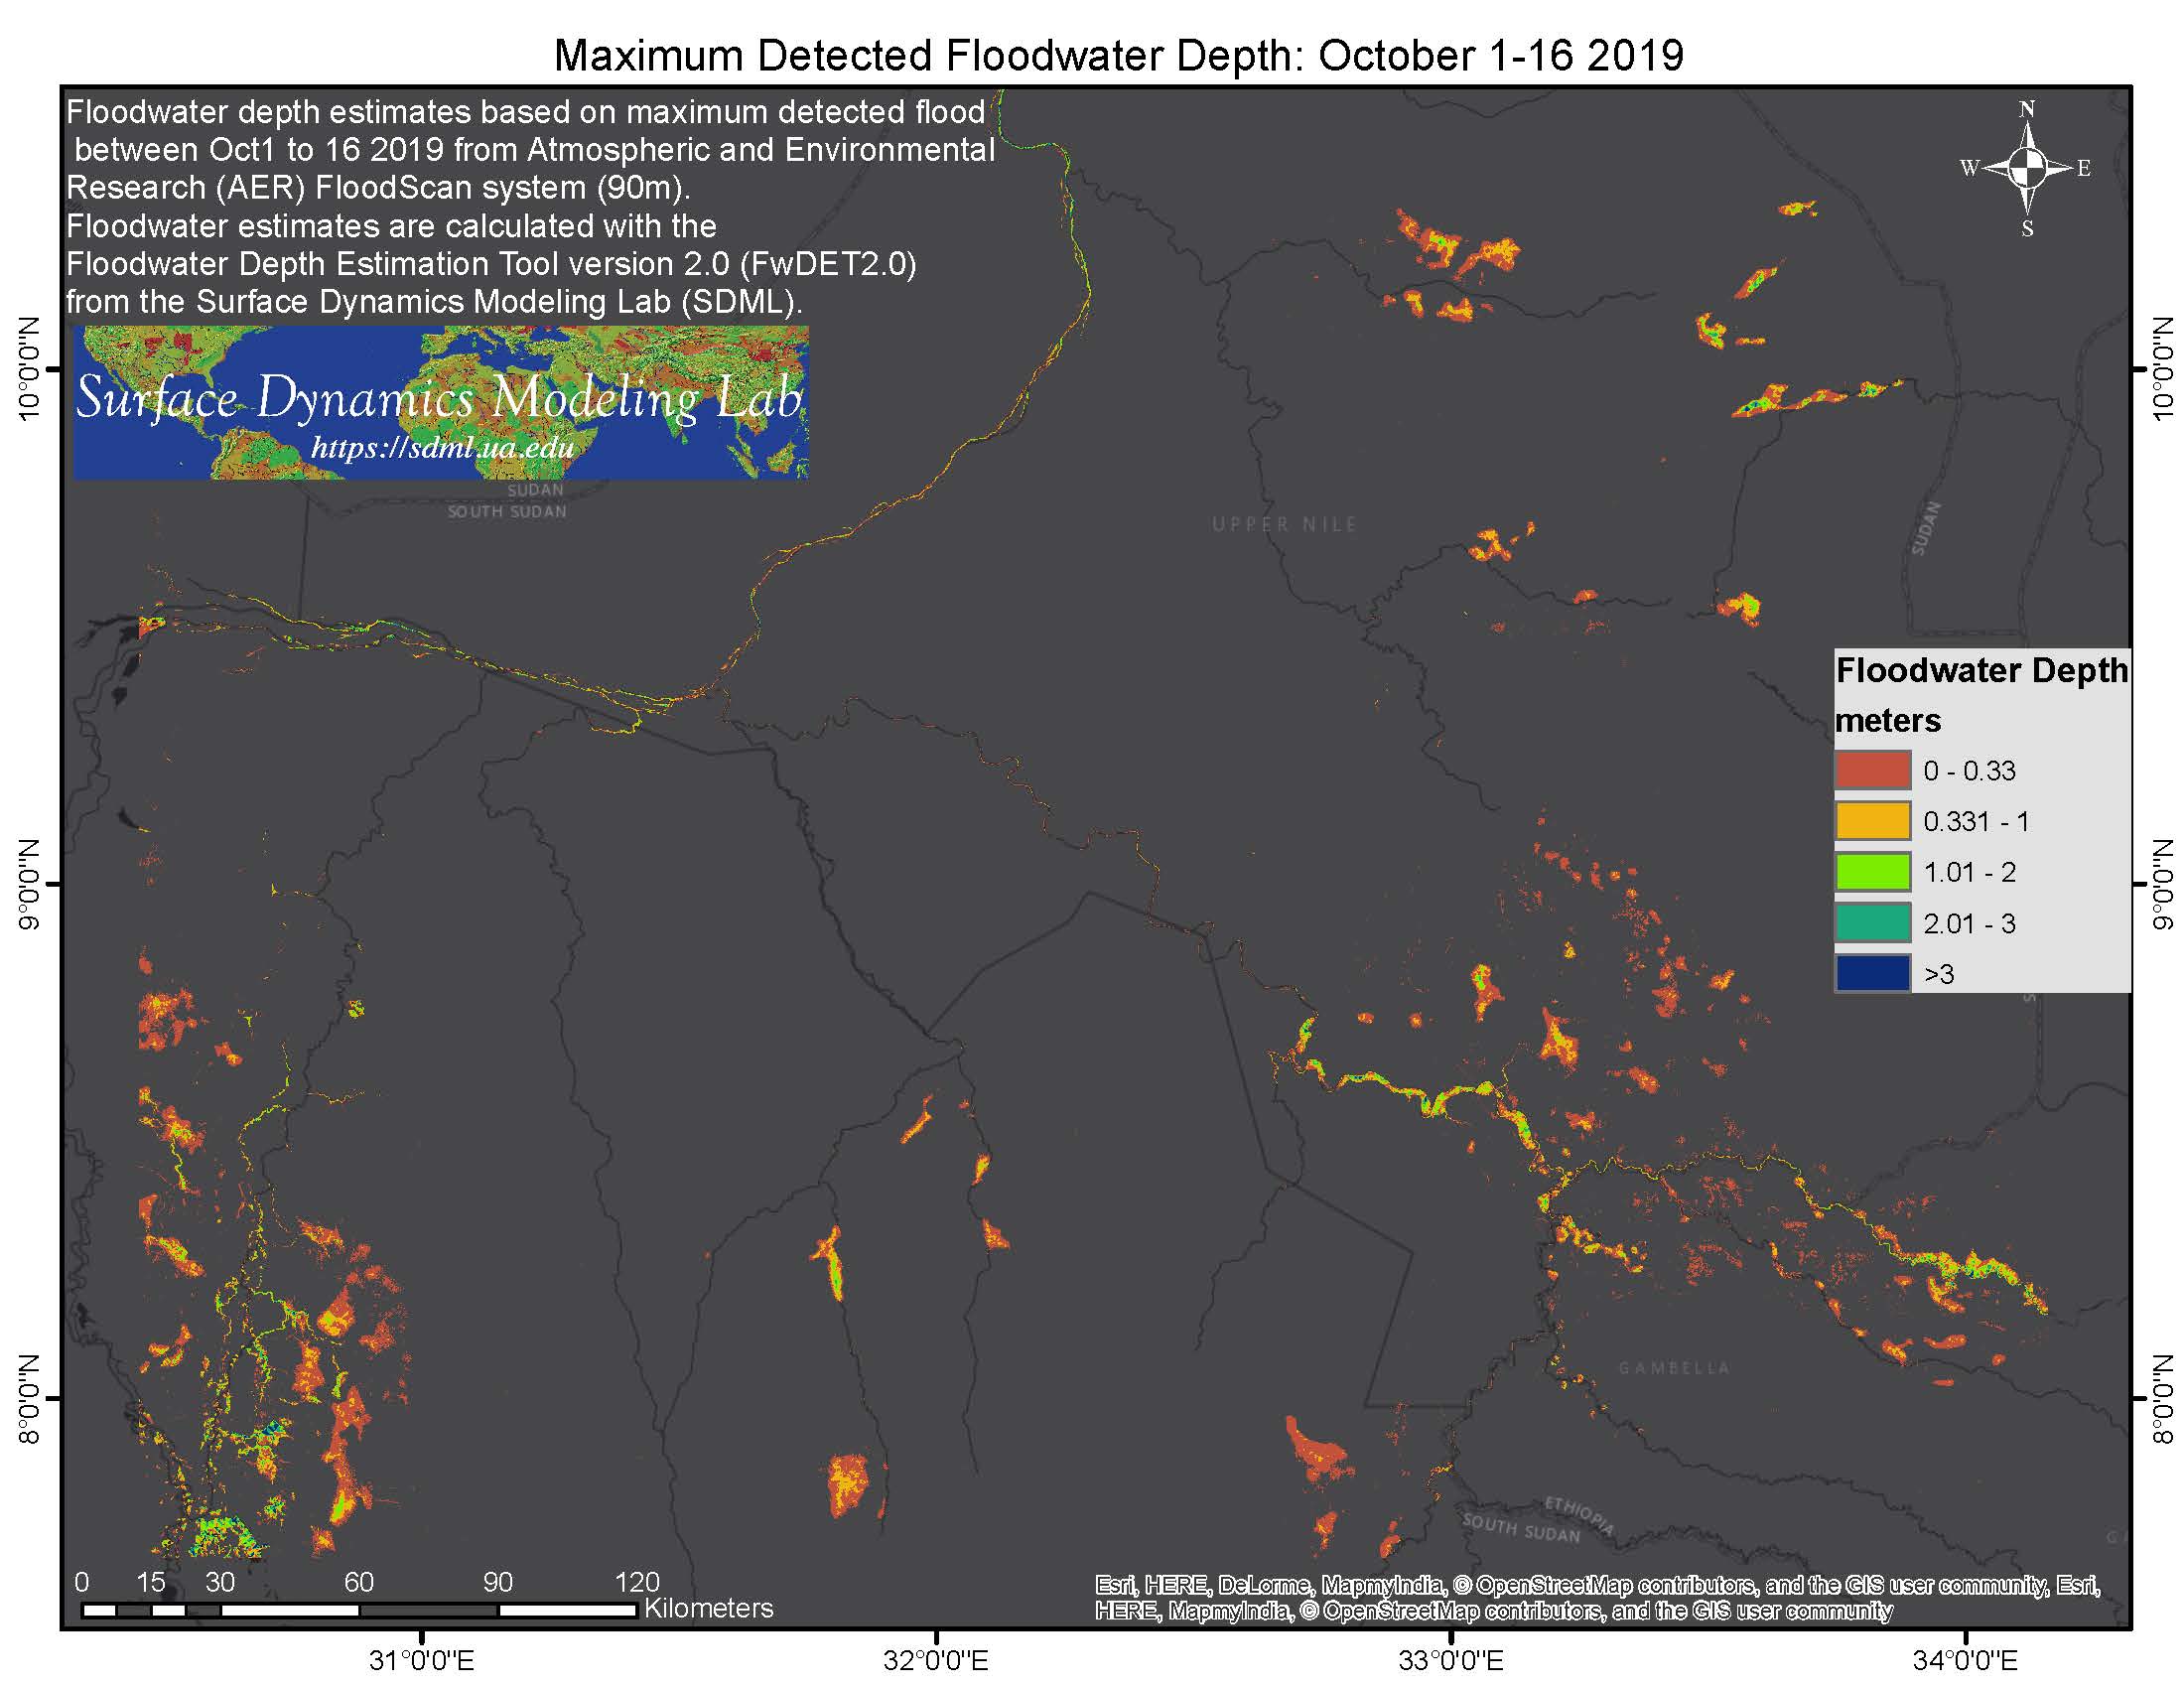
* This is is an experimental FloodScan product version (v05rMX) designed to map maximum flood extent as soon as possible. FloodScan derives flooded fraction from 22-km data (AMSR2 and GMI) and downscales it using a footprint-matched database built from topography and Global Surface Water Explorer data. FloodScan doesn't detect every bit of flooding; it maps flood extent inland where there is at least ~5% flooding within a ~22-km diameter area. Data provided for evaluation purposes only. Feedback on usefulness is greatly appreciated. Source: Atmospheric and Environmental Research (AER). Atmospheric and Environmental Research (AER). To cite: "Flood depictions: AER FloodScan v05rMX".
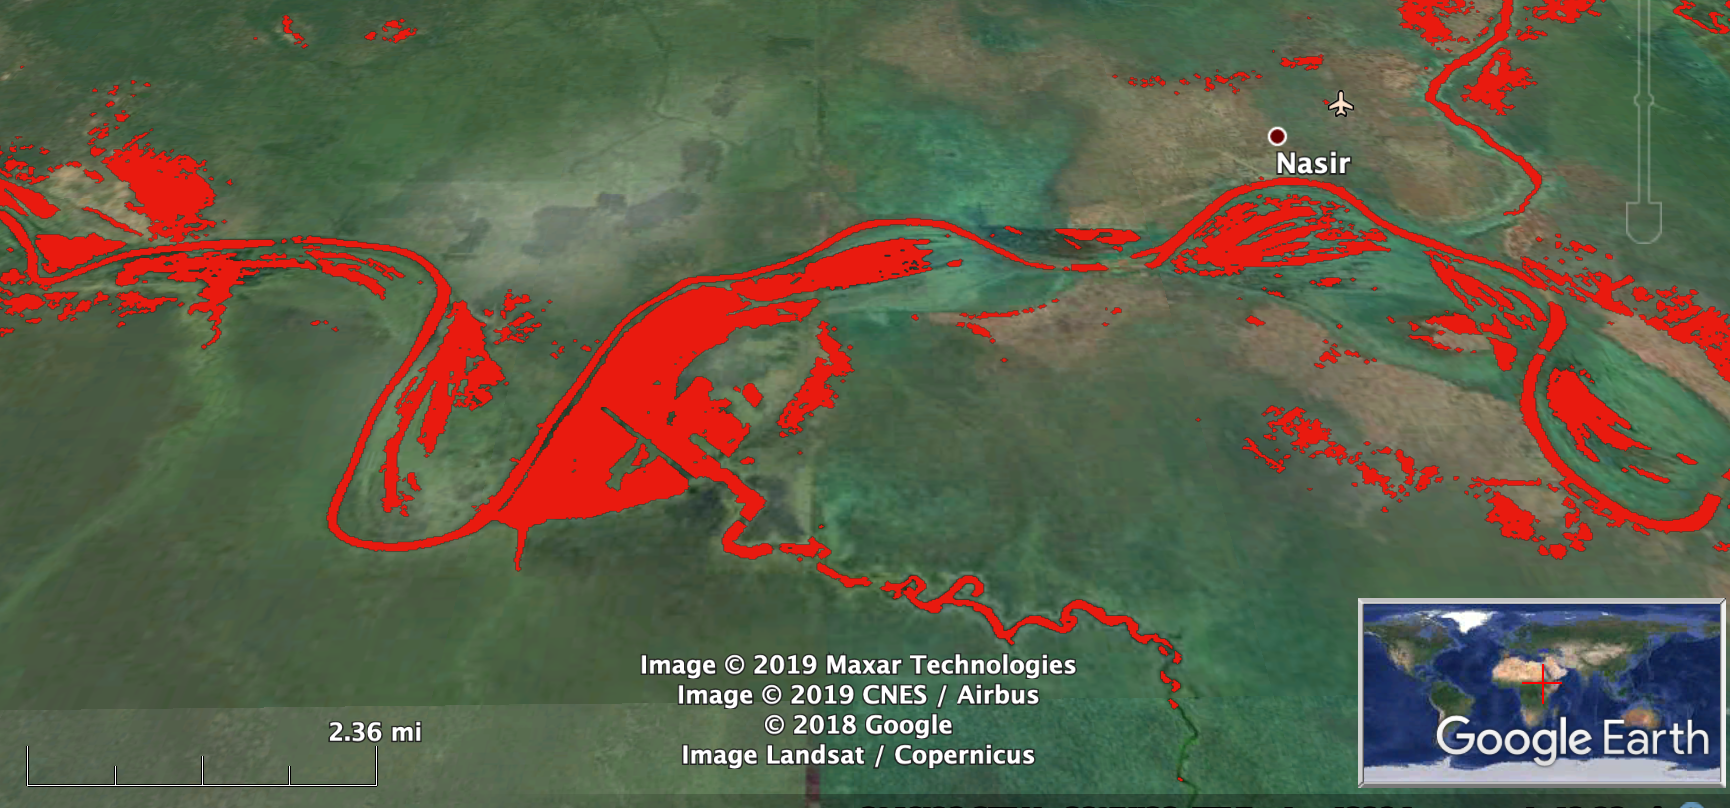
Below: Sample Google Earth view created from the Cloud 2 Street Sentinel 2 flood mapping by importing the associated .shp file (see data folder for this event).
The Flood Observatory maintains a Global Active Archive of large flood events, 1985 to present. New major flood events are entered into this archive each week. A hand-drawn GIS polygon for each event outlines the region affected.
This event was selected for Observatory production of map and GIS data products. After final updating, this web page and associated image and map (GIS) files become the permanent Flood Observatory record of this flood event.
As part of collaborations with other organizations, including
GEO and the Global Flood
Partnership, the Observatory's maps are made available here to the public.
Geotif versions and GIS files are also available. With attribution, maps and
data can be used freely for non-commercial purposes. With permission, they can
be used for commercial purposes. Consult the Creative Commons Attribution-NonCommercial-ShareAlike 4.0
International License and Robert.Brakenridge or Albert.Kettner (at
Colorado.edu) if questions. Attribution for the Maximum Observed Flooding map when Sentinel SAR data are
included: "Dartmouth Flood Observatory at the University of Colorado, from satellite
data provided by NASA and Copernicus/European Space Agency". When using GIS data
(see below) provided to DFO from other sources, please acknowledge original
source (e.g., AER for the FloodScan product, Cloud 2 Street, etc).
NASA Landsat 8 and Copernicus/ESA Sentinel SAR data if used in this map were obtained from the the U.S. Geological Survey Hazards Data Distribution System. and, for DFO-produced flood mapping, the Sentinels Science Data hub, respectively. Landsat 8 is jointly managed by NASA and the United States Geological Survey. Copernicus is supported by the European Commission. MODIS data are obtained from the NASA NRT Global Flood Mapping facility (surface water extents) and from NASA Worldview (image files); SUOMI/VIIRS image data are also retrieved from NASA Worldview.
Flood and reference water extent files (Shp and Mapinfo versions) supporting this Flood Event Map are located here.
These files may include high spatial resolution mapping such as from Sentinel or Landsat, or lower resolution files from MODIS. File names commonly include the sensor source (e.g., S1 for Sentinel 1, LS8 for Landsat, MODIS, Aqua, or Terra for MODIS, AER for the FloodScan product) and the image date, and also UTC time where availabl..
The NASA Earth Sciences Program, the Latin American Development Bank, the World Bank, the European Commission's Global Disaster Alert and Coordination System, GDACS, and Copernicus Emergency Management Service, the Google Earth Engine research awards program, the Committee on Earth Observation Satellites (CEOS) Disasters Working Group-Flood Pilot, the Japanese Space Agency, and the European Space Agency all have supported the Observatory's work via research grants and contracts or free satellite-derived data.
The Dartmouth Flood Observatory was founded in 1993 at Dartmouth College, Hanover, NH USA and moved to the University of Colorado, INSTAAR, CSDMS in 2010. Its operation depends on continued grant and project support. If your organization uses these data and maps, please consider becoming a Sustaining Partner and helping to sustain this effort. The institutional support of both universities is gratefully acknowledged.
">
(counting since October 18, 2019)