


![]()
"USA – Flooding in South East Texas After Tropical Depression Imelda Dumps Heavy Rain 19 SEPTEMBER, 2019 BY FLOODLIST NEWS IN NEWS, USA Torrential rain brought by Tropical Storm Imelda has triggered flooding in southeast Texas.
The National Hurricane Center said Imelda made landfall near Freeport, Texas, with maximum sustained winds of 40 mph (64 kph). It has since weakened to a tropical depression. National Weather Service (NWS) Houston reported rainfall rates of 2-3″ (50mm to 76mm) per hour. Some areas of Matagorda and Brazoria counties saw up to 16 inches (406.4mm) of rain in a period 17 to 18 September.
Areas from Galveston eastwards into Chambers county saw up to 12 inches (304.8mm). Jeff Lindner director of the Harris County Flood Control District (HCFCD) flood operations said some areas have seen 25 inches (635mm) of rain. HCFCD were monitoring bayous and creeks in the area.
As of 19 September Texas Department of Transportation reported flooded roads in 17 locations, including in Lake Jackson, Beaumont, Cleveland, Corrigan, Freeport, Houston and Galveston. Schools have been closed in the Houston and Galveston areas. Some public transportation services in Galveston were suspended due to the weather. A tornado was reported near the Baytown, damaging several homes. There were no immediate reports of injuries or major damage resulting from the flooding. Forecasters however said the Houston area could still face some heavy rainfall on 19 September. NWS said flash flood watches remained in effect through Thursday for southeast Texas and southwestern Louisiana. A Flash Flood Emergency continues for Beaumont, Nederland and Port Neches." Quoted from Flood List.
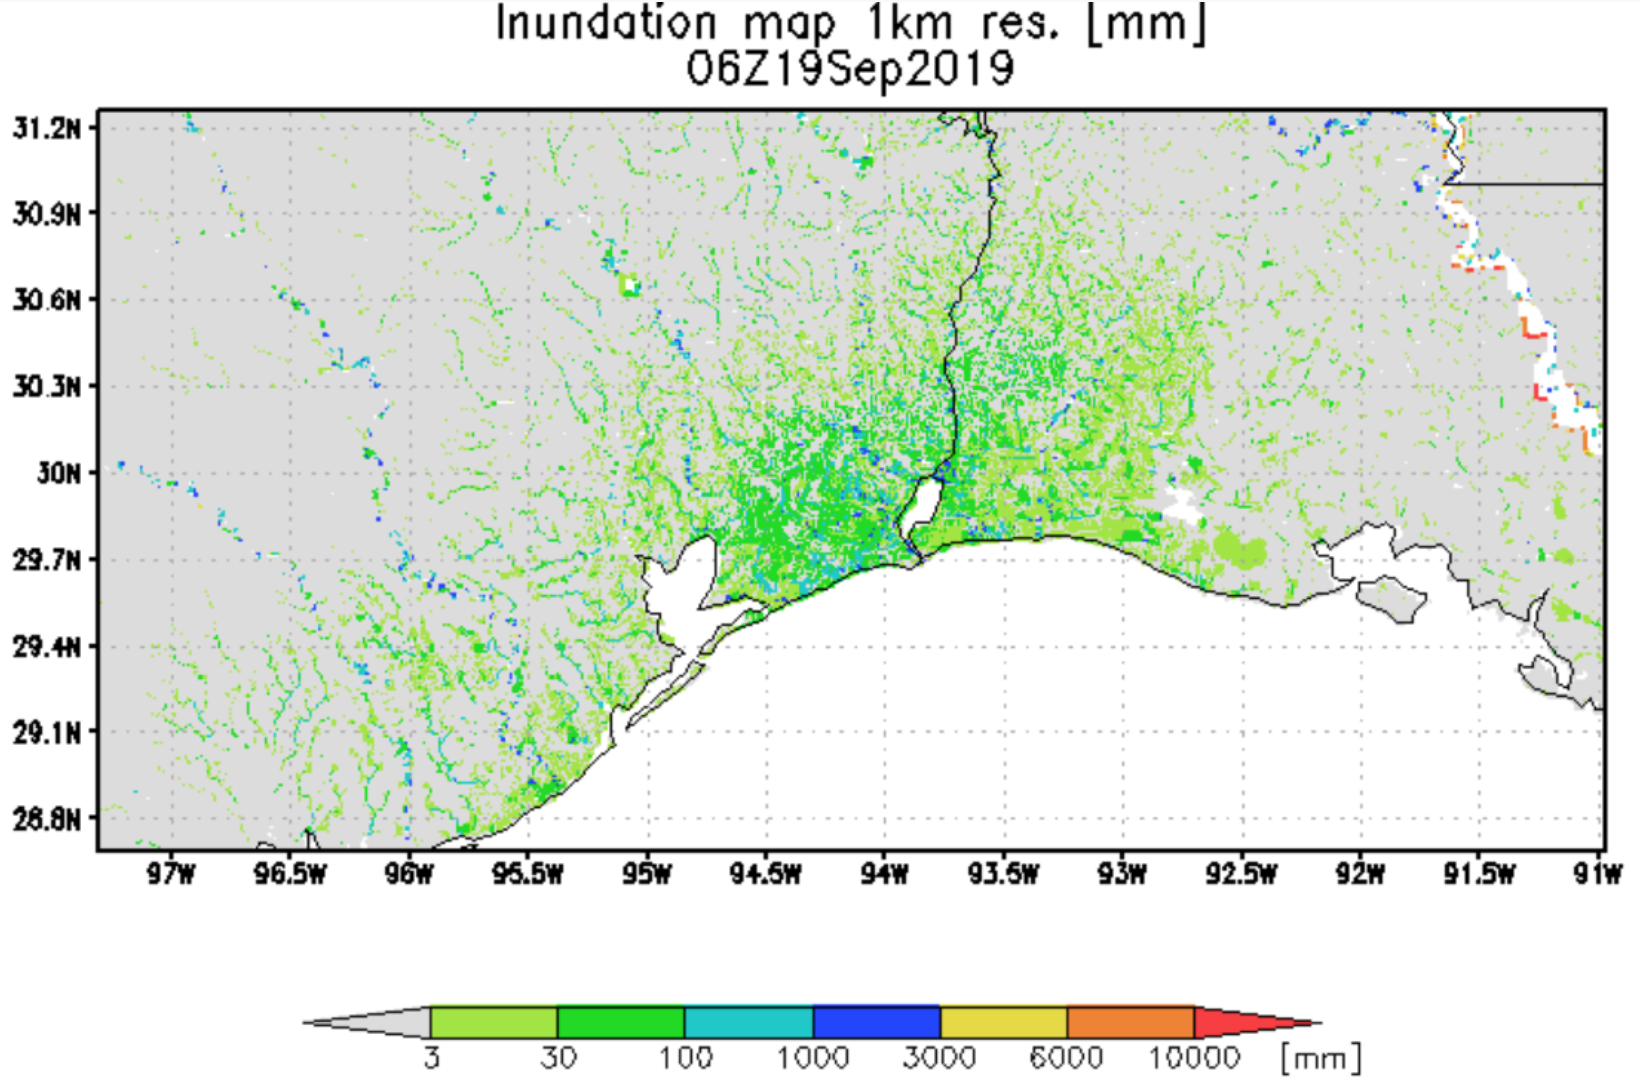
Results from the NASA-supported Global Flood Monitoring System (GFMS) at ESSIC, University of Maryland. Date and UTC time is shown. This is flooding as modeled from input precipitation data and topography.
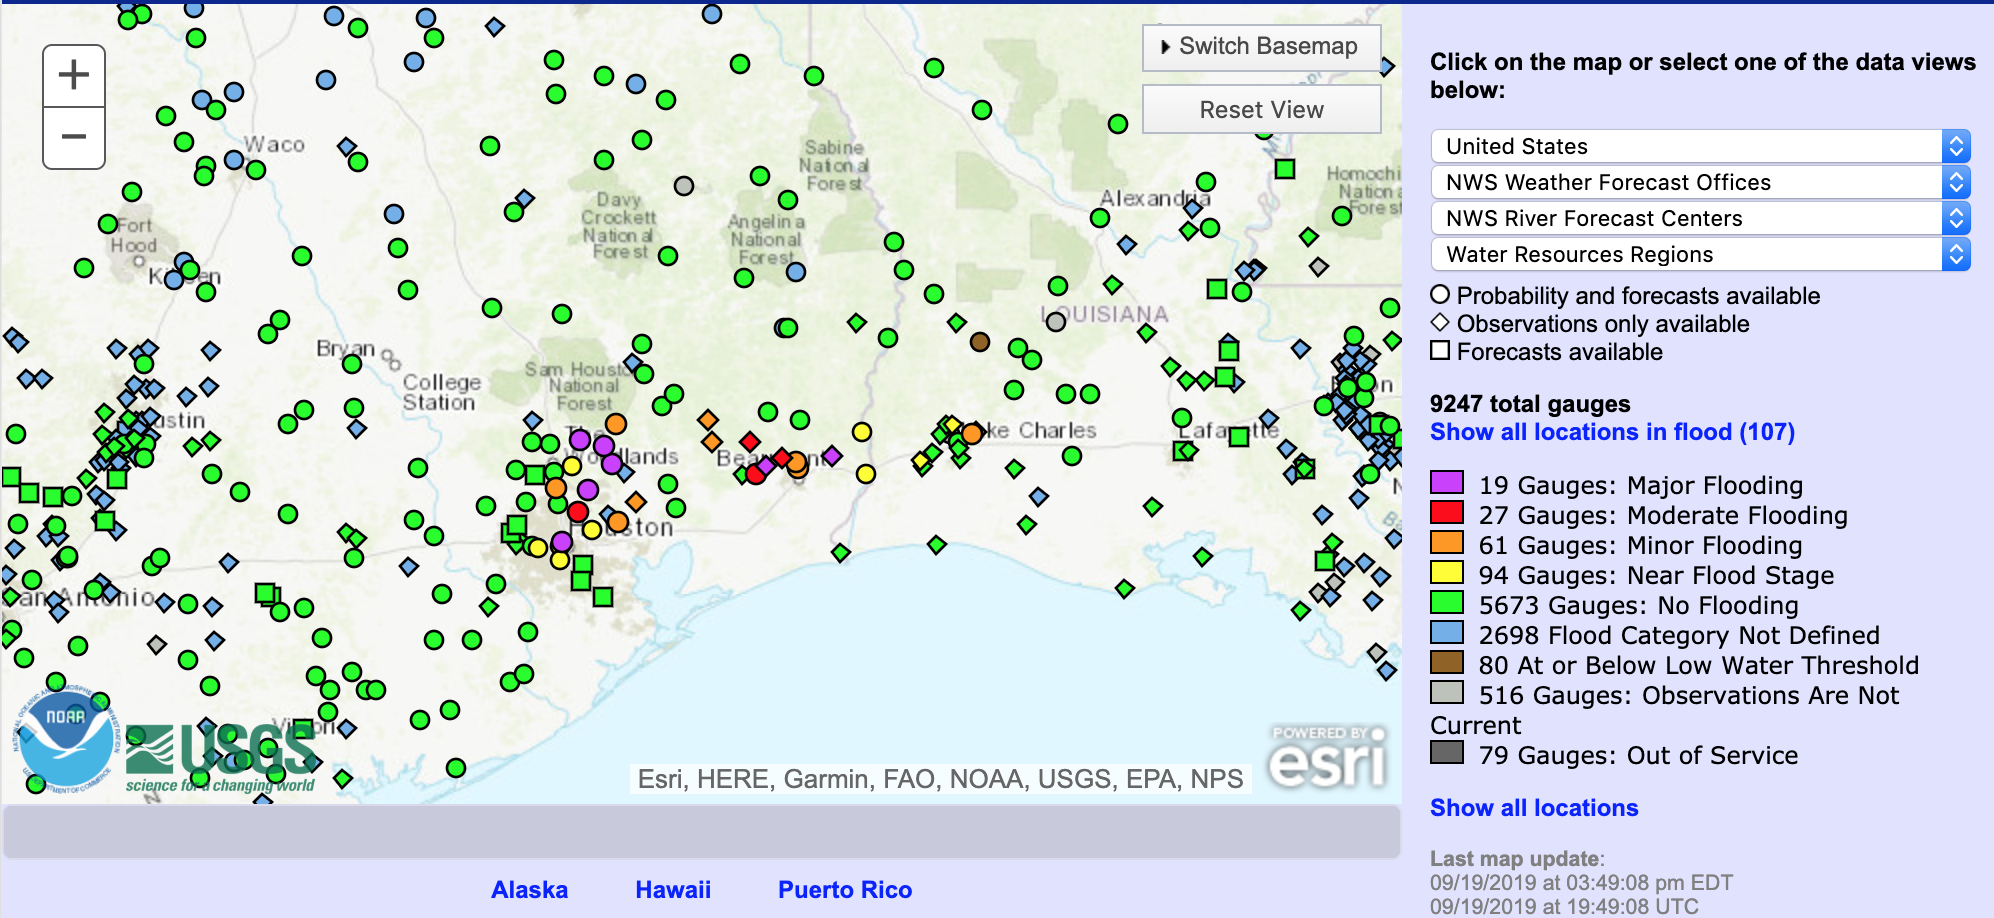
Results from NOAA/National Weather Service AHPS system. This is flooding as measured by reporting ground gauging stations. Date and time shown in lower right.
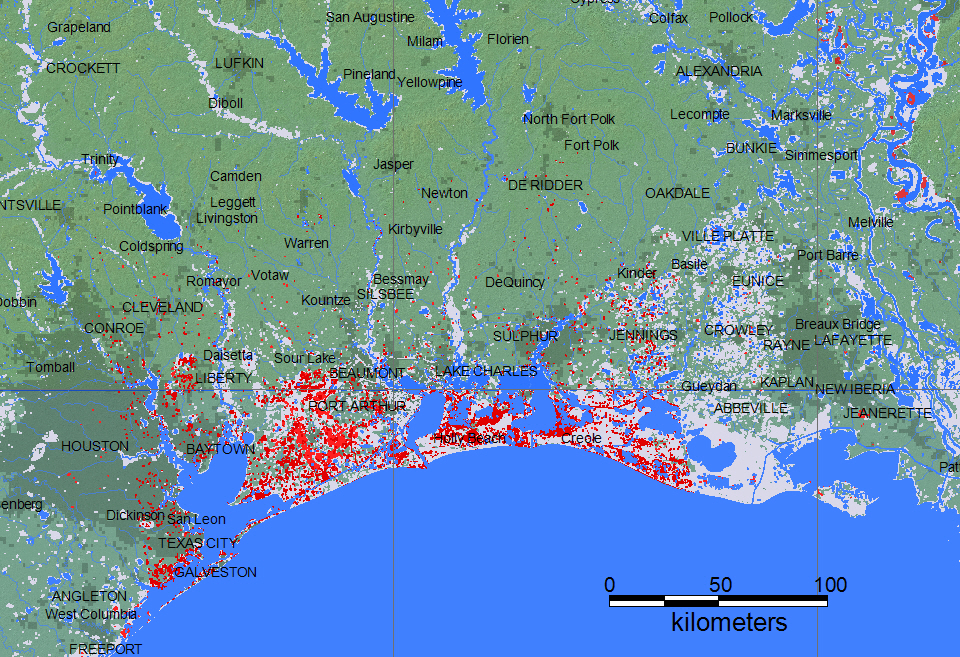
Red is all mapped flooding from this event. Darker Red is mapped flooding from non-DFO sources. Blue is a reference normal water extent. Light gray is all previously mapped flooding, since 1999. See also the DFO Web Map Server. Over the course of the event, remote sensing data are combined to show all flooded areas. A larger scale geotif version and flood and reference water GIS files are located here. Click on colored dots for access to River Watch results.
Last update of this map: September 22, 2019.
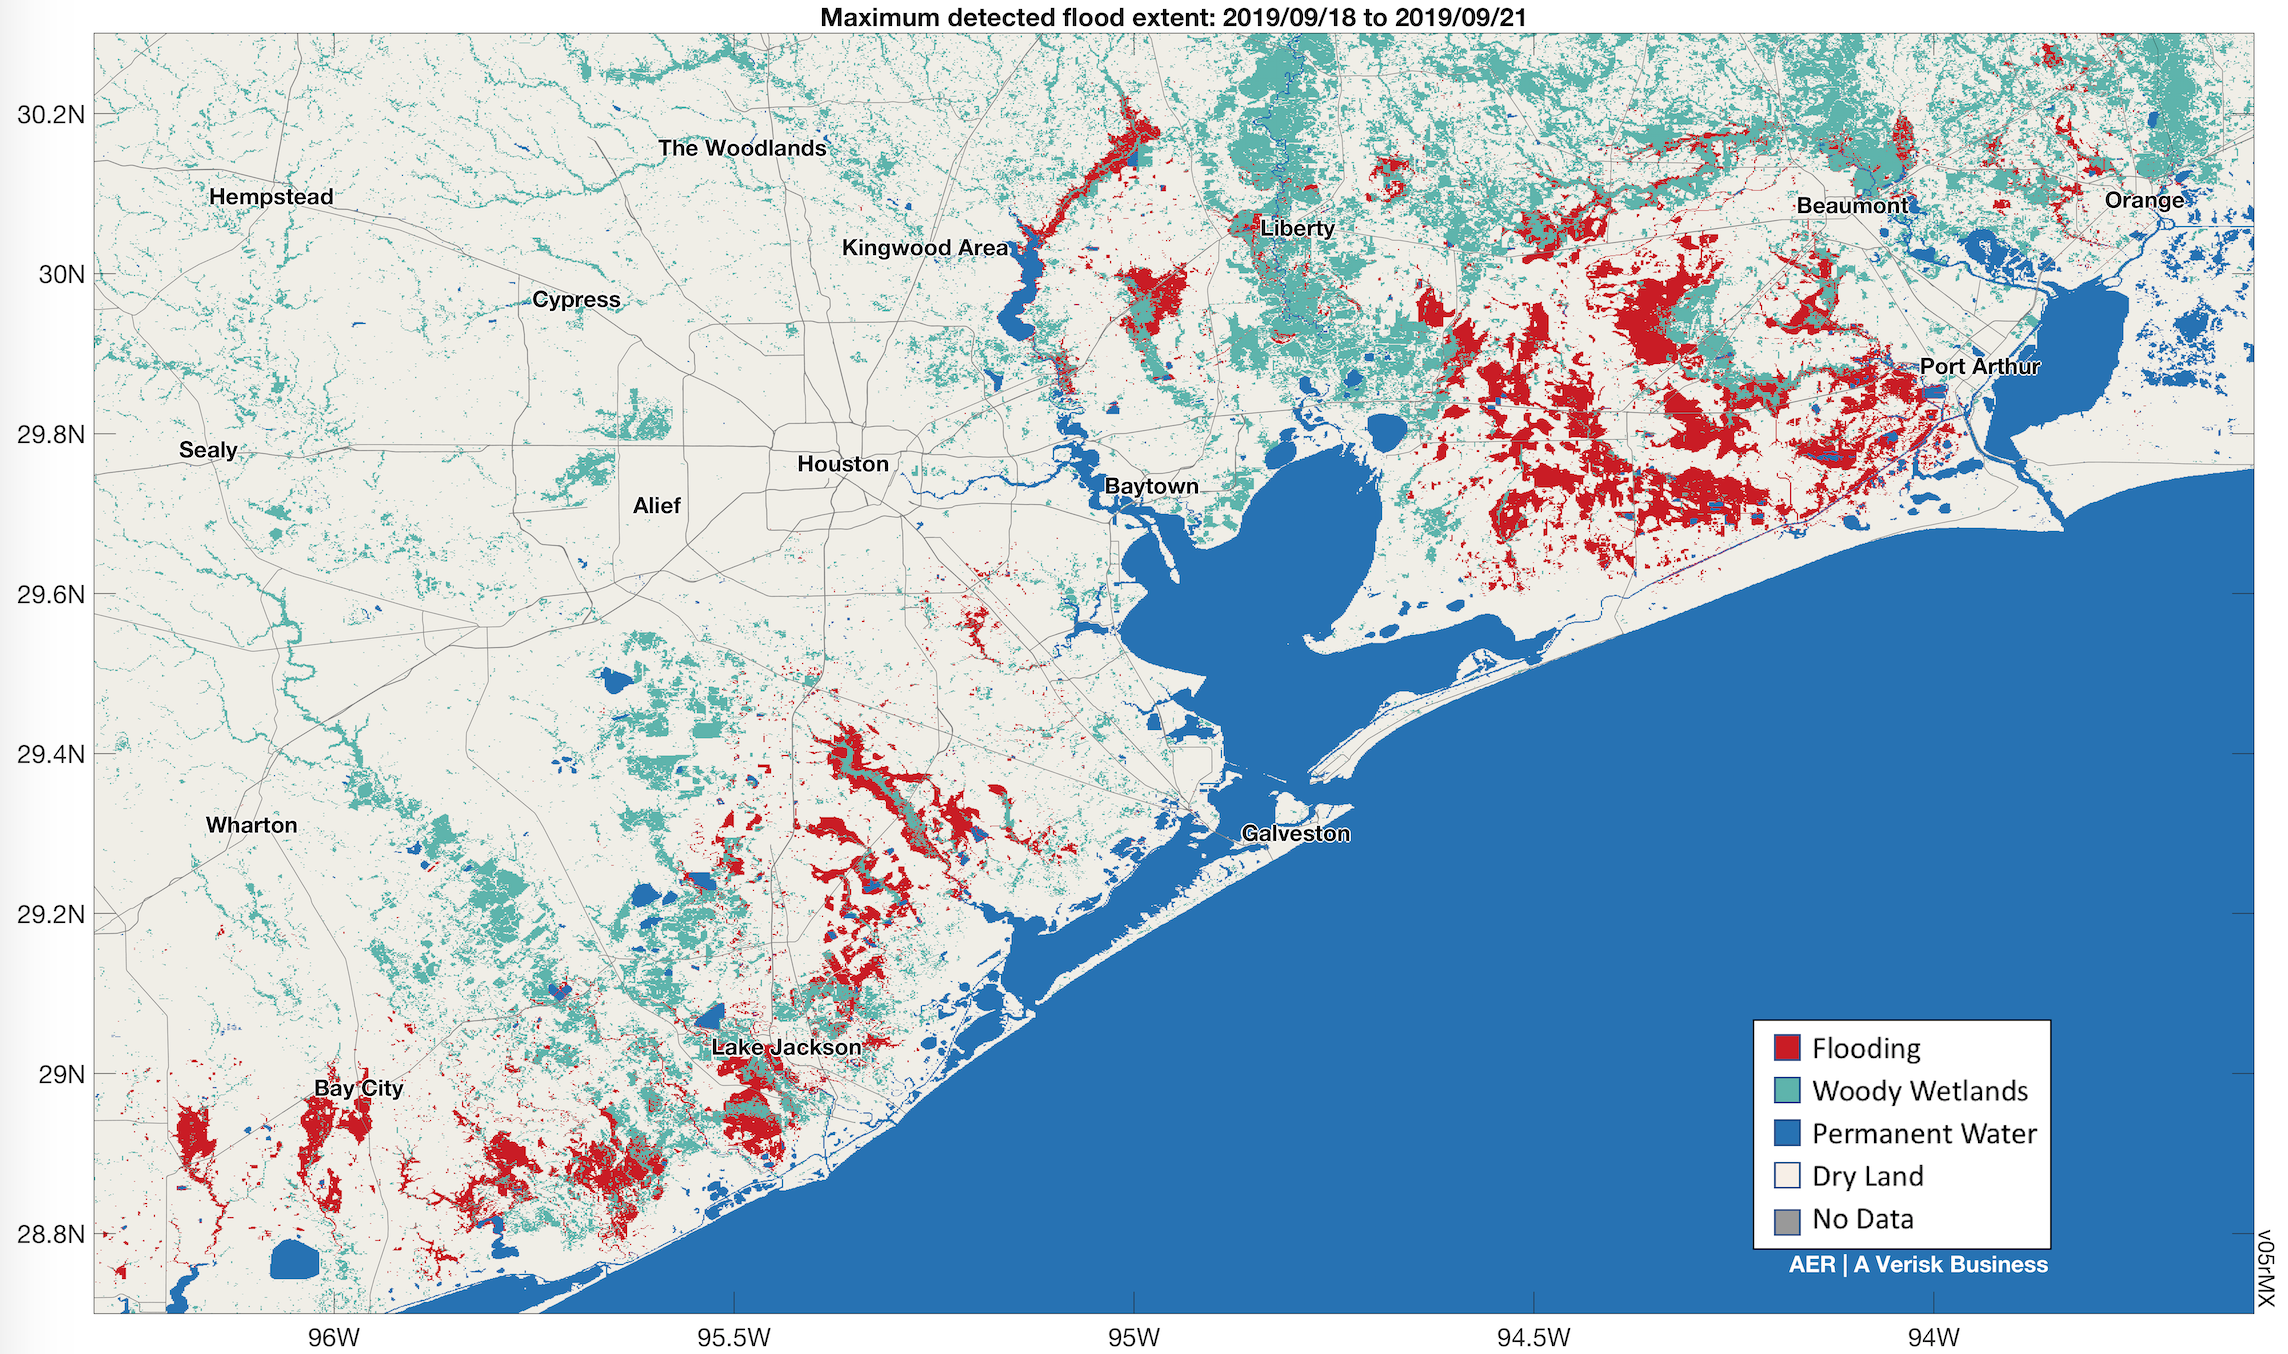
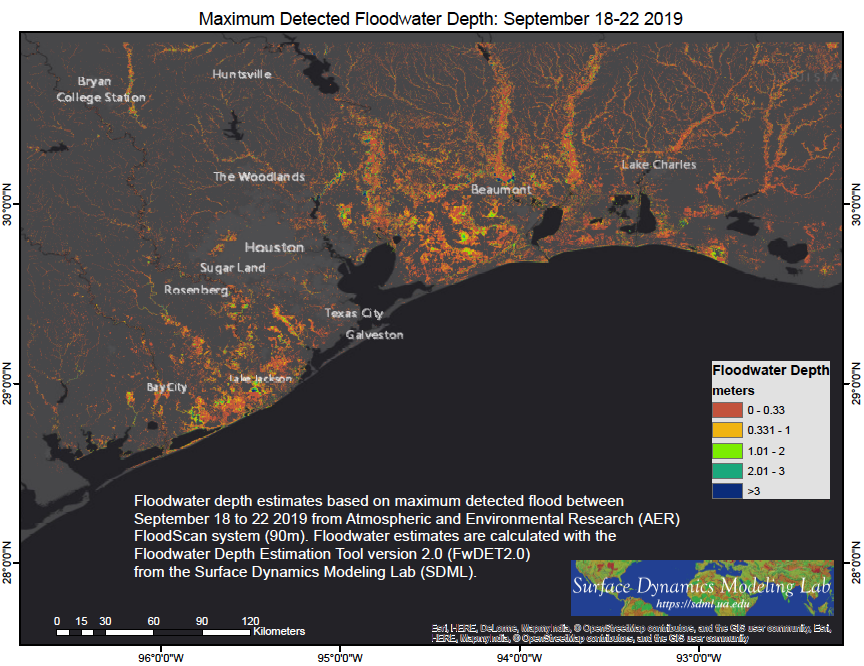
This is an experimental FloodScan product version (v05rMX) designed to map maximum flood extent as soon as possible. FloodScan derives flooded fraction from 22-km data (AMSR2 and GMI) and downscales it using a footprint-matched database built from topography and Global Surface Water Explorer data. FloodScan doesn't detect every bit of flooding; it maps flood extent inland where there is at least ~5% flooding within a ~22-km diameter area. A woody wetlands class is included to indicate areas that may also be flooded. FloodScan does not map flooding in wooded wetlands because microwave radiation does not fully penetrate the vegetation layer. Data provided for evaluation purposes only. Feedback on usefulness is greatly appreciated. Source: Atmospheric and Environmental Research (AER). Atmospheric and Environmental Research (AER). To cite: "Flood depictions: AER FloodScan v05rMX".
The Flood Observatory maintains a Global Active Archive of large flood events, 1985 to present. New major flood events are entered into this archive each week. A hand-drawn GIS polygon for each event outlines the region affected.
This event was selected for Observatory production of map and GIS data products. After final updating, this web page and associated image and map (GIS) files become the permanent Flood Observatory record of this flood event.
As part of collaborations with other organizations, including GEO and the Global Flood Partnership, the Observatory's maps are made available here to the public. Geotif versions and GIS files are also available. With attribution, maps and data can be used freely for non-commercial purposes. With permission, they can be used for commercial purposes. Consult the Creative Commons Attribution-NonCommercial-ShareAlike 4.0 International License and Robert.Brakenridge or Albert.Kettner (at Colorado.edu) if questions. Attribution for the Maximum Observed Flooding map when Sentinel SAR data are included: "Dartmouth Flood Observatory at the University of Colorado, from satellite data provided by NASA and Copernicus/European Space Agency". When using GIS data (see below) provided to DFO from other sources, please acknowledge original source.
The displays and supporting GIS files for this event include: 1) ESA/Copernicus Sentinel 1 SAR-based flood mapping results obtained by Dr. Patrick Matgen, at the Luxembourg Institute of Science and Technology (LIST). The associated GIS files include "LIST" in their file names. 2) Q. Yang and X. Shen and the RAPID system at the University of Connecticut (as described in: X. Shen, E. N. Anagnostou, G. H. Allen, G. R. Brakenridge and A. J. Kettner, 2019, "Near-Real Time Non-obstructed Inundation Mapping by Synthetic Aperture Radar", Remote Sensing of Environment, vol. 221, 302-315. The associated GIS files include "UCONN" in their file names.
NASA Landsat 8 and Copernicus/ESA Sentinel SAR data if used in this map were obtained from the the U.S. Geological Survey Hazards Data Distribution System. and, for DFO-produced flood mapping, the Sentinels Science Data hub, respectively. Landsat 8 is jointly managed by NASA and the United States Geological Survey. Copernicus is supported by the European Commission. MODIS data are obtained from the NASA NRT Global Flood Mapping facility (surface water extents) and from NASA Worldview (image files); SUOMI/VIIRS image data are also retrieved from NASA Worldview.
Flood and reference water extent files (Shp and Mapinfo versions) supporting this Flood Event Map are located here.
These files may include high spatial resolution mapping such as from Sentinel or Landsat, or lower resolution files from MODIS. File names commonly include the sensor source (e.g., S1 for Sentinel 1, LS8 for Landsat, MODIS, Aqua, or Terra for MODIS) and the image date, and also UTC time where available..
The NASA Earth Sciences Program, the Latin American Development Bank, the World Bank, the European Commission's Global Disaster Alert and Coordination System, GDACS, and Copernicus Emergency Management Service, the Google Earth Engine research awards program, the Committee on Earth Observation Satellites (CEOS) Disasters Working Group-Flood Pilot, the Japanese Space Agency, and the European Space Agency all have supported the Observatory's work via research grants and contracts or free satellite-derived data.
The Dartmouth Flood Observatory was founded in 1993 at Dartmouth College, Hanover, NH USA and moved to the University of Colorado, INSTAAR, CSDMS in 2010. Its operation depends on continued grant and project support. If your organization uses these data and maps, please consider becoming a Sustaining Partner and helping to sustain this effort. The institutional support of both universities is gratefully acknowledged.
(counting since September 19, 2019)