


![]()
"Cambodia – 7 Dead as Floods Worsen 11 SEPTEMBER, 2019 BY FLOODLIST NEWS IN ASIA, NEWS The flood situation in Cambodia has worsened since rivers levels began to rise in early September. Flooding has now affected 11 provinces and displaced thousands. Further heavy rain is expected over the coming days.
Quoting the country's National Committee for Disaster Management (NCDM), the Phnom Penh Post said that 7 people have died in the recent floods, which have displaced 6,893 families and inundated thousands of homes. Flooding has also caused severe damage to crops and livestock.
Steung Treng, Kratie, Kampong Cham, Preah Vihear and Tbong Khmum are thought to be among the worst affected areas. Cambodia's Transport Ministry said that floods have damaged roads in 11 provinces; Mondulkiri, Ratanakiri, Kratie, Steung Treng, Preah Vihear, Kampong Chhnang, Tboung Khmum, Kampong Speu, Kampot, Kep and Koh Kong.
The Mekong is at or above alarm level at Kampong Cham, Kratié, Steung Treng and Koh Kehl in Kandal Province, about 35 km (20 miles) south of the capital Phnom Penh. National Flood Forecasting Center(NFFC) also reported flooding in areas around Tonlé Sap lake." Quoted from Flood List.
Results from the NASA-supported Global Flood Monitoring System (GFMS) at ESSIC, University of Maryland. Date and UTC time is shown. This is flooding as modeled from input precipitation data and topography.
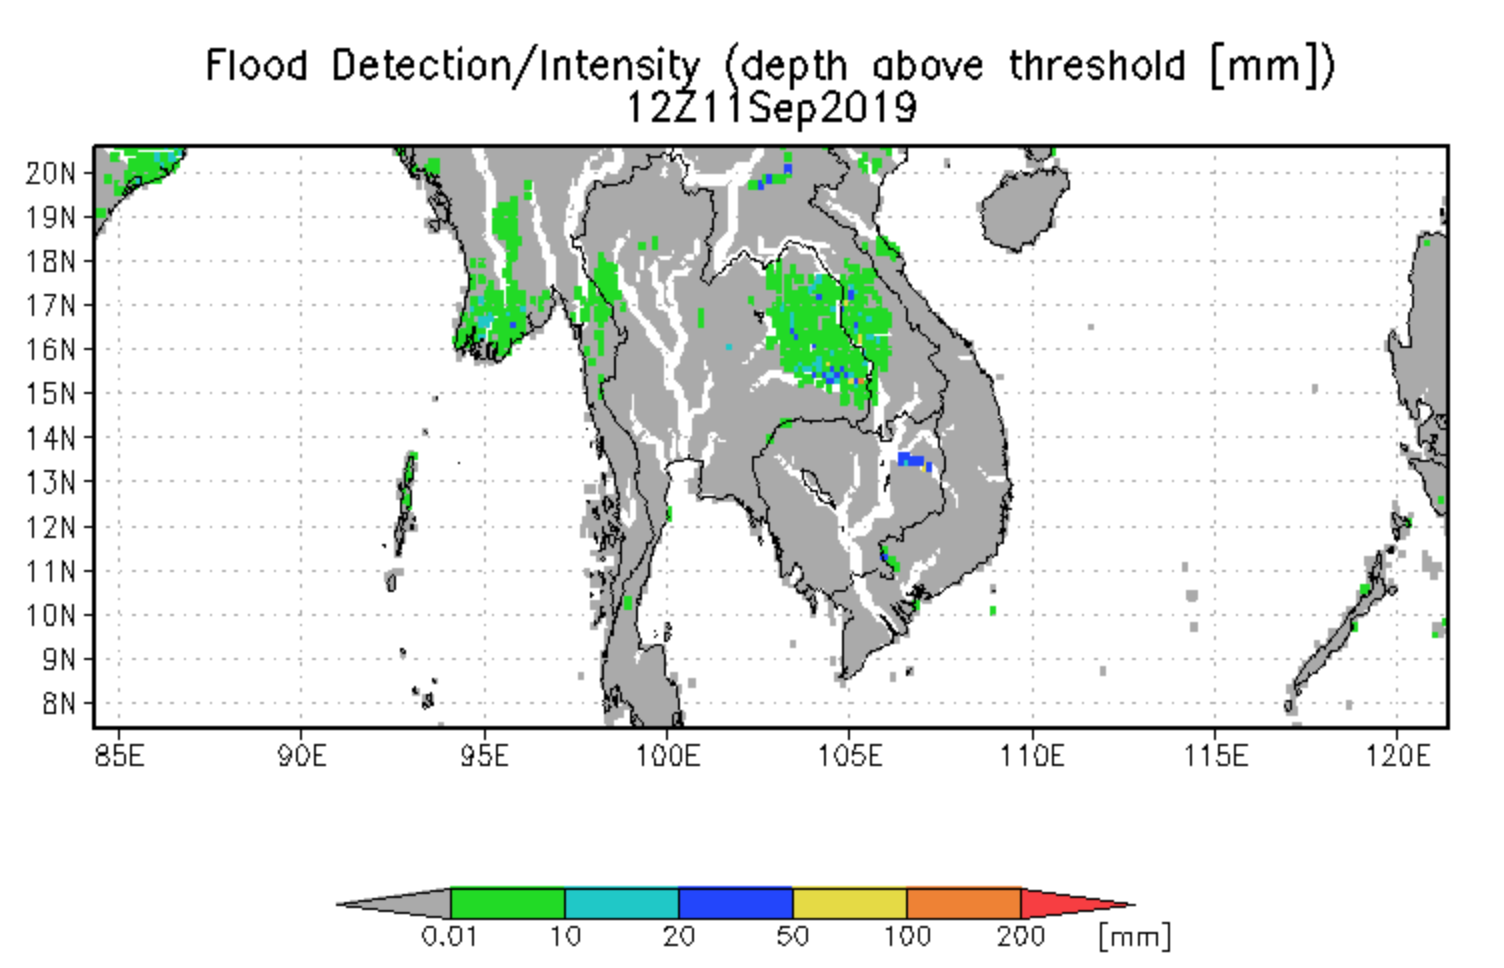
Red is all mapped flooding from this event. Darker Red is mapped flooding from non-DFO sources. Blue is a reference normal water extent. Light gray is all previously mapped flooding, since 1999. See also the DFO Web Map Server. Over the course of the event, remote sensing data are combined to show all flooded areas. A larger scale geotif version and flood and reference water GIS files are located here. Click on colored dots for access to River Watch results.
Last update of this map: September 14, 2019.
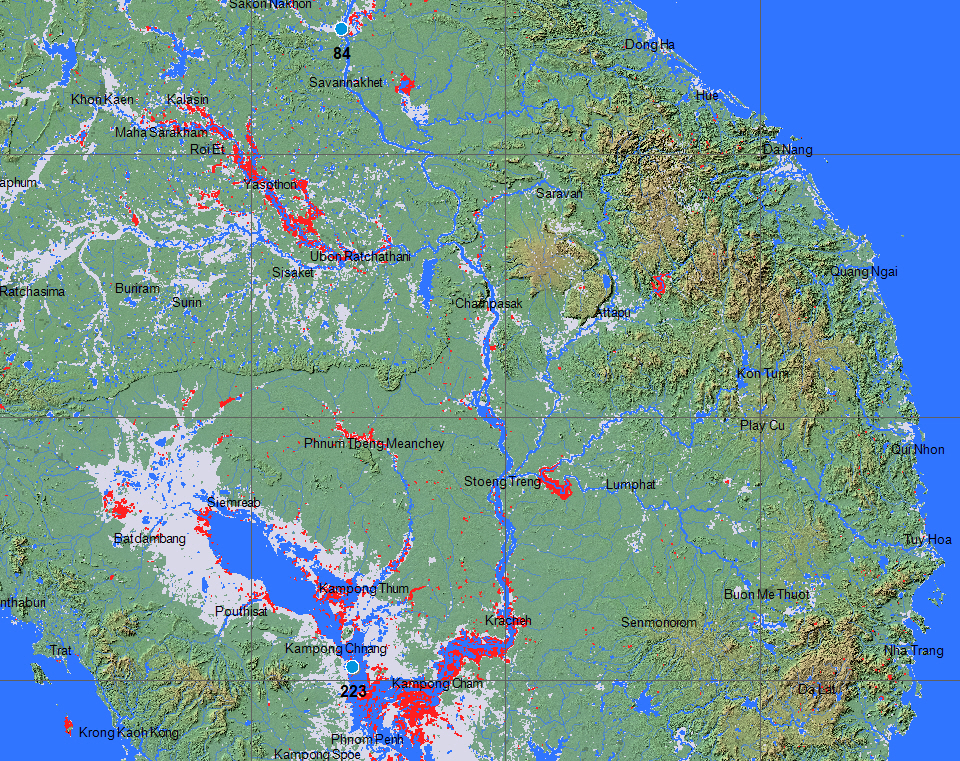
The Flood Observatory maintains a Global Active Archive of large flood events, 1985 to present. New major flood events are entered into this archive each week. A hand-drawn GIS polygon for each event outlines the region affected.
This event was selected for Observatory production of map and GIS data products. After final updating, this web page and associated image and map (GIS) files become the permanent Flood Observatory record of this flood event. Reason for selection: request from the World Food Programme. Update status: In progress.
As part of collaborations with other organizations, including
GEO and the Global Flood
Partnership, the Observatory's maps are made available here to the public.
Geotif versions and GIS files are also available. With attribution, maps and
data can be used freely for non-commercial purposes. With permission, they can
be used for commercial purposes. Consult the Creative Commons Attribution-NonCommercial-ShareAlike 4.0
International License and Robert.Brakenridge or Albert.Kettner (at
Colorado.edu) if questions. Attribution for this map when Sentinel SAR data are
included: "Dartmouth Flood Observatory at the University of Colorado, from satellite
data provided by NASA and Copernicus/European Space Agency". When using GIS data
(see below) provided to DFO from other sources, please acknowledge original
source.
NASA Landsat 8 and Copernicus/ESA Sentinel SAR data if used in this map were obtained from the the U.S. Geological Survey Hazards Data Distribution System. and the Sentinels Science Data hub, respectively. Landsat 8 is jointly managed by NASA and the United States Geological Survey. Copernicus is supported by the European Commission. MODIS data are obtained from the NASA NRT Global Flood Mapping facility (surface water extents) and from NASA Worldview (image files); SUOMI/VIIRS image data are also retrieved from NASA Worldview.
Flood and reference water extent files (Shp and Mapinfo versions) supporting this Flood Event Map are located here.
These files may include high spatial resolution mapping such as from Sentinel or Landsat, or lower resolution files from MODIS. File names commonly include the sensor source (e.g., S1 for Sentinel 1, LS8 for Landsat, MODIS, Aqua, or Terra for MODIS) and the image date.
The NASA Earth Sciences Program, the Latin American Development Bank, the World Bank, the European Commission's Global Disaster Alert and Coordination System, GDACS, and Copernicus Emergency Management Service, the Google Earth Engine research awards program, the Committee on Earth Observation Satellites (CEOS) Disasters Working Group-Flood Pilot, the Japanese Space Agency, and the European Space Agency all have supported the Observatory's work via research grants and contracts or free satellite-derived data.
The Dartmouth Flood Observatory was founded in 1993 at Dartmouth College, Hanover, NH USA and moved to the University of Colorado, INSTAAR, CSDMS in 2010. Its operation depends on continued grant and project support. If your organization uses these data and maps, please consider becoming a Sustaining Partner and helping to sustain this effort. The institutional support of both universities is gratefully acknowledged.
(counting since September 15, 2019)