


(Note: Display may not refresh to latest version in Chrome. Test using another browser.)
The Flood Observatory maintains a Global Active Archive of large flood events, 1985 to present. New major flood events are entered into this archive each week. A single GIS polygon for each event estimates the total area affected.
In some cases, severe or damaging floods become the focus of Observatory flood extent mapping. As part of collaborations with other organizations, and the Global Flood Partnership, the Observatory's maps and other data are made available to the public. With attribution, they can be used and shared freely for non-commercial purposes. By permission, which is freely granted, they can be used for commercial purposes. Consult the Creative Commons license shown below. Geotif versions and GIS files are also provided for these maps.
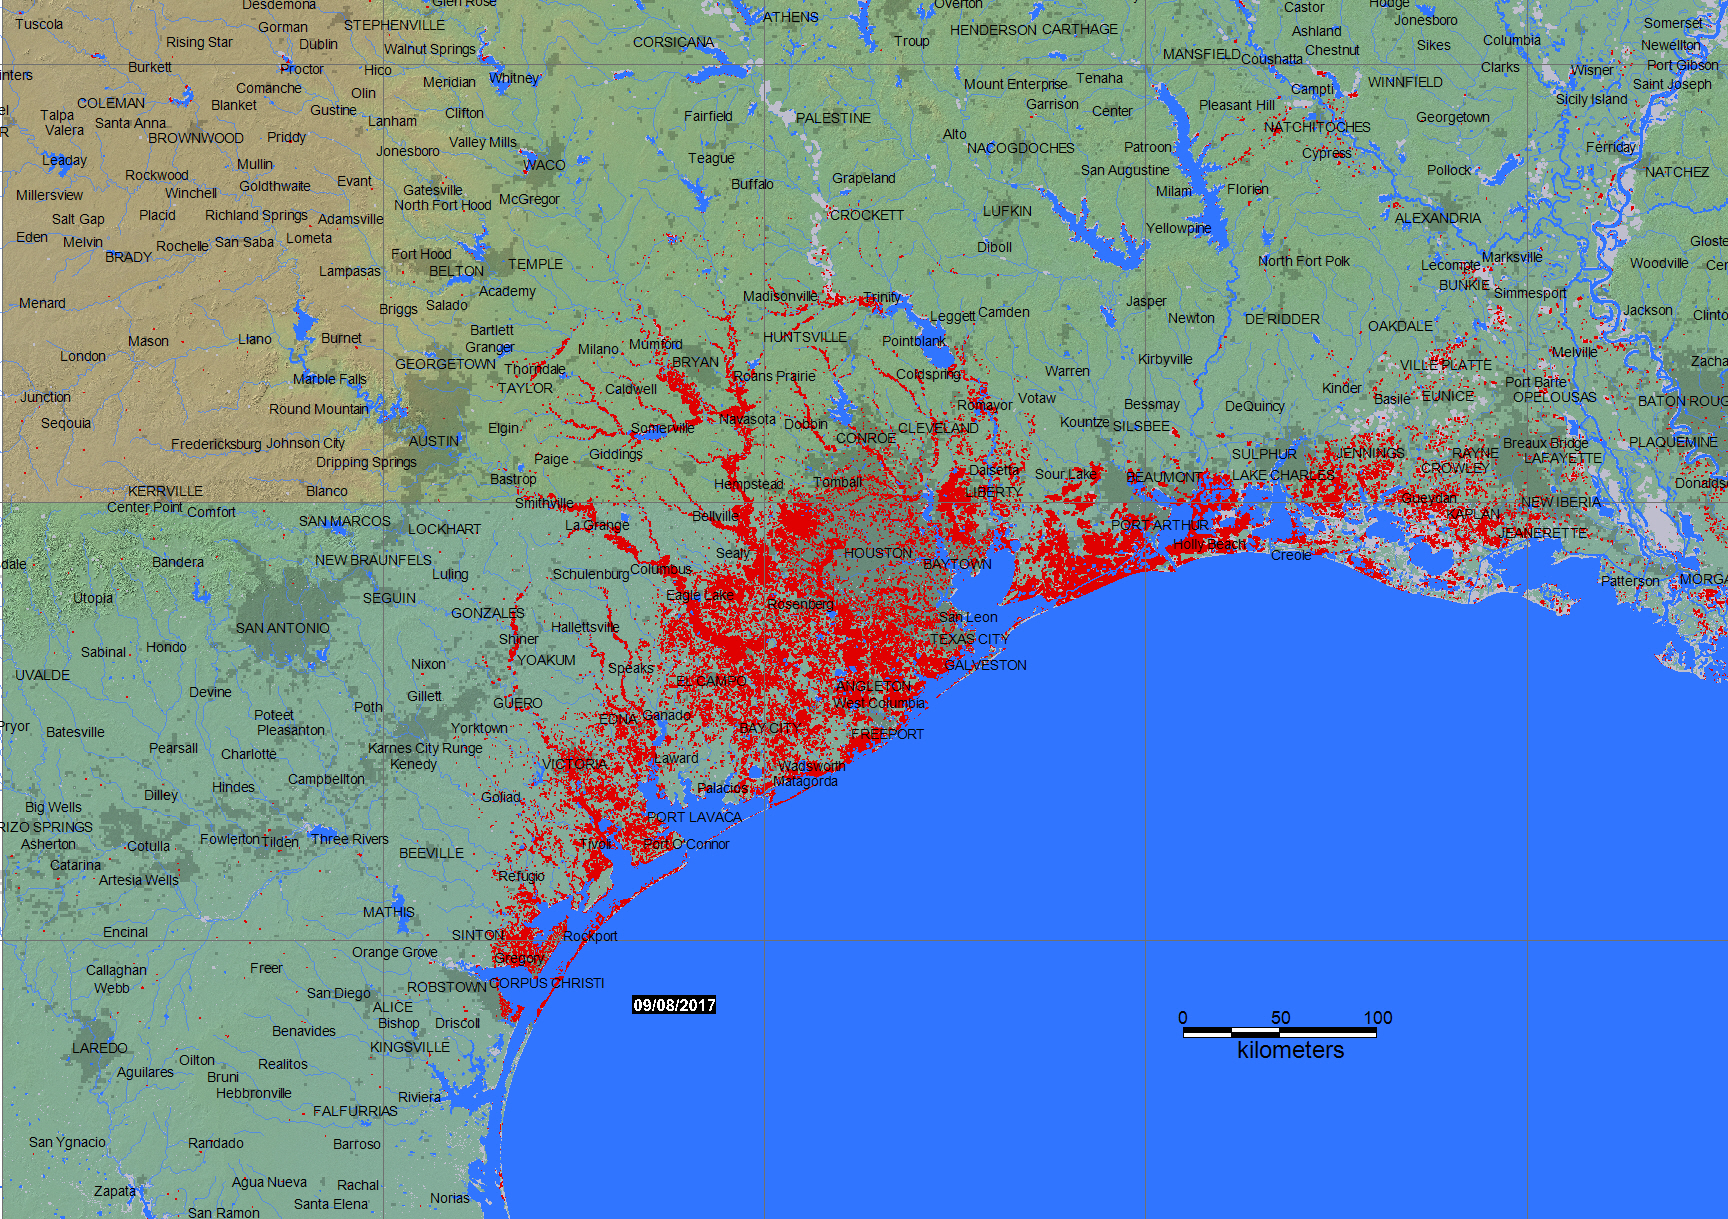
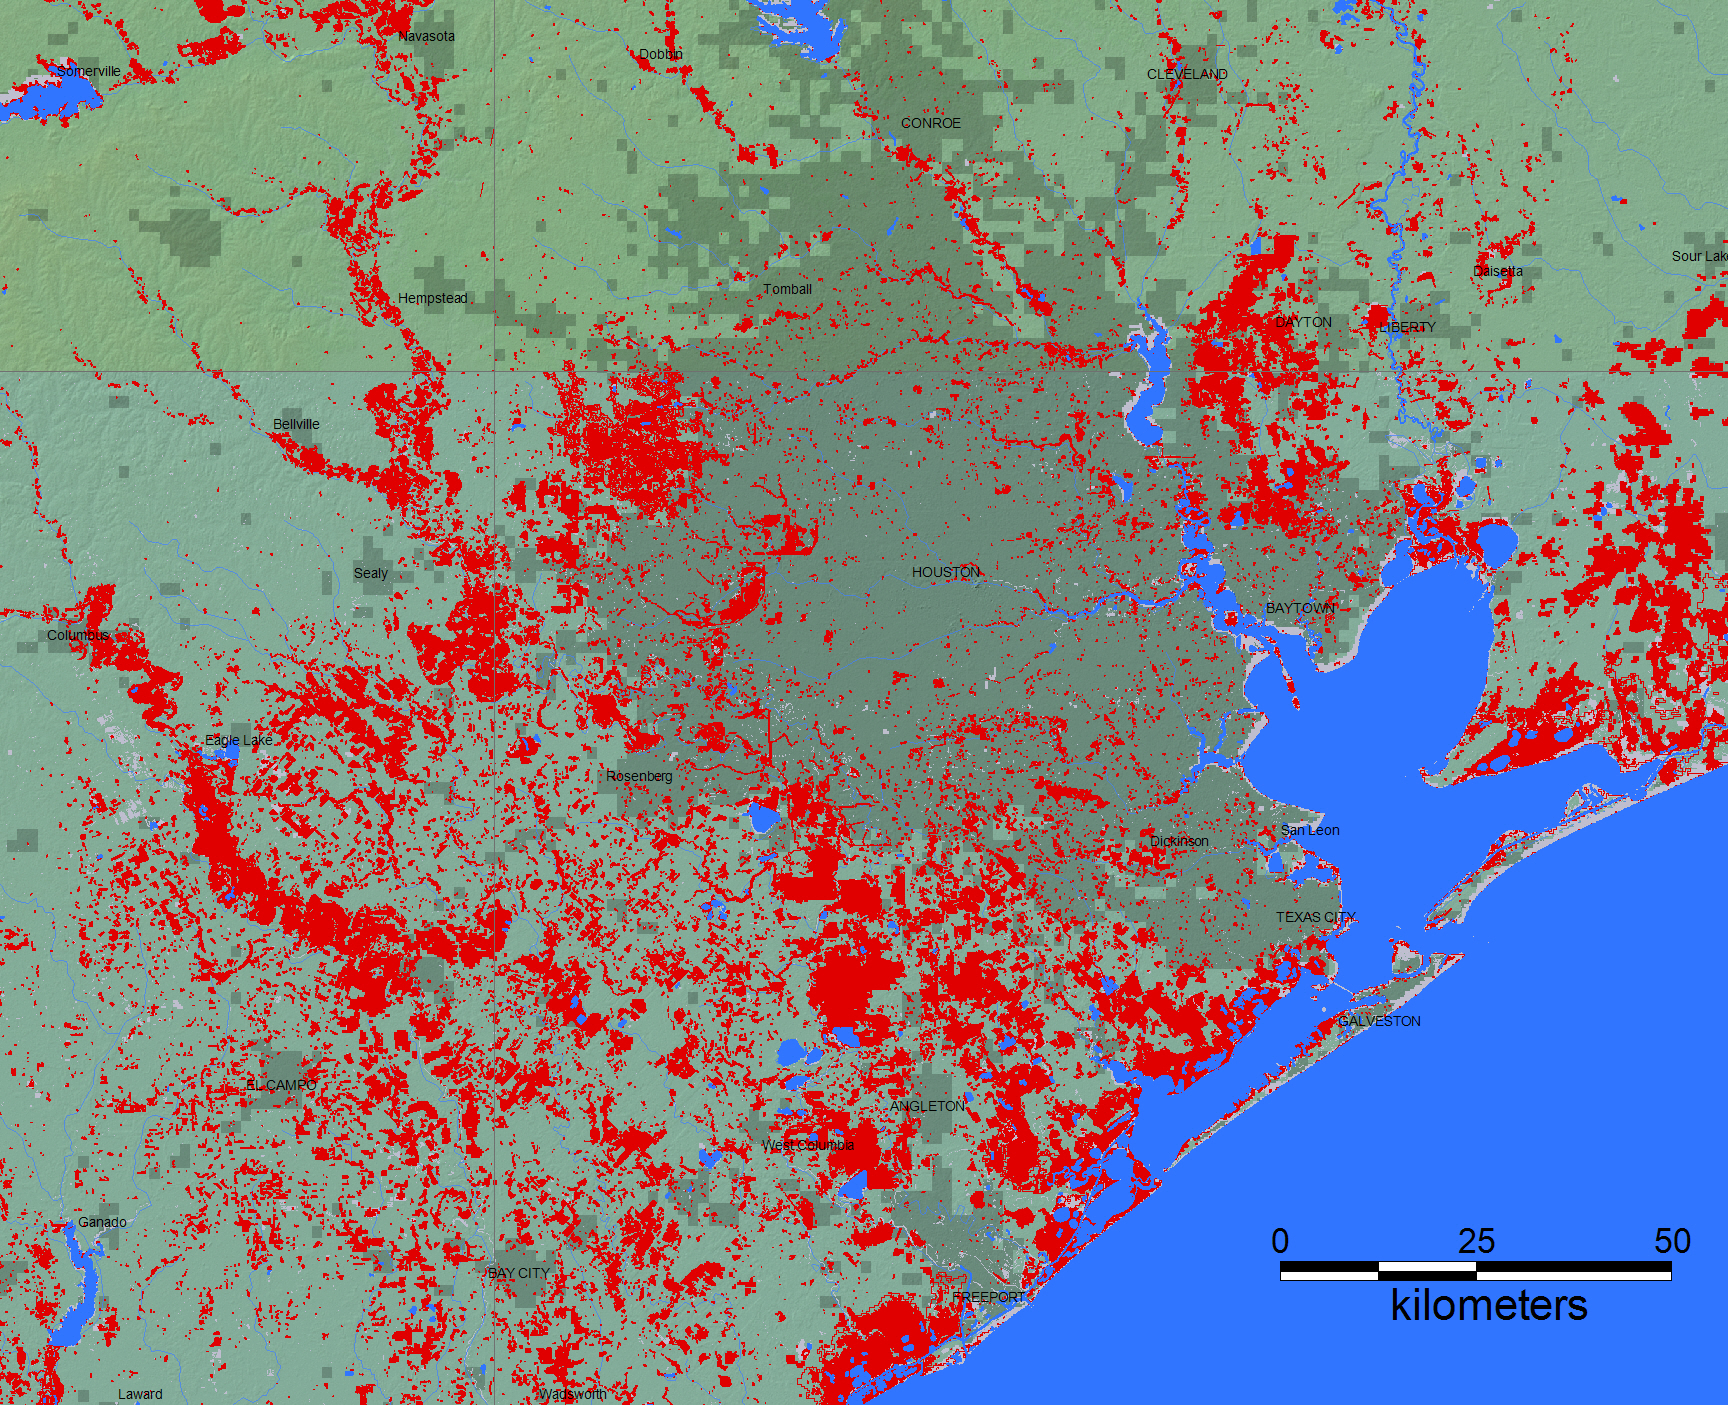
This event is selected for Observatory production of map and GIS data products.This web page and associated image and map (GIS) files are the permanent Flood Observatory record of this event. As the flood event proceeds, additional flood extent layers and maps may be added; the objective is mapping of the maximum extent flooded. On September 8, 2017, mapping of this event terminated.
According to Flood List: USA – Catastrophic Flooding in Houston and South East Texas 28 AUGUST, 2017 BY RICHARD DAVIES IN NEWS, USA · 0 COMMENT Massive amounts of rain brought by Hurricane Harvey have caused catastrophic flooding in parts of south eastern Texas, including Fort Bend, Brazoria and Galveston Counties, as well as Harris County and wide areas of Houston. Five people have reportedly died in the storm, including at least 2 in flooding in the Houston area. President Trump has issued a Major Disaster Declaration for the state of Texas The National Weather Service said: "The breadth and intensity of this rainfall are beyond anything experienced before. Catastrophic flooding is now underway and expected to continue for days." River levels in south eastern Texas have already broken previous record highs in at least 6 locations, with more record highs likely to follow. Local flood control authorities estimated that thousands of homes have been flooded across the Harris county, which includes most of Houston. Levels of the Addicks and Barker dams near Houston are dangerously high. The Army Corps of Engineers said it is releasing water to ease the situation. A spokesman for the Corps said "This flood event will exceed the 2016 tax day flood elevations." The torrential rain is expected to continue and spread eastwards, threatening flooding in parts of Louisiana. US Coast Guard – flooding in Greater Houston 27 August 2017. Rainfall Since making landfall on the Texas coast late on 25 August, Harvey has dumped historical levels of rainfall across parts of Houston and south eastern Texas. On Social Media, Jeff Lindner of the Harris County Flood Control District, described the rainfall totals as "insane" and "staggering". Harris County Flood Control District (HCFCD), responsible for flood control in the Houston area, said on 27 August that rainfall across Harris County has continued to intensify, "with rainfall totals in the last three to six hours that have greatly exceeded our 500-year rainfall levels". More than 20 locations in south eastern Texas recorded 20 inches of rain or more in a 24 hour period between 26 and 27 August. According to National Weather Service Houston, 26.76 inches of rain was recorded in parts of Brazoria County, and 27.45 inches was recorded in Dayton, Liberty County. Nearly all of HCFCD's rainfall gauges around Houston recorded more than 20 inches of rain in 48 hours to early 28 August. Clear Creek Village (30.72 inches), Baytown (33.08), and a gauge near Mont Belvieu (31.76) all recorded more than 30 inches during this period. Rainfall totals in south east Texas, 26 to 27 August. Image; NWS / NOAA Rivers On 27 August HCFCD said that all but a few watersheds were experiencing devastating flooding. HCFCD added that areas around the watersheds not currently flooded – Cedar Bayou, Carpenters Bayou, Sims Bayou, and White Oak Bayou – were still likely to see some flooding from the heavy rain. Rivers and creeks have exceeded major flood stage at 26 points across south eastern Texas as of 28 August. Rivers have exceeded previous record highs at 6 locations: Greens Bayou at Houston (current level, as of 28 August: 39.51 feet / Previous record: 39.4 feet) Cypress Creek near Cypress (128.11 / 127.6) Cypress Creek near Westfield (96.06 / 94.3) Navidad River at Sublime (36.23 / 34) Navidad River near Speaks (29.44 / 28.2) Buffalo Bayou at Piney Point Village (67.46 / 61.23) Greens Bayou at Houston jumped almost 40 feet in the space of 48 hours. River levels are predicted to exceed previous record highs in numerous other locations. Levels of Greens Bayou near Houston. Image: NWS / NOAA Evacuations Over the last few days evacuation orders have been issued for several areas of south eastern Texas, initially in coastal areas where Harvey made landfall, and later areas near the San Bernard and Brazos rivers due to threat of flooding, among others. However, the total number of those displaced is as yet unclear. Thousands of people in the Houston area are thought to have moved to higher ground. In some cases residents of flooded homes have taken refuge on rooftops. Emergency management officials requested that people escaping flood waters as a last resort do not stay in the attic, adding "If (the) highest floor of your home becomes dangerous, get on the roof." Red Cross shelters have been opened in the Houston area to house those forced from their homes. Houston City Multi Service Centers and some libraries have also been opened for shelters, as well as churches and community centers. Rescues Federal, state, and local search and rescue teams are operating 24/7 to reach those stranded in flooded areas. Emergency services have received thousand of appeals for rescues. Houston Police reported that police personnel have completed 90 flood rescue missions resulting in over 1,100 community members being brought to safety. Thousands of state and national guard troops have been deployed to affected areas. The Coast Guard has over 400 personnel conducting operations in south Texas, with 16 helicopters in the air and 8 more inbound. As of the afternoon 27 August, the Coast Guard had confirmed rescues of more than 2,000 multi-person cases in the Houston-Galveston area. The Coast Guard also has an additional nine teams onsite for shallow water rescues.
In addition to the maps above, for web map service-based (WMS) information visit this DFO link. Zoom in to location of interest, and turn on appropriate event and other data layers. See this link for examples of WMS output for this flood if provided.
Brakenridge, G.R. and Kettner, A. J., date accessed, "DFO Flood Event #", Dartmouth Flood Observatory, University of Colorado, Boulder, Colorado, USA, http address.

The maps and web pages provided here are by G. R. Brakenridge and A. J. Kettner and use should be guided by the terms of the Creative Commons Attribution-NonCommercial-ShareAlike 4.0 International License. Use for commercial purposes is by permission, which is freely granted. Please contact: Robert dot Brakenridge at Colorado.edu.
NASA Landsat 8 and ESA Sentinel SAR data if used in this map were obtained from the the U.S. Geological Survey Hazards Data Distribution System. and the Sentinels Science Data hub, respectively. Landsat 8 is jointly managed by NASA and the United States Geological Survey.
Sentinel SAR data processing: Most commonly, two "exact repeat" images are retrieved from ESA's Sentinels Data hub, from before the flood and during the flood. ESA SNAP software is used to reproject the two images into a geographic (latitude and longitude) coordinate system. A 7x7 pixel low pass filter is applied to both images. A threshold ranging from 50-70 is applied to the flood image, resulting in a subset of only very dark (interpreted as water) pixels. A threshold of .5-.7 is applied to a flood image/preflood image ratio product, resulting in a subset of pixels much darker in the flood image then before (this removes permanent surface water). A Boolean "AND" step then provides only pixels that satisfy both conditions.The exact thresholds used vary in the ranges provided; more strict thresholds map less flood water but also produce less false-positive errors. GIS vectors (polygons) are fit around pixels in the final "flood water" results: these are the red areas on the flood event maps, and the provided .shp and matching MapInfo files. Polygons smaller than .0025 square km in area are removed. Image dates for the pairs are shown as part of the GIS file names.
MODIS data processing
Click here for access to an automated daily MODIS-derived .shp file GIS record (record commences in 2011). Choose appropriate 10 deg x 10 deg map sheet directory and appropriate dates; longitude and latitudes refer to upper left map sheet corner. Not all floods are mappable at the MODIS spatial resolution of 250 m. Some DFO event maps also include these automated MODIS data. If provided in the GIS file directories, the MODIS "Current" file used is provided with its date; the file is an accumulation of all MODIS water for that date and 13 days prior.
Flood extent files (Shp or Mapinfo) supporting this Flood Event Map are located here.
These files may include high spatial resolution mapping such as from Sentinel or Landsat, or lower resolution files from MODIS. File names commonly include the sensor source (e.g., S1 for Sentinel 1, LS8 for Landsat, MODIS for MODIS).
Data from the Global Surface Water Explorer is included as part of the light gray previous satellite-mapped water extent. It is based on Landsat data at a spatial resolution of 30 m (Jean-Francois Pekel, Andrew Cottam, Noel Gorelick, Alan S. Belward, High-resolution mapping of global surface water and its long-term changes. Nature 540, 418-422, 2016). The NASA Shuttle Water Boundary Data (SWBD) surface water extent (90 m resolution), blue, was derived from NASA's the 11-day February, 2000, SRTM mission and this "permanent" water layer was also corrected using Landsat data. These data are not provided in the GIS directories.
When used in the maps, NASA NRT Global Flood Mapping maximum water extent for the years 2013-2015, at 250 m spatial resolution, provide part of the (light gray) previous satellite-mapped water extent layer. DFO creates these annual water extent layers from data provided by that project, by accumulating into one annual file all of the daily .shp files for each year. DFO has also produced flood extent files through mapping of individual floods (~ yr 2000 to present); these are also included in this layer.
When used in the maps, Copernicus Emergency Management Service data are imported as GIS files and installed in the GIS data folder. "Delineation" files refer to flood inundation extents. Dissemination Policy: Under Copernicus and Commission Delegated Regulations, the information produced by the Copernicus Emergency Management Service shall be made available to the public on a full, open and free-of-charge basis. To cite these data: "Copernicus Emergency Management Service, Directorate Space, Security and Migration, European Commission Joint Research Centre (EC JRC). Accessed August 29, 2017. http://emergency.copernicus.eu/".
Dr. Patrick Matgen, Luxembourg Institute of Science and Technology (LIST), in collboration with the ESA Research and Service Support Team, is sharing his SAR processing results for this flood event. We have compared results and they are very similar when using the same image data pairs. The method is explained in the following paper "in press": Chini, M., Hostache, R., Giustarini, L., & Matgen, P. 2017. A Hierarchical Split-Based Approach (HSBA) for parametric thresholding of SAR images: flood inundation as a test case, Transactions on Geoscience and Remote Sensing. Flood extent files converted into GIS formats are stored in a separate sub-folder in the GIS data folder.
 |
 |
 |
|---|---|---|
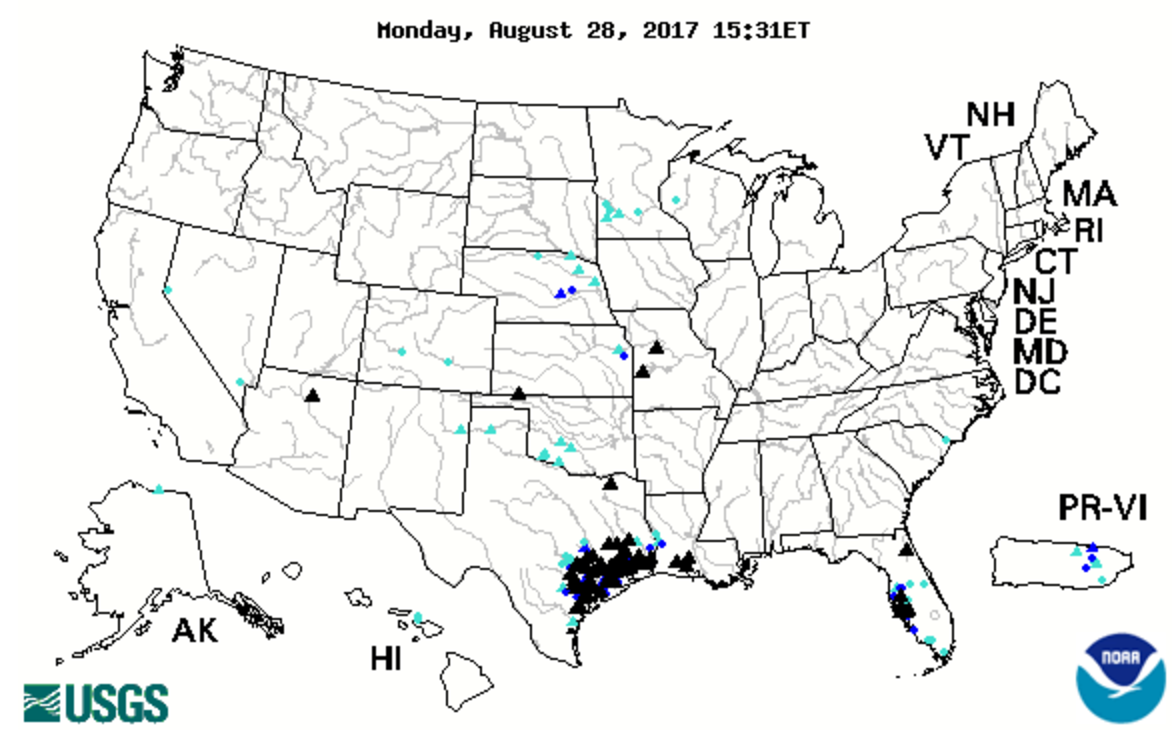
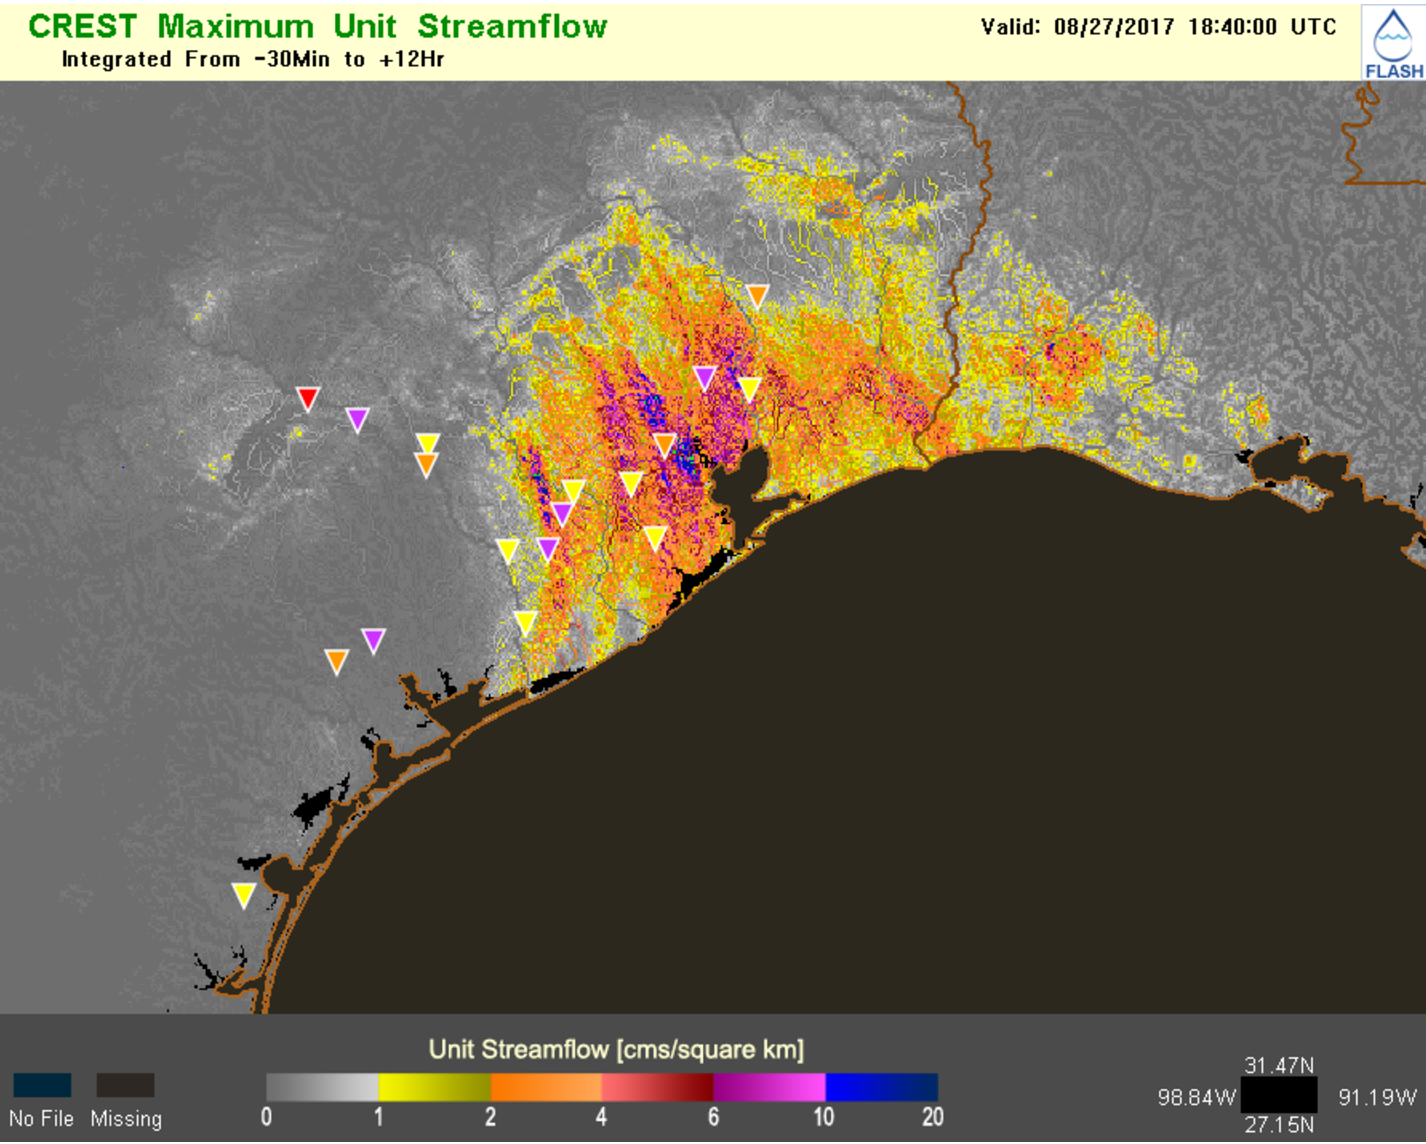
| USGS Water Watch | CREST Model U.S. flash flood system, 1-km/2-minute resolution forced with radar QPE. Triangles are stream gauges with observed flooding stages of purple -> major, red -> moderate, orange -> minor, yellow ->action. Courtesy Zac Flamig, NOAA CIMSS Operational Flash. | Real-Time TRMM Multi-Satellite Precipitation Analysis [TMPA/3B42] |
 |
 |
|
|---|---|---|
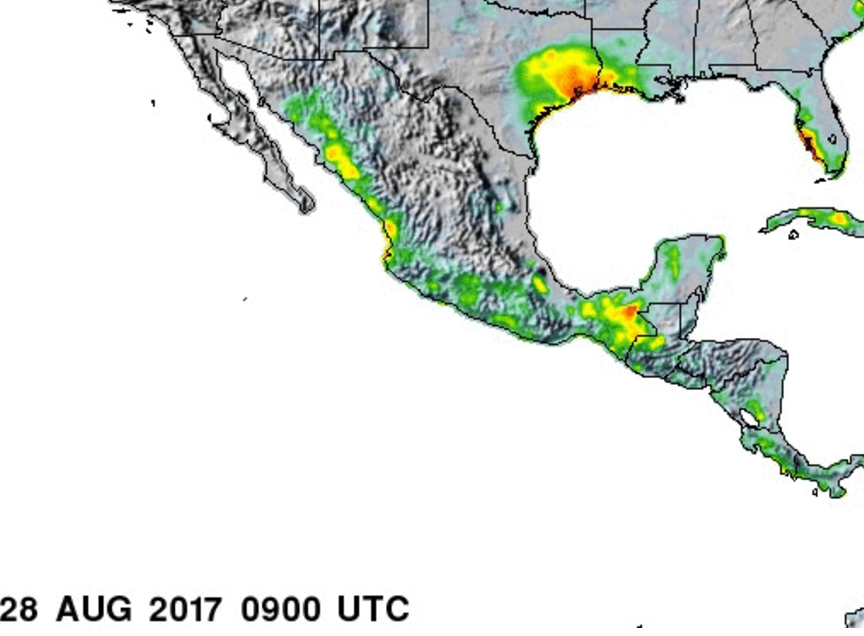
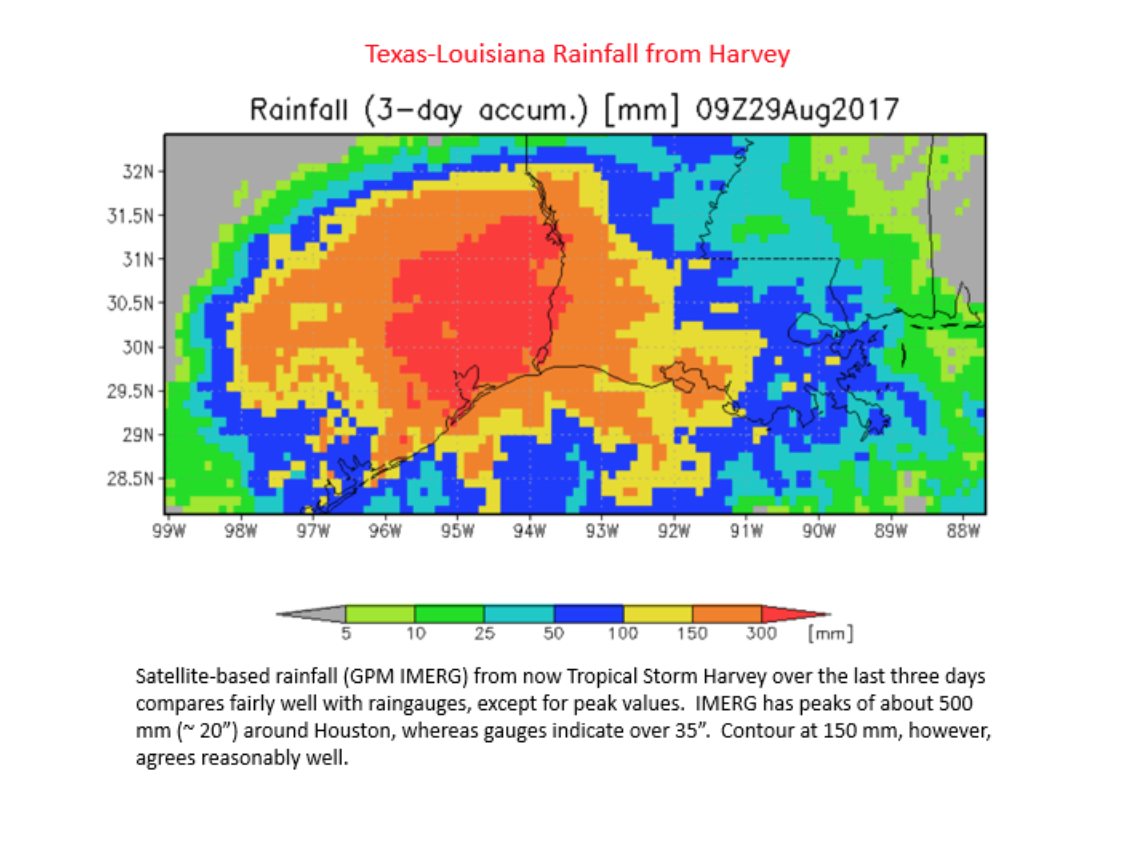
| NOAA Center for Satellite Applications and Research NOAA GOES-16 Loop: 2017/08/28 - Band 13 IR Summary of Harvey from 8/25 to 8/28 - tremendous amounts of rain in southeast Texas. | NASA GPM IMERG satellite precipitation display, courtesy Dr. Robert Adler, University of Maryland |
The NASA Earth Sciences Program, the Latin American Development Bank, the World Bank, the European Commission (Global Disaster Alert and Coordination System, GDACS), the Google Earth Engine research awards program, the Committee on Earth Observation Satellites (CEOS) Disasters Working Group-Flood Pilot, the Japanese Space Agency, and the European Space Agency all support or have supported this work via research grants and contracts or by provision of free satellite-derived data.
The Dartmouth Flood Observatory was founded in 1993 at Dartmouth College, Hanover, NH USA and moved to the University of Colorado, INSTAAR, CSDMS in 2010. The institutional support of both universities is gratefully acknowledged.
(counting since August 28, 2017)