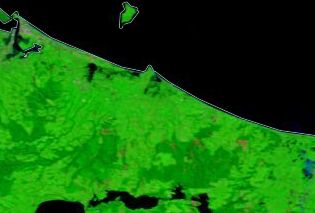
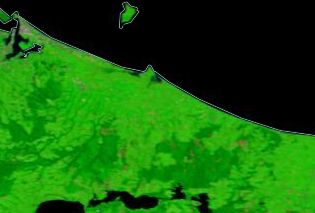
NASA LANCE WorldView MODIS Band 7,2,1 Image, March 21, 2017 (before heavy rainfall) |
NASA LANCE WorldView MODIS Band 7,2,1 Image, April 8, 2017 (after heavy rainfall) |
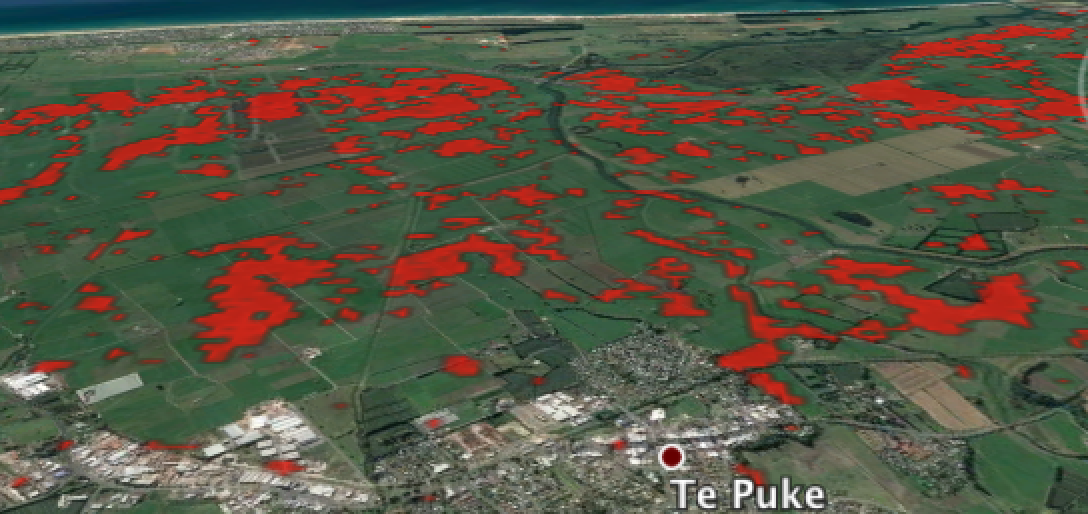
Access Google Earth Kmz version (from April 4 SAR image) |
|---|---|---|
 |
The Flood Observatory maintains a Global Active Archive of large flood events, 1985 to present. It is available to the public in both spreadsheet and GIS formats (both formats together provide the complete Archive). New events are entered into this archive each week. As of the end of 2016, there were 4432 events; each has a unique archive number.
This Flood List link provides a summary. According to Flood List (April 5, 2017): "An area of low pressure containing high levels of tropical moisture left over from the remnants of Cyclone Debbie resulted in torrential rain in parts of northern New Zealand from 04 April, 2017. Cyclone Debbie and its aftermath caused major flooding in parts of Queensland and New South Wales, Australia, over the last few days. At least 6 people have died in the floods. In New Zealand, the heavy rain and strong winds caused havoc in wide areas of North Island stretching from Auckland to Wellington. According to WMO figures, Tauranga recorded 112 mm of rain in 24 hours between 04 and 05 April. Taupo recorded 74 mm, Gisborne 60.2 mm and Auckland 75 mm during the same period. Over 100 schools were closed and 92 early learning centres, affecting 13,725 students according to local media. A power cut in south Auckland affected thousands of homes. Numerous roads were closed and a landslide isolated a number of homes in Titirangi, in south west Auckland. Part of a cliff collapsed in Kohimarama as a result of the rain.".
NASA Landsat 8 and ESA Sentinel SAR data if used in this map were obtained from the the U.S. Geological Survey Hazards Data Distribution System. and the Sentinels Science Data hub, respectively. Landsat 8 is jointly managed by NASA and the United States Geological Survey. Flood modeling results if used are from the NASA/University of Maryland Global Flood Monitoring System (GFMS), Drs. Robert Adler and Huan Wu, University of Maryland/ESSIC.
GIS Data Sources:
GIS files supporting this Flood Event Map are located here.
Click here for access to the automated daily MODIS-derived .shp file GIS record (record commences in 2011). Choose appropriate 10 deg x 10 deg map sheet directory and appropriate dates; longitude and latitudes refer to upper left map sheet corner.
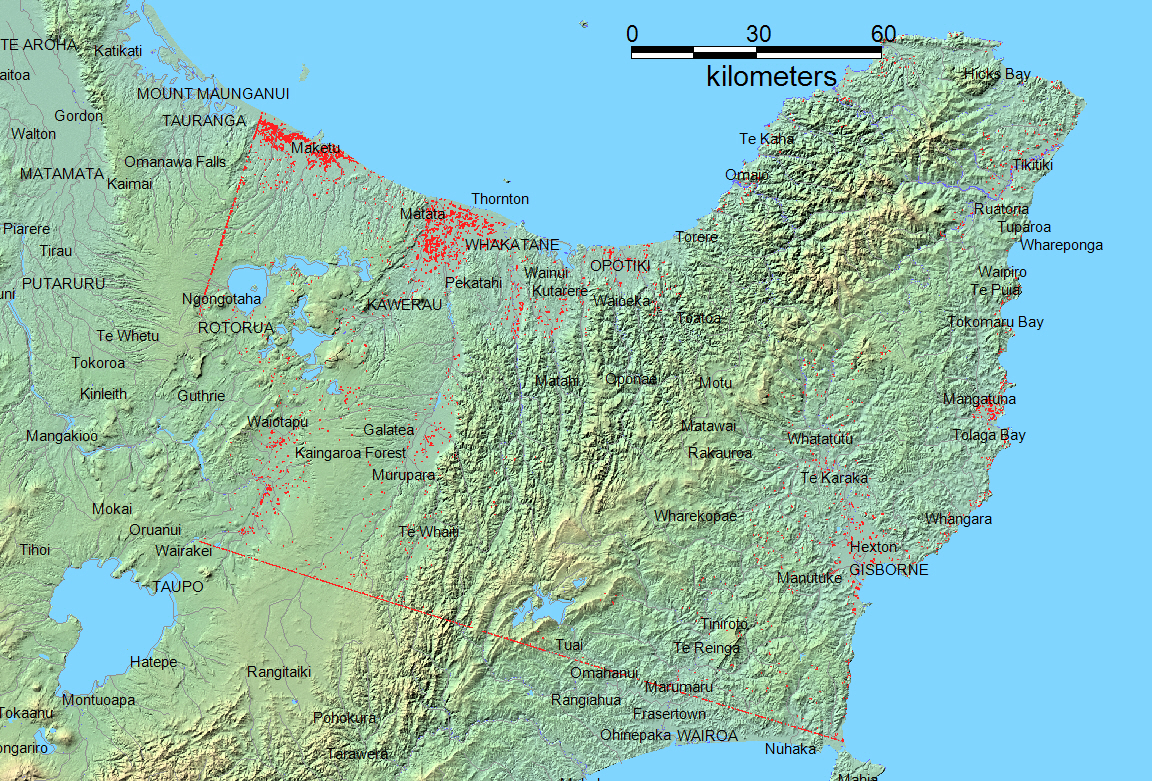
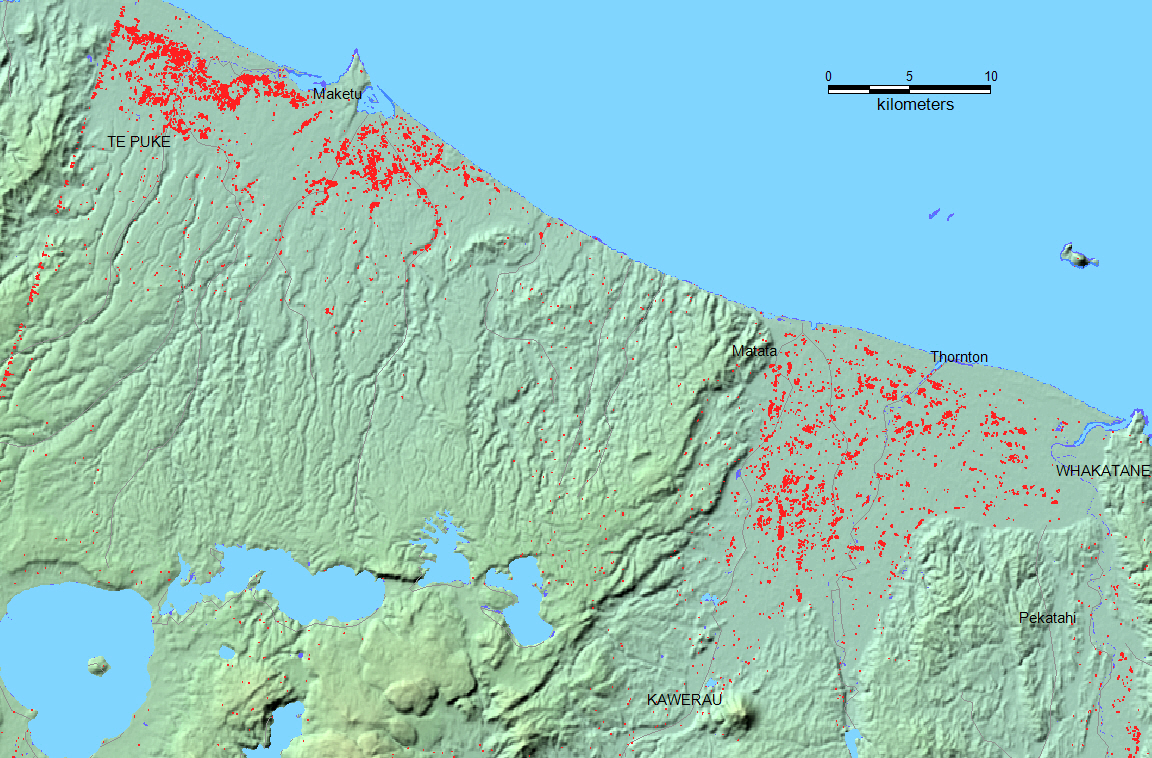
The Global Surface Water Explorer provides part of the (dark blue) annual surface water extent layer. It is based on Landsat data at a spatial resolution of 30 m (Jean-Francois Pekel, Andrew Cottam, Noel Gorelick, Alan S. Belward, High-resolution mapping of global surface water and its long-term changes. Nature 540, 418-422, 2016). On the map, it is shown together with the NASA Shuttle Water Boundary Data (SWBD) surface water extent (90 m resolution) processed from the 11-day February, 2000, SRTM mission and corrected using Landsat data. Large flood events are not normally depicted in either data set. Thus, red areas on our maps show flood extent beyond these more typical water extents
When used, NASA NRT Global Flood Mapping maximum water extent for the years 2013-2015, at 250 m spatial resolution, provide part of the (dark blue) maximum flood mapped. DFO creates these annual water extent layers from data provided by that project, by accumulating into one annual file all of the daily .shp files for each year. DFO has also produced flood extent files through mapping of individual floods (~ yr 2000 to present); these are also included where available in this maximum flood extent layer.
(counting since April 12, 2017)