


The Flood Observatory maintains a Global Active Archive of large flood events, 1985 to present. It is available to the public in both spreadsheet and GIS formats (both formats together provide the complete Archive). New events are entered into this archive each week. As of the end of 2016, there were 4432 events; each has a unique archive number.
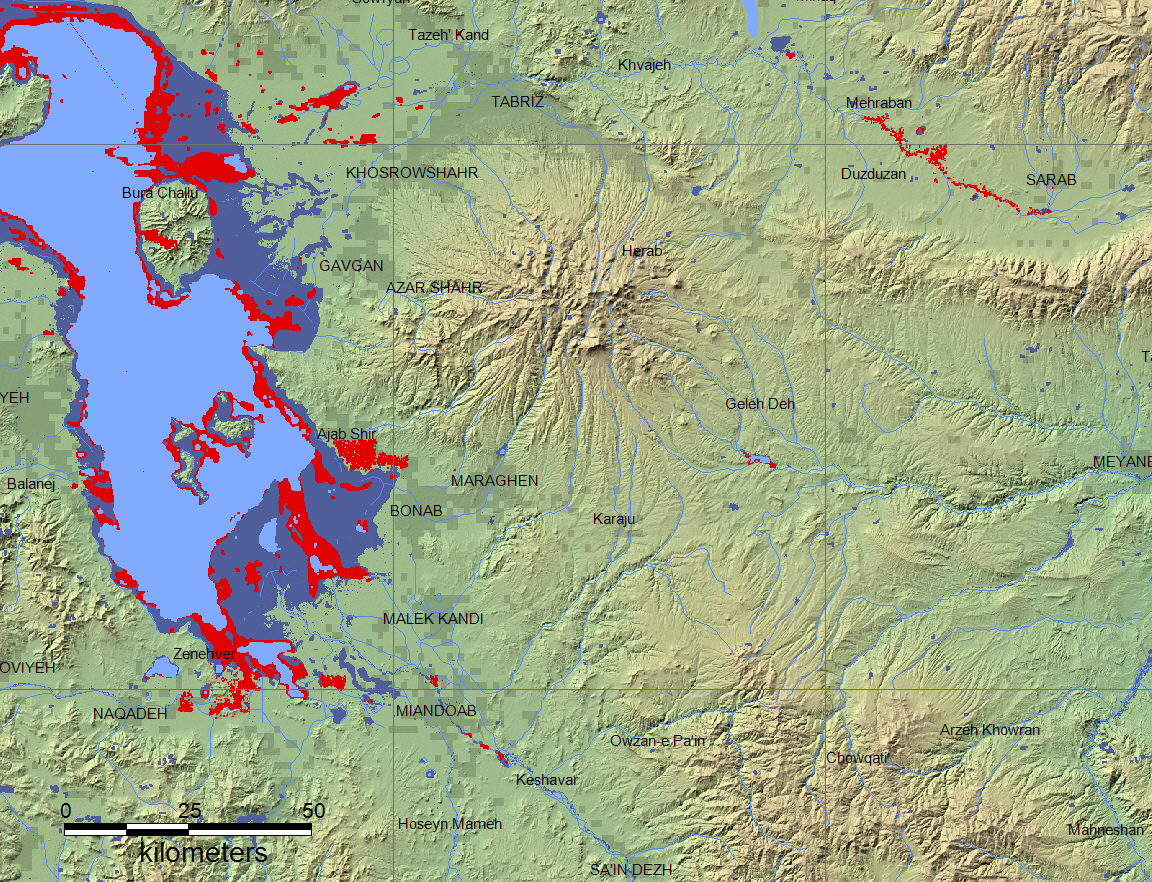
This Flood List link provides a summary. According to Flood List (April 17, 2017): "Iranian Red Crescent says that flash flooding and landslides affected than 40 counties in six provinces of East Azerbaijan, West Azerbaijan, Kurdistan, Zanjan, Mazandaran and Ardebil in Iran’s northwest on Saturday, 15 April 2017. Major flooding triggered by heavy rains in these provinces flooded houses and swept away cars after rivers burst their banks. Areas around Ajabshir and Azar-Shahr, both in East Azerbaijan Province, have been worst hit. Iranian Red Crescent says that at least 42 people have died in the floods. Iran’s Press TV says the figure has now reached 48. Most of the fatalities were in East Azerbaijan Province. Esma’eel Najjar, the head of the country’s Crisis Management Organization was quoted by local media as saying that 20 deaths occurred in the village of Chinar in Ajabshir and 22 in Azar-Shahr, both in East Azerbaijan Province. A further 5 deaths were reported in Kurdistan Province (1 in Nanur, 4 in Saqqez) and one fatality in West Azerbaijan Province. Local media report that water level in the rivers of Azar-Shahr has risen to the highest levels for decades. European Civil Protection and Humanitarian Aid Operations (ECHO) reports that the Iranian Red Crescent as well as air ambulances, police and the army have been deployed to assist in search and rescue and relief efforts".
NASA Landsat 8 and ESA Sentinel SAR data if used in this map were obtained from the the U.S. Geological Survey Hazards Data Distribution System. and the Sentinels Science Data hub, respectively. Landsat 8 is jointly managed by NASA and the United States Geological Survey. Flood modeling results if used are from the NASA/University of Maryland Global Flood Monitoring System (GFMS), Drs. Robert Adler and Huan Wu, University of Maryland/ESSIC.
GIS files supporting this Flood Event Map are located here. Please contact us before downloading and using these files so that we can provide the most current versions.
Click here for access to the automated daily MODIS-derived .shp file GIS record (record commences in 2011).
Data from the Global Surface Water Explorer (a download data link is provided) is included as part the (dark blue) surface water layer. It is based on Landsat data at a spatial resolution of 30 m (Jean-Francois Pekel, Andrew Cottam, Noel Gorelick, Alan S. Belward, High-resolution mapping of global surface water and its long-term changes. Nature 540, 418-422, 2016). On the map, it is shown together with the NASA Shuttle Water Boundary Data (SWBD) surface water extent (90 m resolution) processed from the 11-day February, 2000, SRTM mission and corrected using Landsat data. Large flood events are not normally depicted in either data set. Thus, red areas on our maps show flood extent beyond these more typical water extents.
When used, NASA NRT Global Flood Mapping maximum water extent for the years 2013-2015, at 250 m spatial resolution, provide part of the (dark blue) maximum flood mapped. DFO creates these annual water extent layers from data provided by that project, by accumulating into one annual file all of the daily .shp files for each year. DFO has also produced flood extent files through mapping of individual floods (~ yr 2000 to present); these are also included where available in this maximum flood extent layer.
(counting since April 18, 2017)