


(Allow time to load; file is very complex)
The Flood Observatory maintains a Global Active Archive of large flood events, 1985 to present. It is available to the public in both spreadsheet and GIS formats (both formats together provide the complete Archive). New events are entered into this archive each week. As of the end of 2016, there were 4432 events; each has a unique archive number.
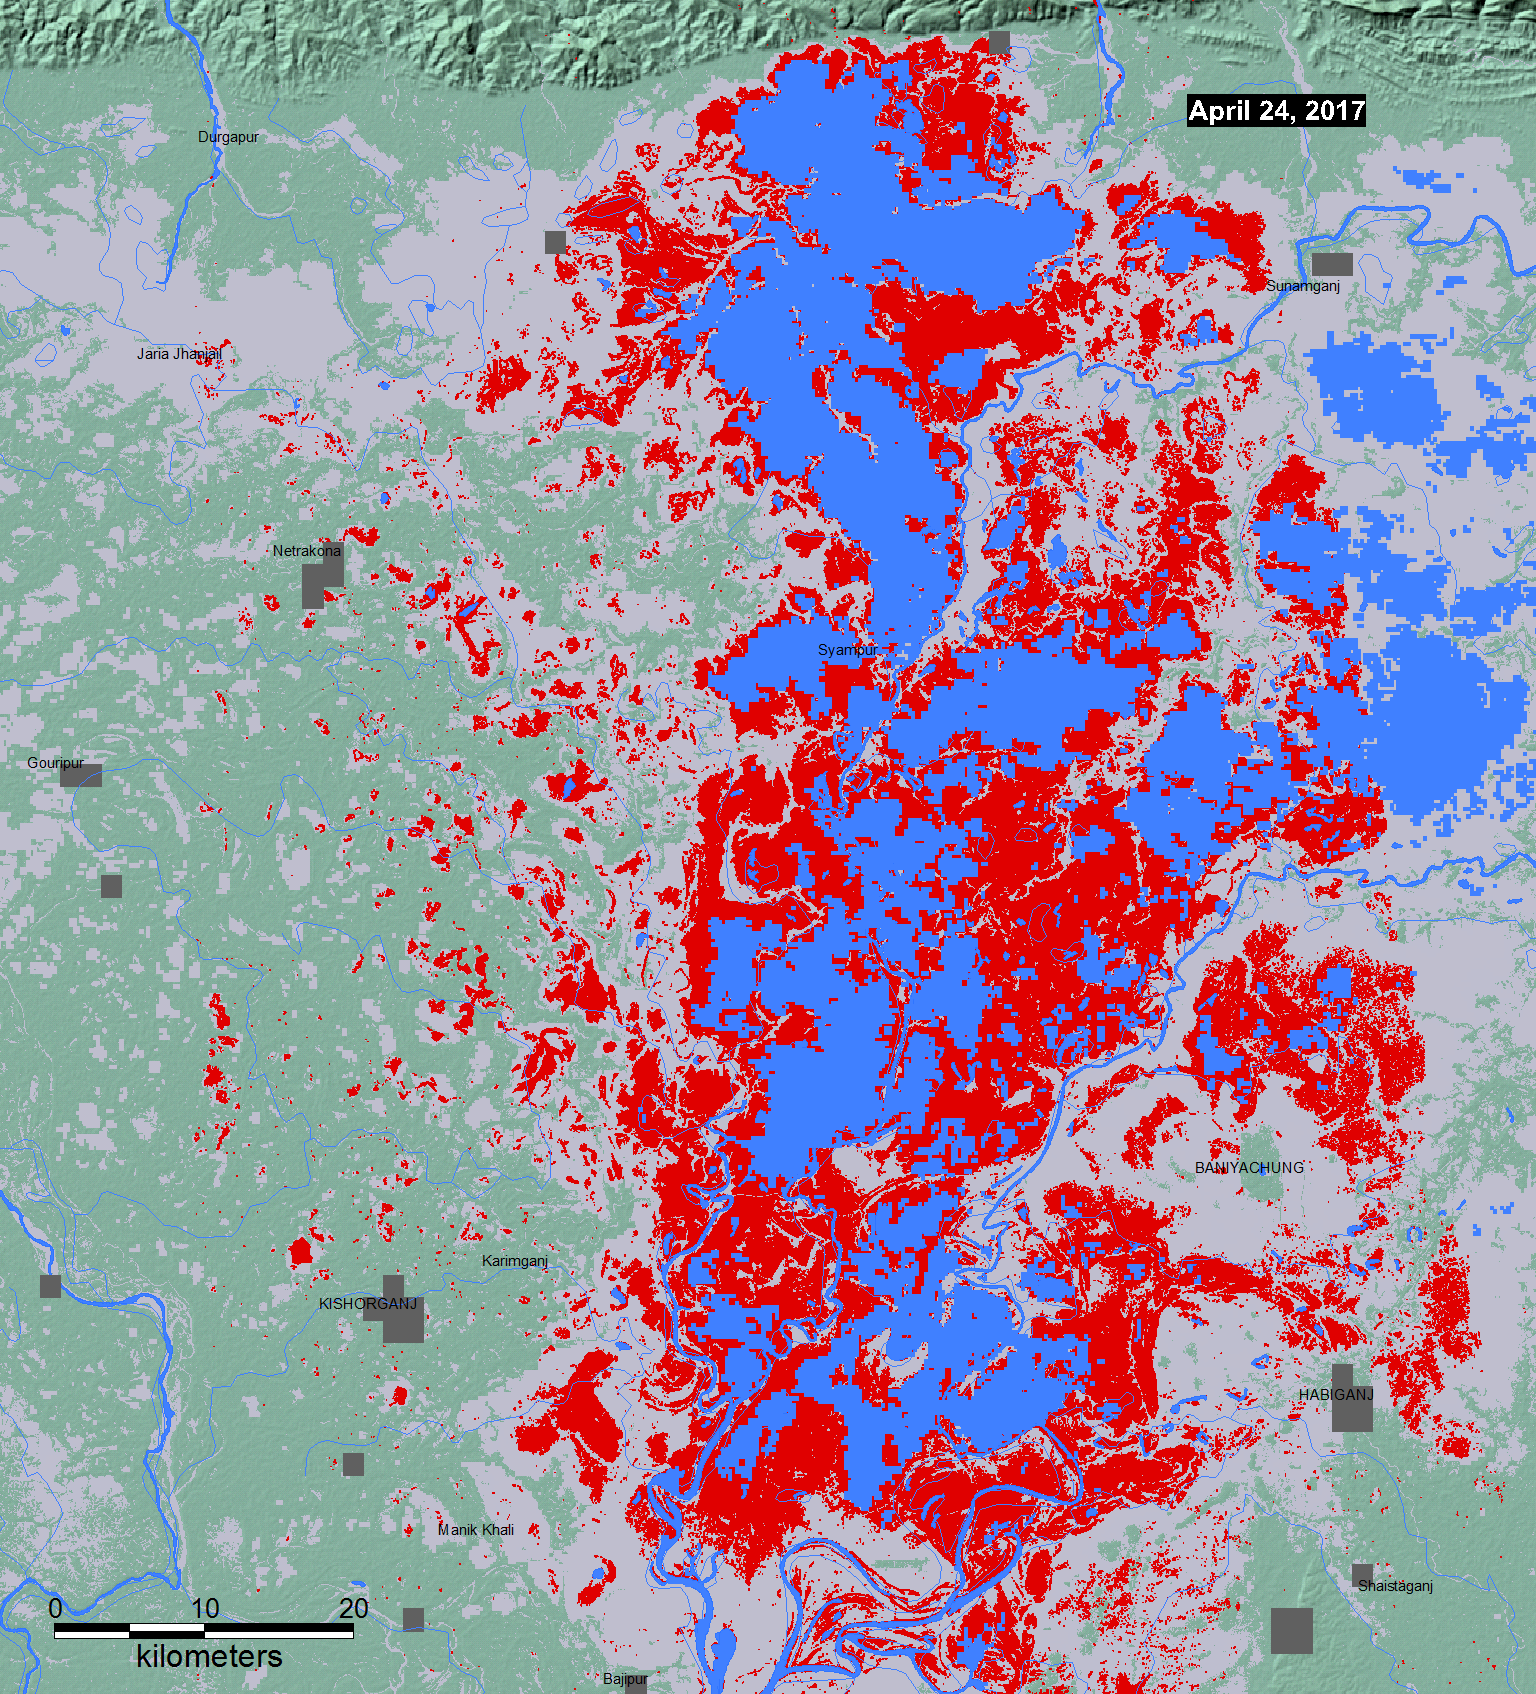
According to Relief Web: "Flash Flood Situation, April 19, 2017 Report from NIRAPAD Published on 19 Apr 2017. Overview of Flash Flood, April 19, 2017 Heavy rainfalls as well as onrush of water from the upstream Meghalaya hills in India have led to the inundation of a vast areas of croplands of Haors and low-lying areas of the northeast. Flood started on 28th March affecting six districts (Sylhet, Moulavibazar, Sunamganj, Habiganj, Netrokona and Kishoreganj) in the north east region. Rising water overflow and breeched embankment in many places and inundated vast areas of croplands. It destroyed nearly-ready-for-harvesting boro rice in about 160,170 hectors areas (details information in table 1)". According to BDNews, BDNews, "Bangladesh has experienced the highest rainfall in April in 35 years, according to the Met office statistics... Some 10,000 mm of rainfall was recorded in April in 1981," an official in weather office said. "We have recorded nearly 9,000 mm of rain in first three weeks of the month....We experience nor'wester in this season but not much rain. This kind of rain we usually see in monsoon," said the meteorologist... Trough of low lying over West Bengal and adjoining area, which extends to North Bay, and an existing steep pressure gradient over North Bay are responsible for the current rainfall...The highest April rainfall recorded in different parts of Bangladesh are as follows: on April 2- 71mm in Sylhet, on April 3 - 81mm in Sylhet, April 4 - 58mm in Chittagong, April 5- 122mm in Srimangal, April 7- 62mm in Sylhet, April 8 - 21mm in Netrokona, April 15 - 36mm in Dinajpur, April 18 - 33mm in Tetulia, April 19 - 114mm in Madaripu, April 20 - 194mm in Srimangal, April 21 - 97mm in Dinajpur, April 22- 98mm in Maijdee and April 23 - 118mm in Rangamati". See also related DFO Event #4459.
For a web map service-based information, visit this DFO link and, zoom in to location of interest, and turn on appropriate data layers.
NASA Landsat 8 and ESA Sentinel SAR data if used in this map were obtained from the the U.S. Geological Survey Hazards Data Distribution System. and the Sentinels Science Data hub, respectively. Landsat 8 is jointly managed by NASA and the United States Geological Survey. Flood modeling results if used are from the NASA/University of Maryland Global Flood Monitoring System (GFMS), Drs. Robert Adler and Huan Wu, University of Maryland/ESSIC.
Event-specific water extent files supporting this Flood Event Map are located here. These may include high spatial resolution mapping such as from Sentinel or Landsat, or lower resolution files from MODIS. Draft versions may be posted and later revised; such revisions will include in the file names "r1", "r2", etc. The older files remain in this folder but generally should not be used. Both MapInfo and Shp formats are provided.
Notes on Sentinel SAR data processingj for this map: Two "exact repeat" images were retrieved from ESA's Sentinels Data hub, from before the flood (February 25, 2015) and during the flood (February 24, 2017). ESA SNAP software was used to reproject the two images intoa geographic (latitude and longitude) coordinate system. A 5x5 low pass filter was applied to both images. A threshold of 50 was applied to the flood image, resulting in a subset of only very dark (interpreted as water) pixels. A threshold of .5 was applied to a flood image/preflood image ratio product, resulting in a subset of pixels much darker in the flood image then before (this removes permanent surface water). A Boolean "AND" step then provides only pixels that satisfy both conditions. GIS vectors (polygons) were fit around pixels in this "flood water" result: red area on this map, and also provided as a shp file.
Click here for access to the automated daily MODIS-derived .shp file GIS record (record commences in 2011). Choose appropriate 10 deg x 10 deg map sheet directory and appropriate dates; longitude and latitudes refer to upper left map sheet corner; not all floods are mappable at the MODIS spatial resolution of 250 m)
Data from the Global Surface Water Explorer (a download data link is provided) is included as part the light reddish gray maximum previous water extent layer. It is based on Landsat data at a spatial resolution of 30 m (Jean-Francois Pekel, Andrew Cottam, Noel Gorelick, Alan S. Belward, High-resolution mapping of global surface water and its long-term changes. Nature 540, 418-422, 2016). On the map, it is shown beneath the NASA Shuttle Water Boundary Data (SWBD) surface water extent (90 m resolution), blue, processed from the 11-day February, 2000, SRTM mission and corrected using Landsat data.
When used, NASA NRT Global Flood Mapping maximum water extent for the years 2013-2015, at 250 m spatial resolution, provide part of the (light reddish gray) maximum flood mapped. DFO creates these annual water extent layers from data provided by that project, by accumulating into one annual file all of the daily .shp files for each year. DFO has also produced flood extent files through mapping of individual floods (~ yr 2000 to present); these are also included where available in this maximum flood extent layer.
(counting since April 26, 2017)