


The Flood Observatory maintains a Global Active Archive of large flood events, 1985 to present. It is available to the public in both spreadsheet and GIS formats (both formats together provide the complete Archive). New events are entered into this archive each week. As of the end of 2016, there were 4432 events; each has a unique archive number.
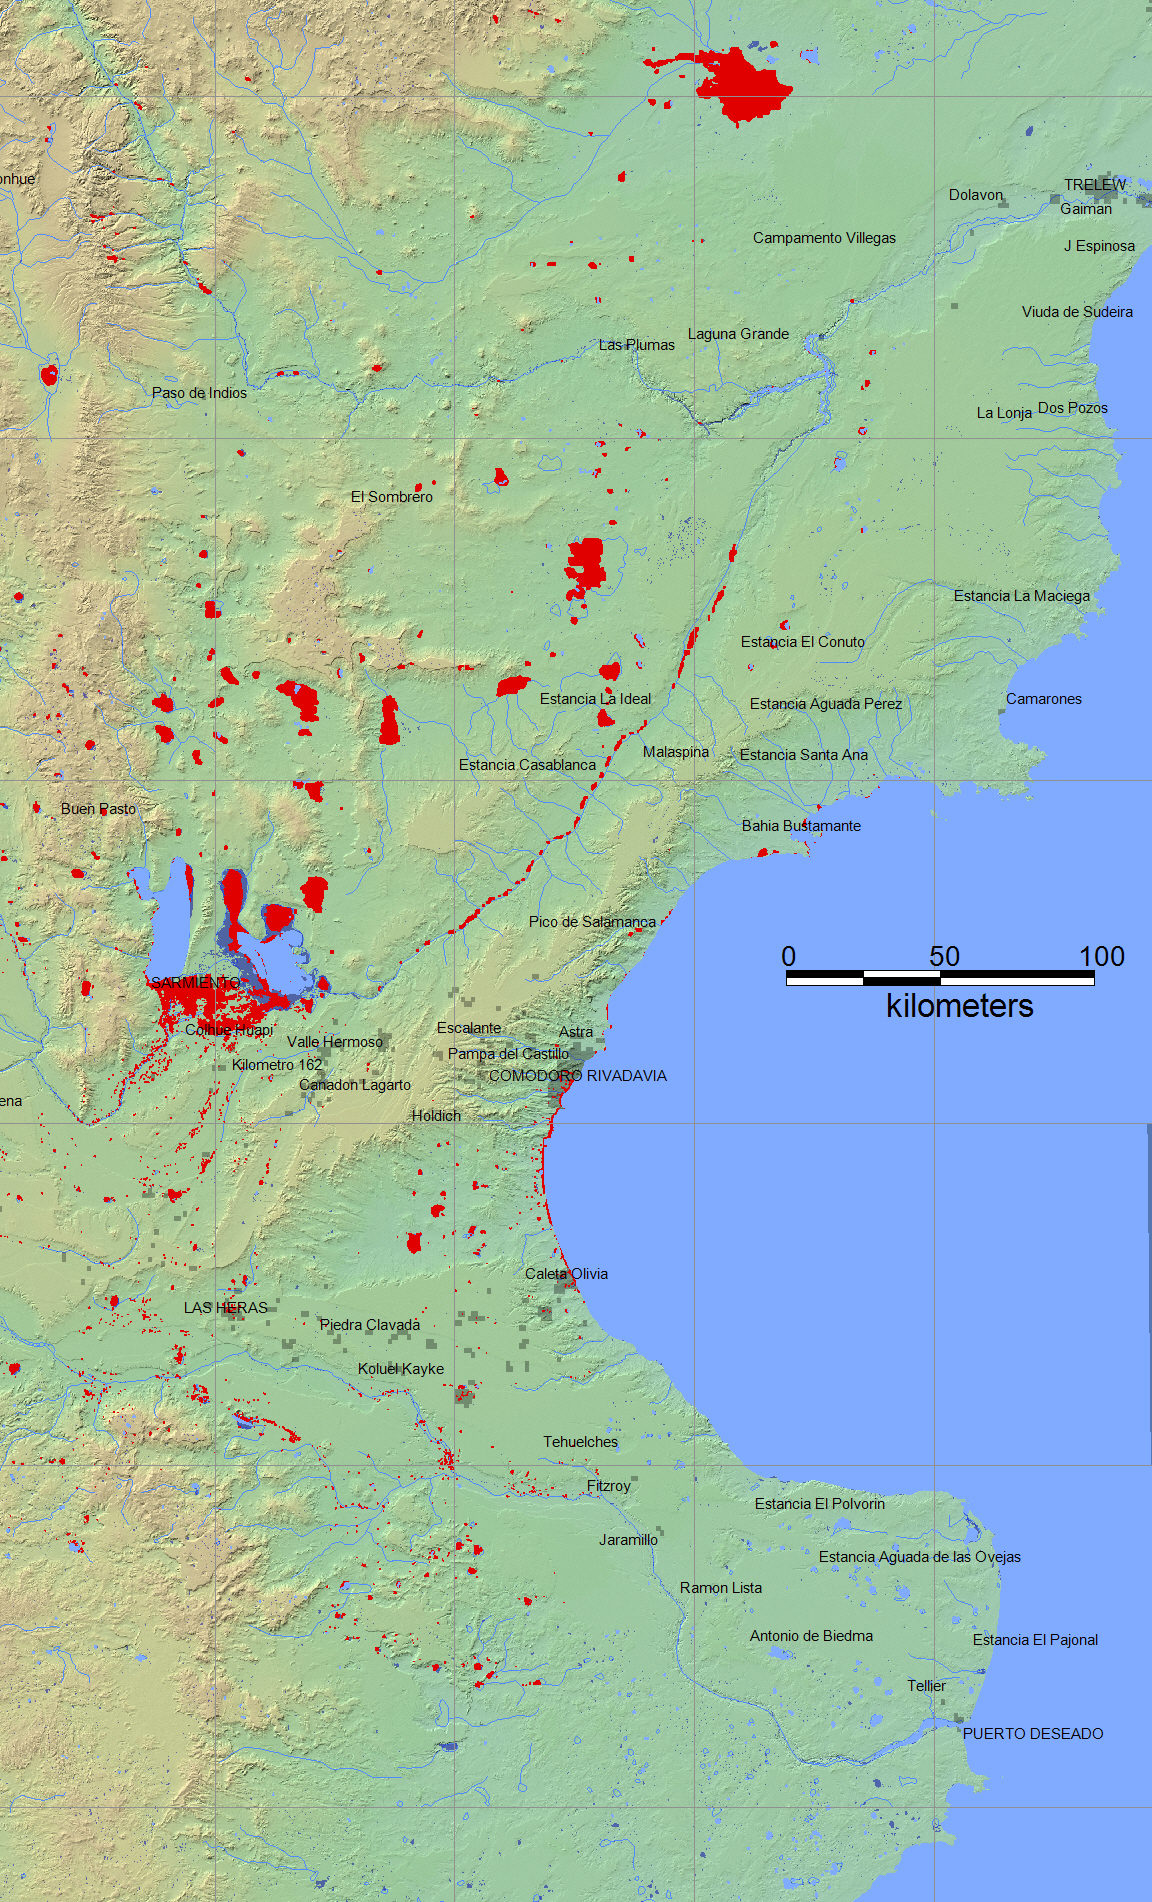
This Flood List link provides a summary. According to Flood List (April 11, 2017): "Rain has been falling in Chubut Province, Argentina, for more than 2 weeks, causing severe flooding in Comodoro Rivadavia and surrounding areas. The city of Comodoro Rivadavia received more than a year’s worth of rain in the space of a few days. Local authorities say that thousands of people have been forced from their homes. Although full damage assessments are yet to be carried out it is thought that there could be as many as 2,000 homes damaged or destroyed. Comodoro Rivadavia municipality say that there are currently 3,000 people staying in 24 relief centres set up in schools, churches and community centres around the city. A further 6,000 people are thought to have “self-evacuated” to stay with friends or relatives. The heavy rain first began to fall around Wednesday 29 March. By 31 March, 2017, around 1,300 people had evacuated their homes and the city declared a state of emergency. Officials from Comodoro Rivadavia said that between Wednesday 29 March at 17:30 and Friday 31 March at 21:00, as much as 287.5 mm of rain fell in the city. This figure is more than the city would normally see for the whole year (238.7 mm on average) and over ten times more than the average for March (usually around 20 to 24 mm). Further heavy rain from 06 April forced more people from their homes. Local media report that one person has died in the floods. Authorities have since declared a disaster for the area. Christian Garavaglia, Meteorologist at Servicio Meteorológico Nacional said via Twitter that in the last 13 days (to 07 April) Comodoro Rivadavia recorded 393.4 mm of rain, which he described as an “extraordinary amount.” Images of clean up operations show the city’s streets still covered in flood debris. Telam News Agency said that “more than half a city was covered".
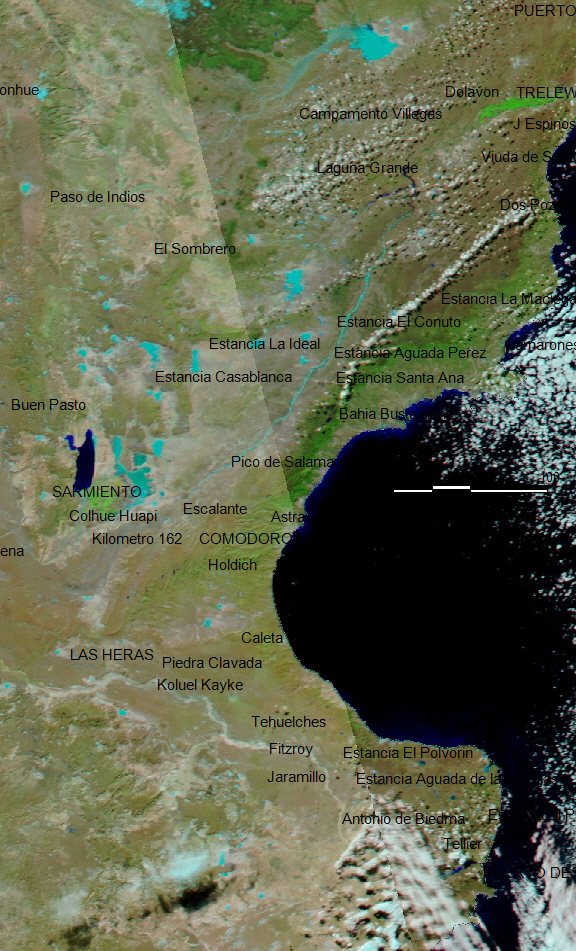
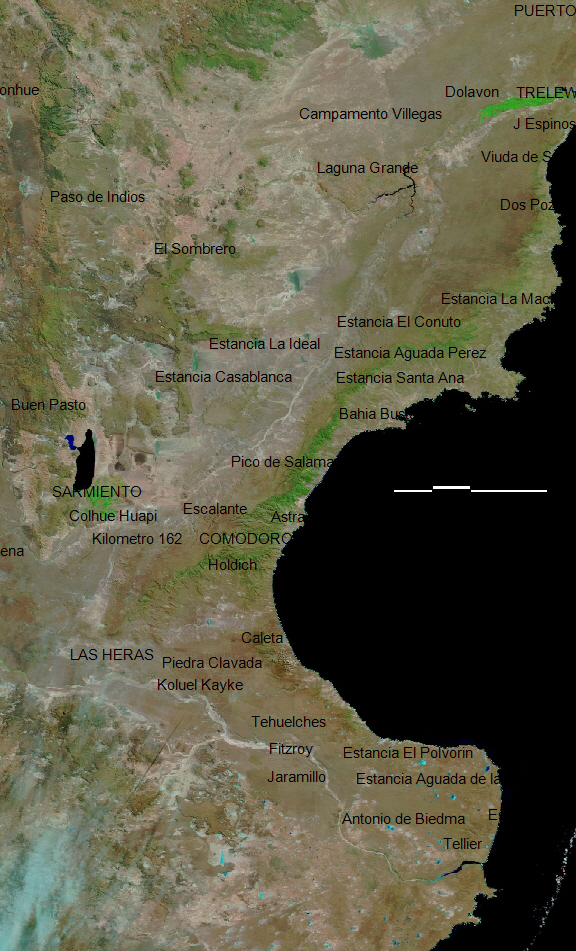
NASA Landsat 8 and ESA Sentinel SAR data if used in this map were obtained from the the U.S. Geological Survey Hazards Data Distribution System. and the Sentinels Science Data hub, respectively. Landsat 8 is jointly managed by NASA and the United States Geological Survey. Flood modeling results if used are from the NASA/University of Maryland Global Flood Monitoring System (GFMS), Drs. Robert Adler and Huan Wu, University of Maryland/ESSIC.
Event-specific water extent files supporting this Flood Event Map are located here. These may include high spatial resolution mapping such as from Sentinel or Landsat, or lower resolution files from MODIS. Draft versions may be posted and later revised; such revisions will include in the file names "r1", "r2", etc. The older files remain in this folder but generally should not be used. Both MapInfo and Shp formats are provided.
Click here for access to the automated daily MODIS-derived .shp file GIS record (record commences in 2011).
Data from the Global Surface Water Explorer (a download data link is provided) is included as part the (dark blue) surface water layer. It is based on Landsat data at a spatial resolution of 30 m (Jean-Francois Pekel, Andrew Cottam, Noel Gorelick, Alan S. Belward, High-resolution mapping of global surface water and its long-term changes. Nature 540, 418-422, 2016). On the map, it is shown together with the NASA Shuttle Water Boundary Data (SWBD) surface water extent (90 m resolution) processed from the 11-day February, 2000, SRTM mission and corrected using Landsat data. Large flood events are not normally depicted in either data set. Thus, red areas on our maps show flood extent beyond these more typical water extents.
When used, NASA NRT Global Flood Mapping maximum water extent for the years 2013-2015, at 250 m spatial resolution, provide part of the (dark blue) maximum flood mapped. DFO creates these annual water extent layers from data provided by that project, by accumulating into one annual file all of the daily .shp files for each year. DFO has also produced flood extent files through mapping of individual floods (~ yr 2000 to present); these are also included where available in this maximum flood extent layer.
(counting since April 14, 2017)