


DFO Flood Event 4409
Southern Australia Flooding, October 6-20, 2016
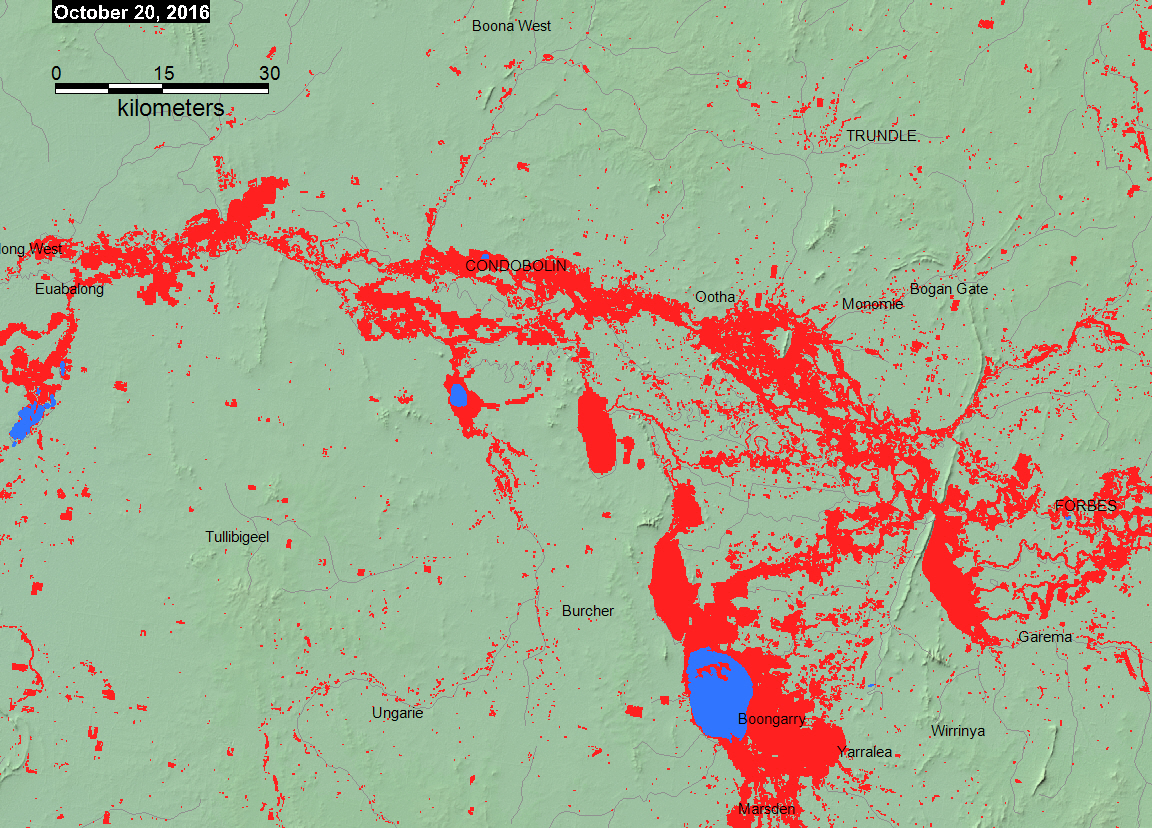
Flood Map (New South Wales)
Red is flood water during past 14 days from MODIS 250 m data and data from comparison of Landsat 8 scenes from August 15 and September 20, 2016. Green is previous flooding, 2000-present. Dark blue is permanent surface water
Geotif version
Google Earth kmz version
| |
|
Satellite 7 day precipitation from NASA GSFC |
|
Explanation
Event Reporting:
The Flood Observatory maintains a Global Active Archive of large flood events, 1985 to present. It is available to the public in both spreadsheet and GIS formats (both formats together provide the complete Archive). New events are entered into this archive each week. As of the end of 2015, there were 4319 events; each has a unique archive number.
Event Mapping:
In some cases, severe or damaging floods become the focus of Observatory inundation mapping. As part of collaborations with other organizations, and the Global Flood Partnership, the Observatory's maps and other data are made available to the public. With attribution, they can be used freely, including for commercial purposes, under the terms of the Creative Commons Attribution 3.0 Unported License. Geotif versions and GIS files are also provided for these maps through the links below. This event is selected for Observatory production of map and GIS data products.This web page and associated image and map (GIS) files are the permanent Flood Observatory record of this event.
This Event:
This Flood List link provides a summary. According to Flood List: "Update, 16 September, 2016 A body has been recovered from a dam in the south-west of Victoria. It is believed to be that of a the man reported as missing in the floods in Wallacedale on Wednesday, 14 September. Original report, 15 September, 2016 The floods affecting the Australian states of Victoria and South Australia have continued, leaving dozens of homes damaged and at least 1 person missing. Flooding has been affecting areas of Victoria and South Australia since the start of the week. Further heavy rain in South Australia over the last 24 hours caused further flooding, damaging at least 80 homes and forcing over 70 families to evacuate. Australia’s Bureau of Meteorology (BoM) said that 14 September was the wettest September day on record for the Adelaide area. Earlier this wee BoM said that parts of Victoria had seen the wettest 3 day stretch in September for over 100 years."
Caution:
Floods in hilly or mountainous regions are difficult remote sensing targets and not always observable. Also, cloud cover or heavy vegetation may restrict the ability to capture peak inundation everywhere. The maps may not illustrate all areas of flooding, and cloud and terrain shadows may be misclassified and falsely mapped as flood water. Finally, due to the relatively coarse resolution of MODIS 250 m bands, some areas mapped as flooded may include smaller parcels of dry land and many small areas of flooding may not be detected and mapped.
Suggested citation:
Brakenridge, G.R., Kettner, A.J., Slayback, D., and Policelli, F., date accessed, "DFO Flood Event 4409", Dartmouth Flood Observatory, University of Colorado, Boulder, Colorado, USA, http://floodobservatory.colorado.edu/Events/2016Australia4409/2016Australia4090.html
Image Data Sources:
The Land Atmosphere Near-real-time Capability for EOS (LANCE) system provides daily NASA MODIS data at 250 m spatial resolution. Landsat 8 data, if used, are provided by the U.S. Geological Survey Hazards Data Distribution System. Landsat 8 is jointly managed by NASA and the United States Geological Survey. VIIRS data are processed to flood maps by a NOAA-supported project at George Mason University and are provided courtesy Dr. Sanmei Lei. COSMO-SkyMed synthetic aperture radar (SAR) data, when used, are provided by the Italian Space Agency (ASI) as a contribution to the CEOS Flood Pilot. Sentinel SAR data, when used, are provided by the European Space Agency. NASA EO-1 satellite tasking and data are provided by Stuart Frye and colleagues at the NASA Goddard Space Flight Center. MODIS data beginning in year 2012 are based on an automated product provided by the MODIS NRT Flood project at the NASA Goddard Space Flight Center.
GIS Data Sources:
Non-automated, MODIS-based .shp or MapInfo GIS files supporting this Flood Event Map are located in a map sheet folder here together with any other high resolution (using Landsat 8, EO-1, etc) GIS files.
Click here for access to the automated daily MODIS-derived .shp file GIS record (record commences in 2011). Choose appropriate 10 deg x 10 deg map sheet directory and appropriate dates; longitude and latitudes refer to upper left map sheet corner.
Related Data:
Global Flood Monitoring System (GFMS) displays, if provided, are from the University of Maryland. Reference: Wu, H., R. F. Adler, Y. Tian, G. J. Huffman, H. Li, and J. Wang (2014), Real-time global flood estimation using satellite-based precipitation and a coupled land surface and routing model, Water Resour. Res., 50, doi:10.1002/2013WR014710. Global Flood Awareness System (GloFAS) displays, if provided, are from the European Commission Joint Research Centre and the European Centre for Medium-Range Weather Forecasts. Reference: Alfieri, L., Burek, P., Dutra, E., Krzeminski, B., Muraro, D., Thielen, J., and Pappenberger, F.: GloFAS – global ensemble streamflow forecasting and flood early warning, Hydrol. Earth Syst. Sci., 17, 1161-1175, doi:10.5194/hess-17-1161-2013, 2013.
Support provided by:
The Disasters Program of NASA Applied Sciences to the University of Colorado. GPM and AMSR-2 satellite microwave data for River Watch specially processed first within GDACS at the Joint Research Center of the European Commission. DFO participates in the Global Flood Partnership.

(counting since November 4, 2016)