
Hydrological Drought Measured by AMSR-E
An experimental record of satellite-observed changes of surface water supply
Yellow areas show areas of reduced surface water extent in comparison to a reference, seasonally-adjusted average.
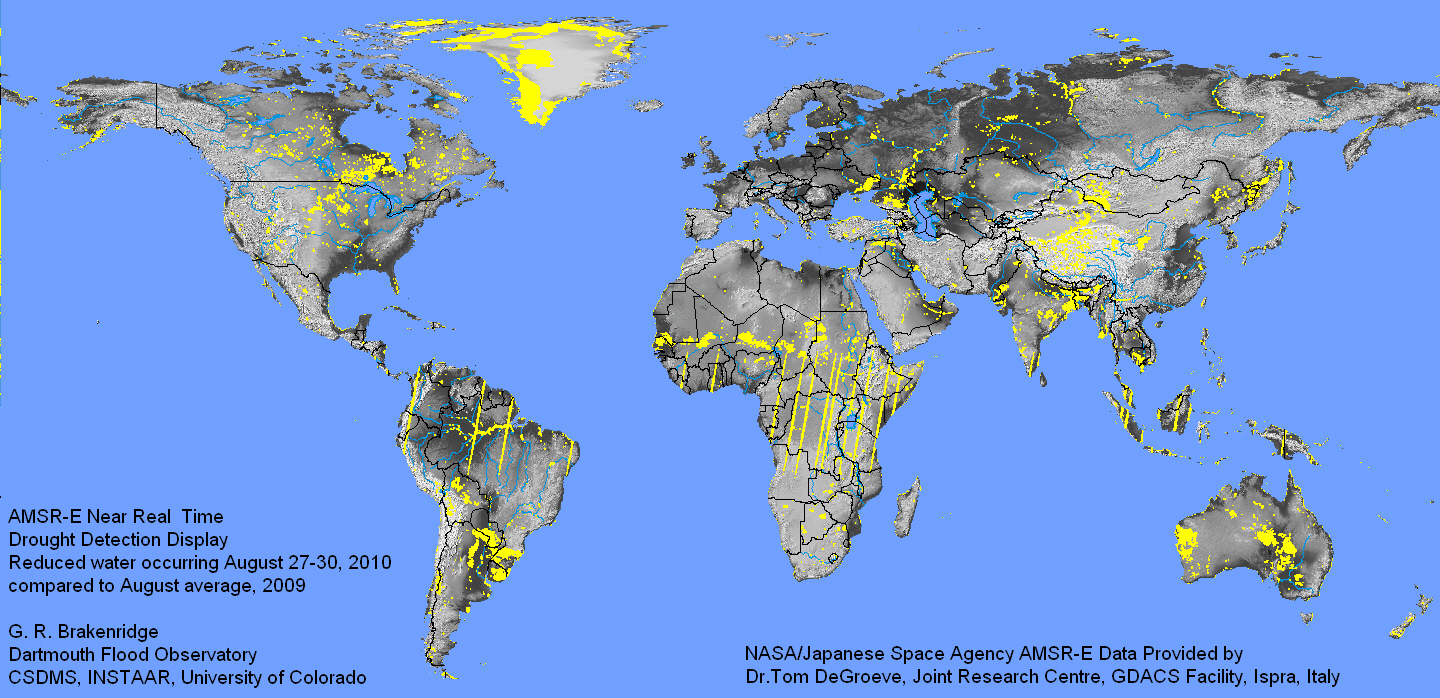
This display is experimental and under development. An technical summary will be added at this location in the near future. Drought, in yellow, is based on comparison of AMSR-E 36.5 GHz data from a current four-day average image, with that of an average for the appropriate comparison month in the prior year. Some areas of drought illustrated are known to correspond with other information; but "drought" over much of Australia, for example, is believed to reflect abo ve-average surface water conditions in 2009 rather than actual drought today.
An animated version, presented below as a Powerpoint slide, also updated daily, shows current trends toward dryer or wetter conditions.
Compare to US Drought Monitor (Updated Weekly):
