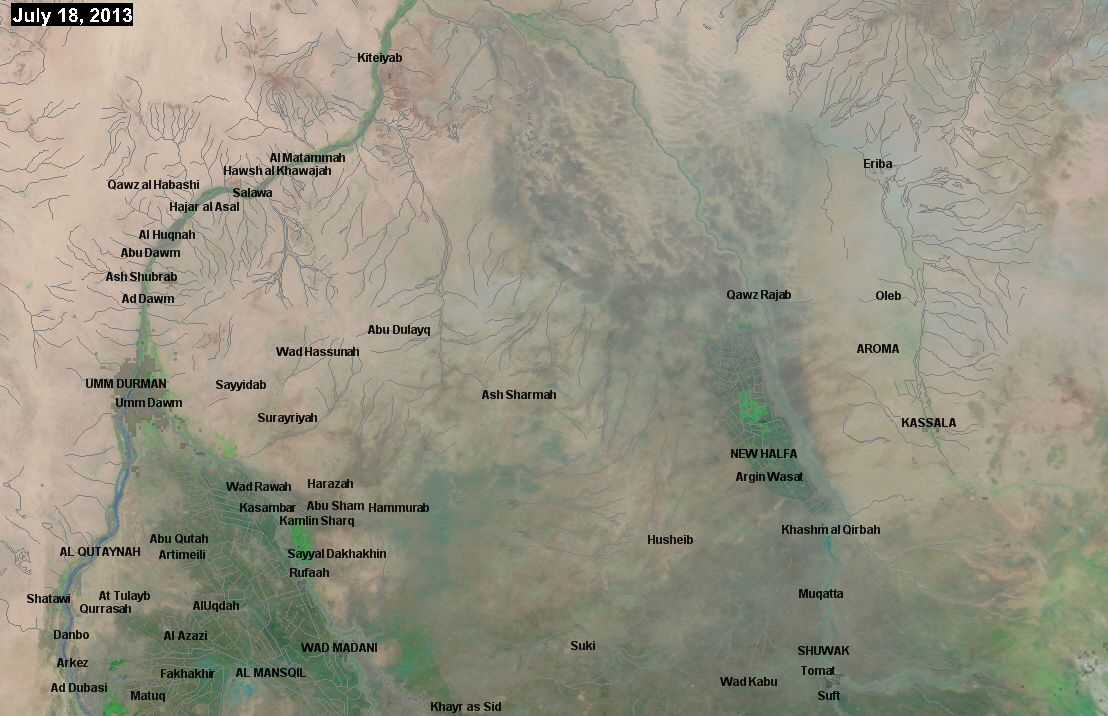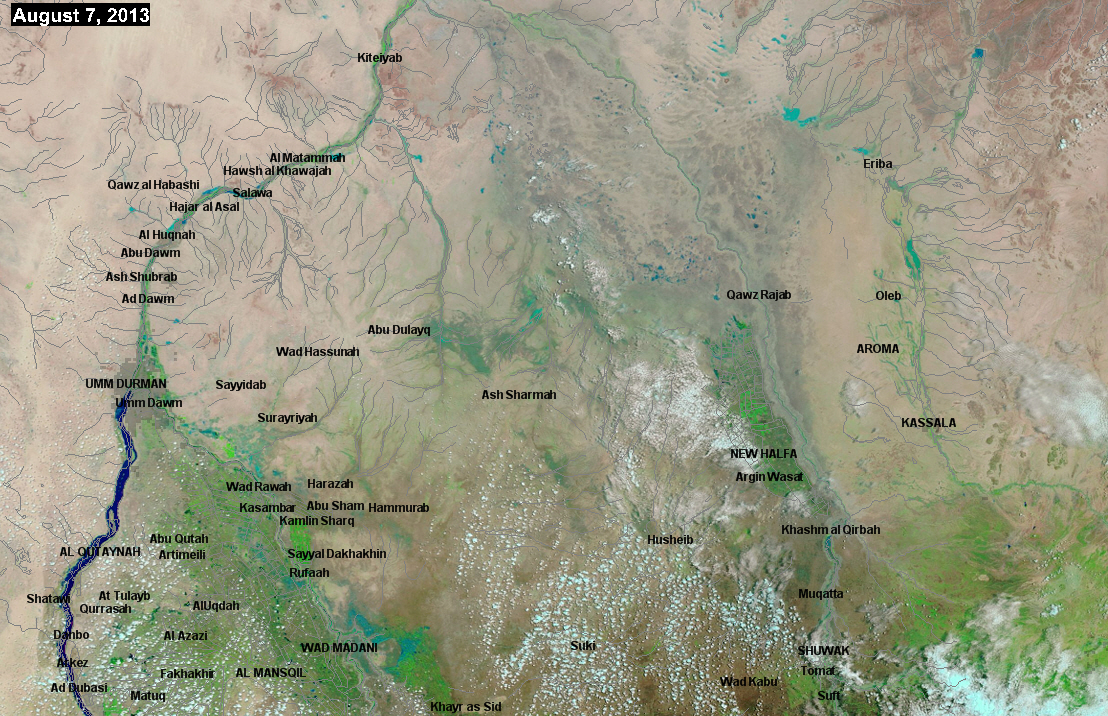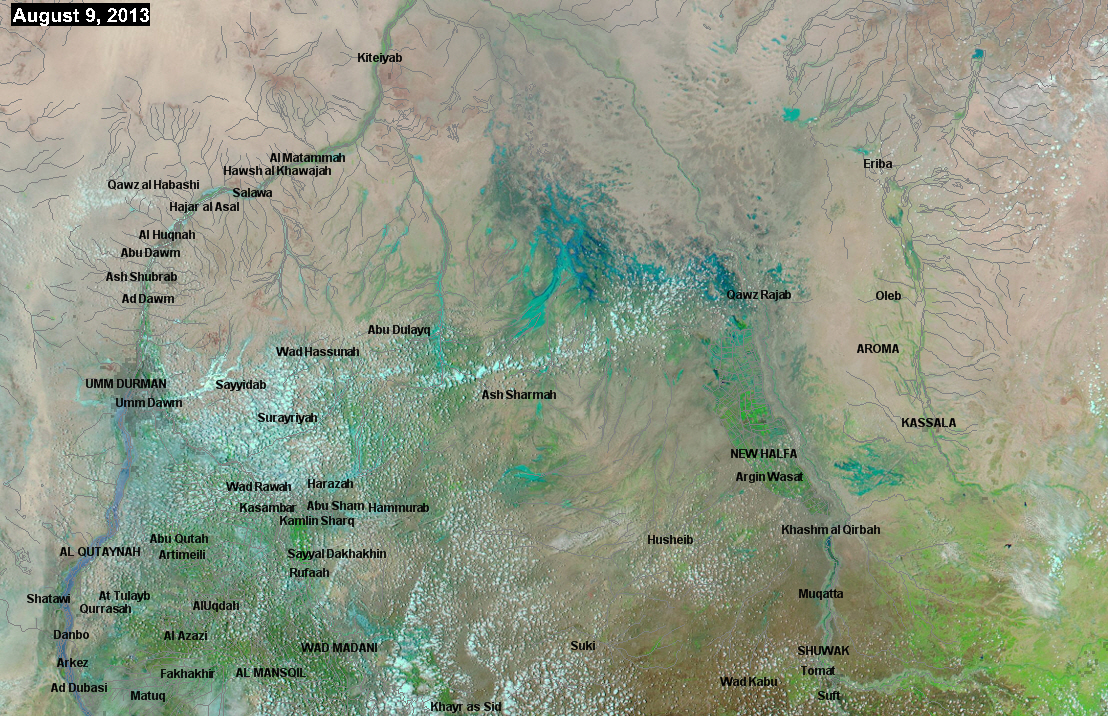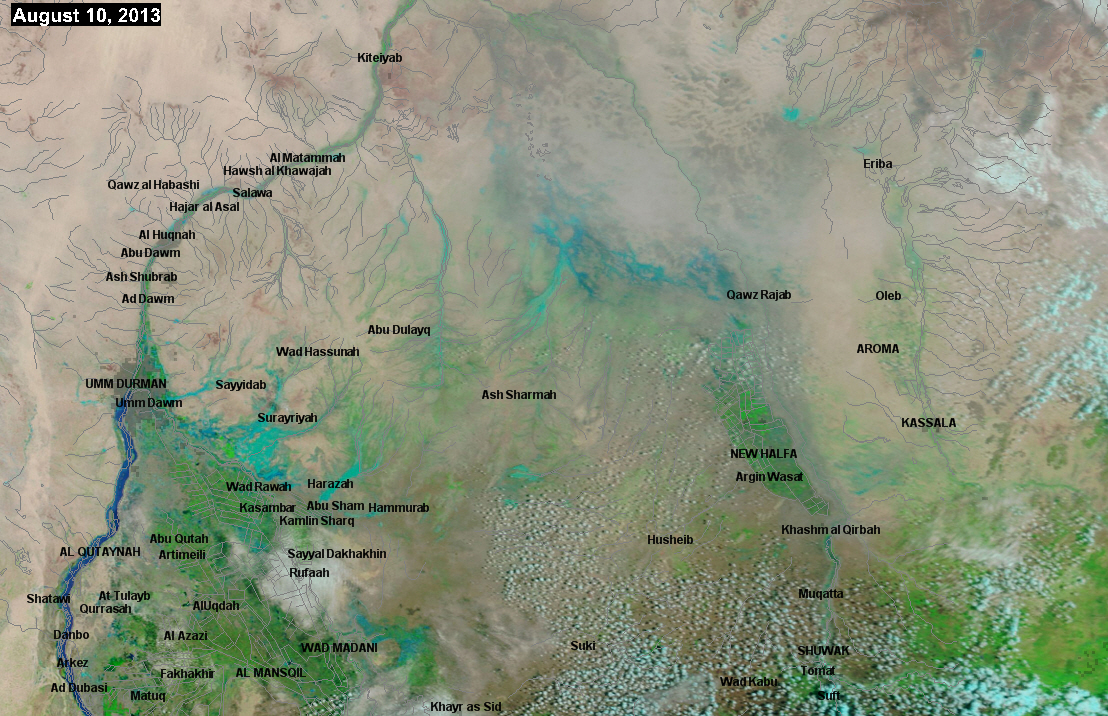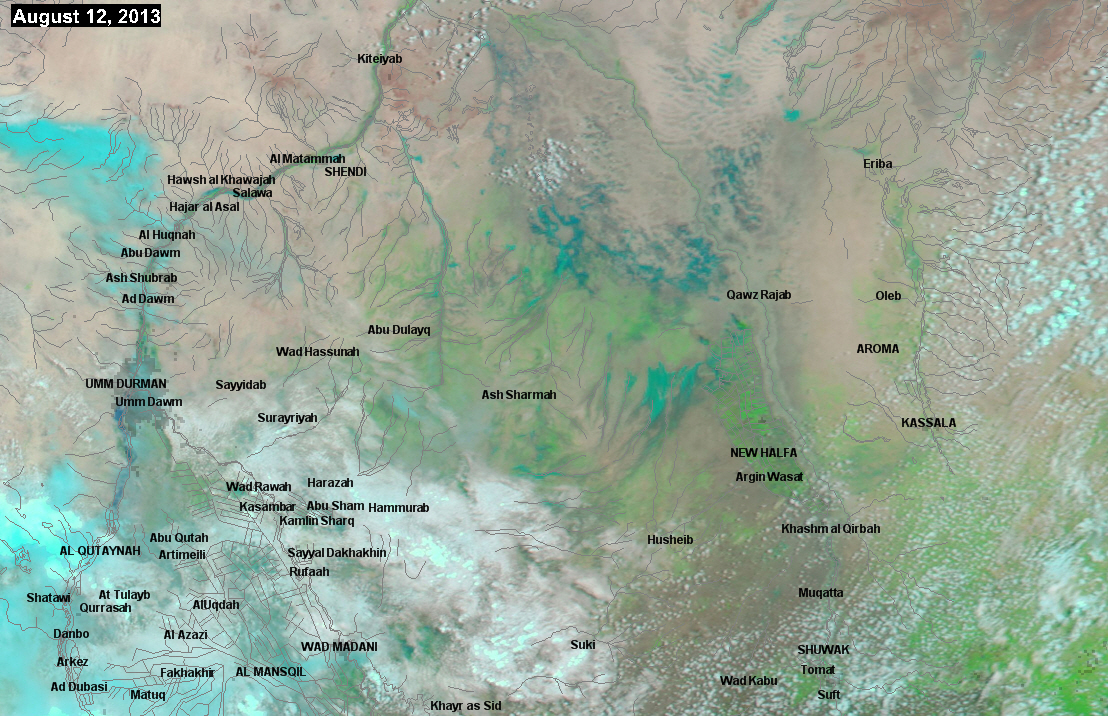

July-August 2013 Flooding in Sudan
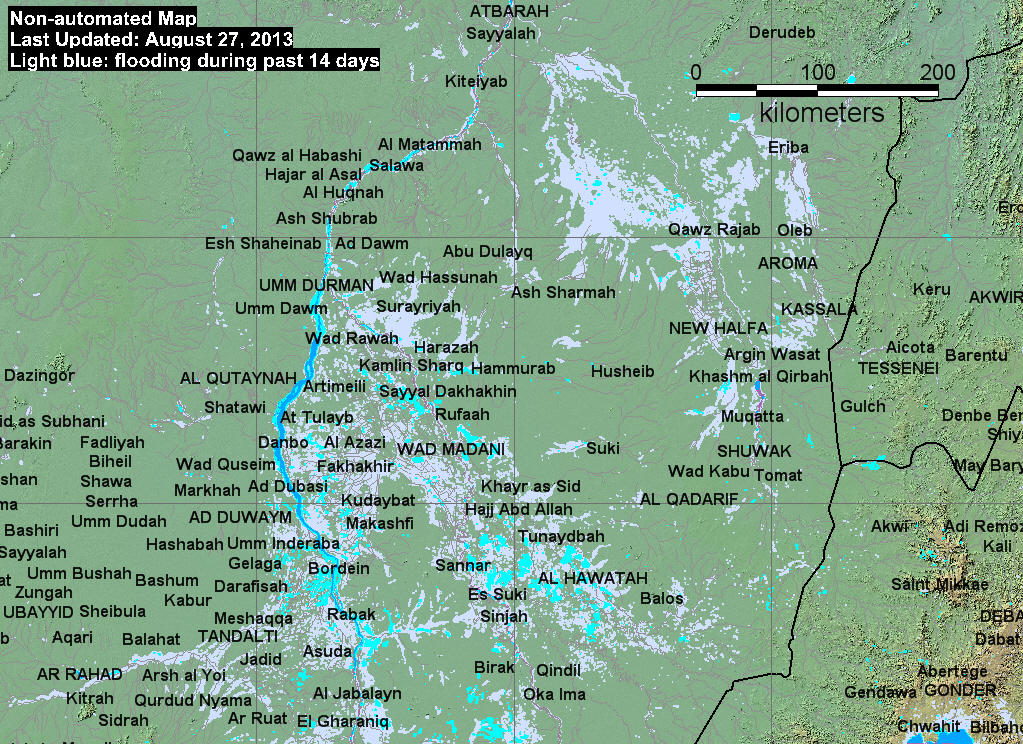
New Updates: August 27, 2013
New Updates: August 19, 2013
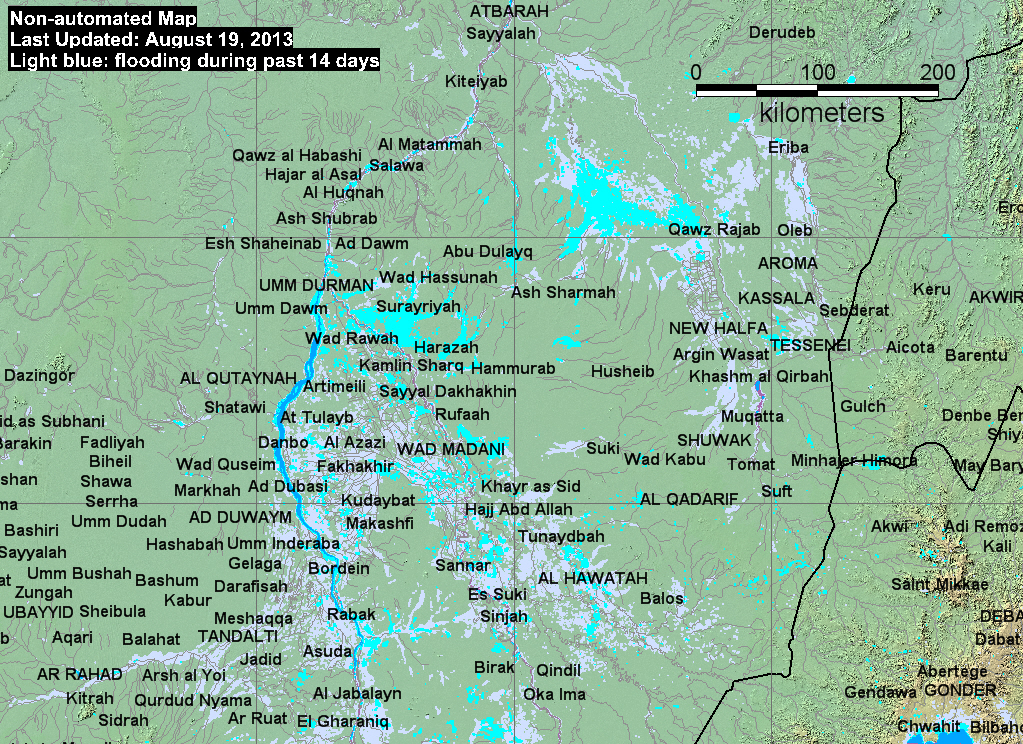
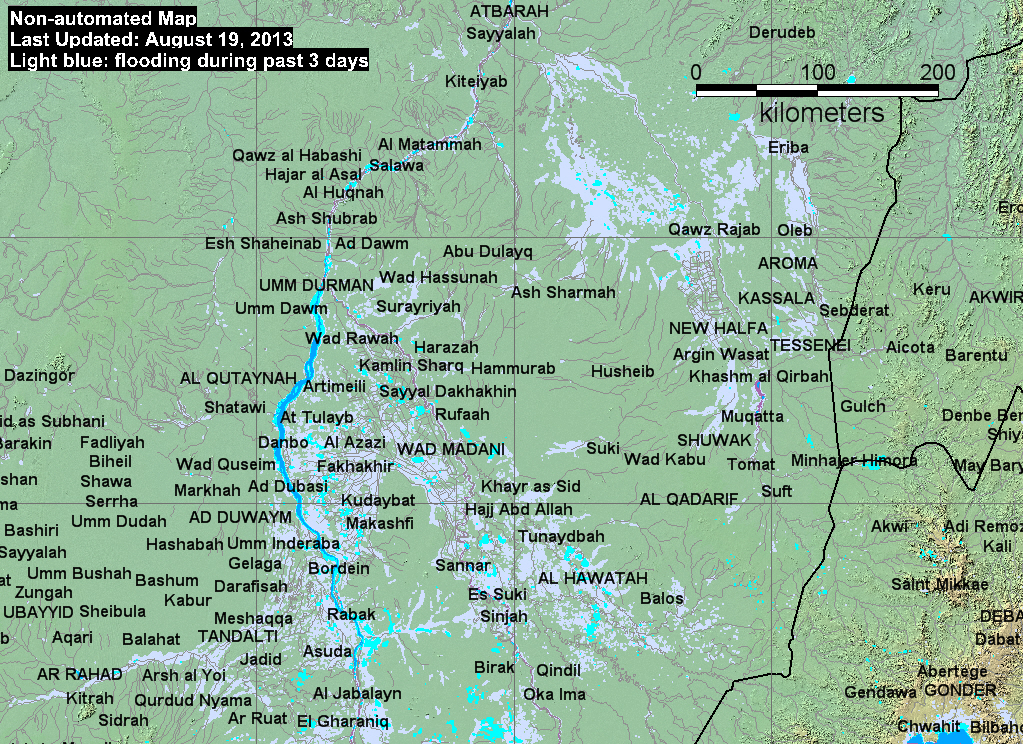
These displays were specially prepared using a different water classification method than our standard procedure, as follows:
Above displays: MODIS Terra and MODIS Aqua bands 721 images from the NASA/LANCE Rapid Response Subsets were subject to a special water classification algorithm:
(float (b3) + float (b2) + float (b1) lt 5) or (float (b3) gt 160) or (float(b1)+float(b2))/(float(b3)+float(b3)) gt .9
(Envi band math notation), where b1, b2, and b3 are from the Rapid Response Subset Geotif 721 RGB channels.
Then, for example for August 19, four images (August 18 and 19) from same subset are each classified into a binary water (0) or land (1) raster using above. The four rasters are then summed. Water values are 0, 1, or 2 in the two day sum. This removes most cloud shadow noise.
These water data are added to our standard Surface Water Record display information for this map sheet. Special processing is necessary because the standard algorithm does not detect very sediment-rich water in this terrain.
For access to the GIS data (labeled "20130819two day.shp, for example)
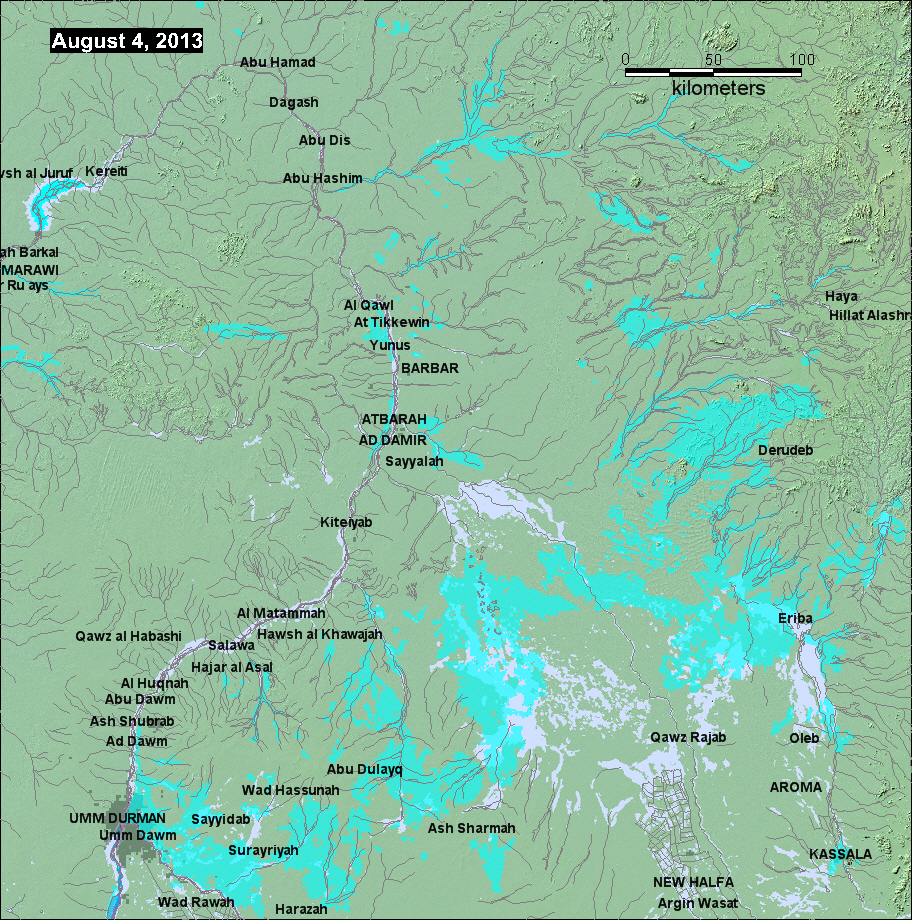
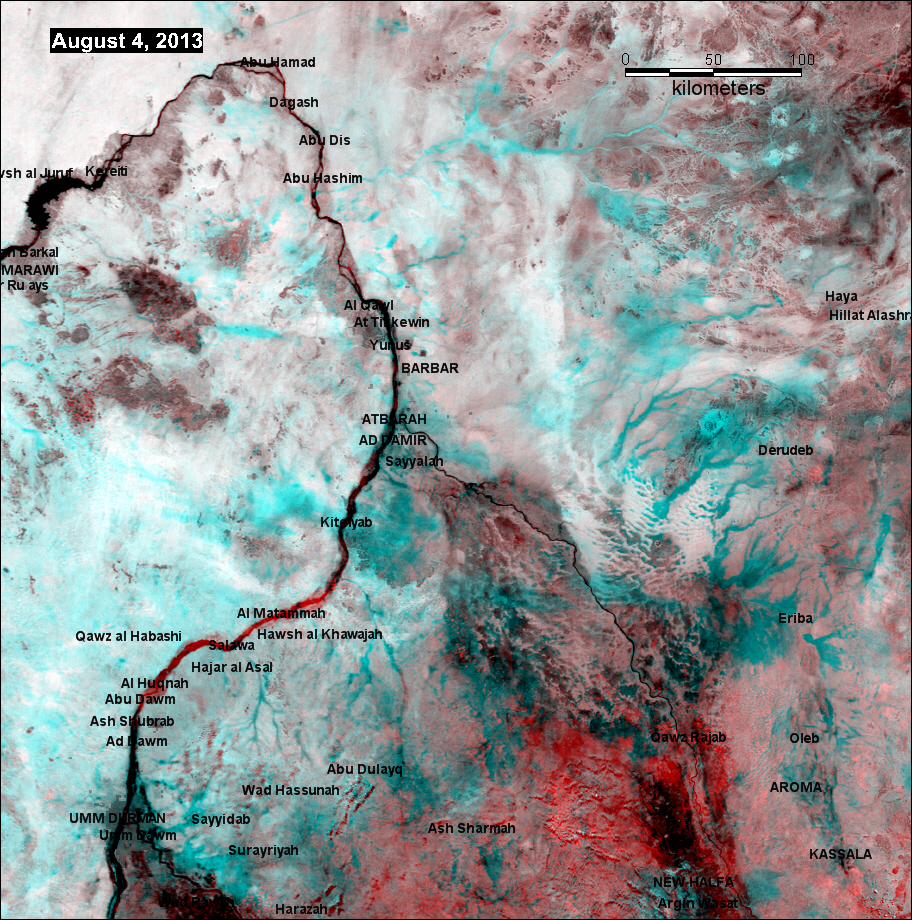
Below displays: A June 29, 2013 MODIS Terra image from the NASA/LANCE Rapid Response Subsets was compared to a Terra image from August 4, 2013.
As noted, MODIS Band 2 shows relatively little of the flooding known to be occurring, due to high suspended sediment load of the flooded areas. Thus, the automated algorithm is not detecting this flood event. Instead, Band 7 before (June 29) and during/after (August 4) were combined into a three channel color composite, saved then as a geotif and jpeg false color image (also shown below). This procedure does detect flooding, but there is some confusion with other changed values due to cloud cover and haze.
An unsupervised classifier was then applied to the color composite image, and GIS vectors were fit around changed pixels. The human operator (G. R. Brakenridge) then overlaid the GIS "inundation polygons" over the false color image and selected those that appeared very likely to be related to flood water.
In the map below, and the geotif version of the map also accessible, Bright blue is new water (flooding), Light blue-gray is all previous flooding imaged and mapped by the Flood Observatory (now dry land unless overlain by the partly transparent bright blue layer).
Notes for these products (below): 1) The false color composite is also available as geotif. 2) Some bright blue areas may be "false positives", land area that was not flooded, or at least not continuously flooded. Thus, examination of the lands around Khartoum show that the August 4 Band 7 channel suggests very extensive flooding, whereas, due to the coarse spatial resolution of Band 7 (500 m) many "flood" pixels are likely to be, in urban areas, actually mixed new water/land pixels. 3) A reservoir in the NW portion of the map and image is not in flood but instead is detected as "new water" on the base Surface Water Record display because it was newly built after the date of the reference water used in that display.4) The large area of "flooding" shown northeast of the dune field in the image and map lower right quadrant is not as large as mapped; cloud shadow in this case caused a major false positive which could not easily be removed by manual editing of the GIS file. 5) Some areas of flooding, such as around Kassala in SE corner of map, are clearly visible in the false color composite image as experiencing flooding at a smaller spatial scale, whereas the classifier grouped these areas into larger map inundation polygons (outlines).
Use the below maps with caution, as the mapping method is experimental and there are errors.. If using GIS software, use the geotif versions of both map and image, and refer to the image as the most-reliable product. In any case, the false color composite of MODIS Band 7 information does demonstrate the sensitivity and power of this technique when applied to short-lived flooding in this dry, mainly low relief region.
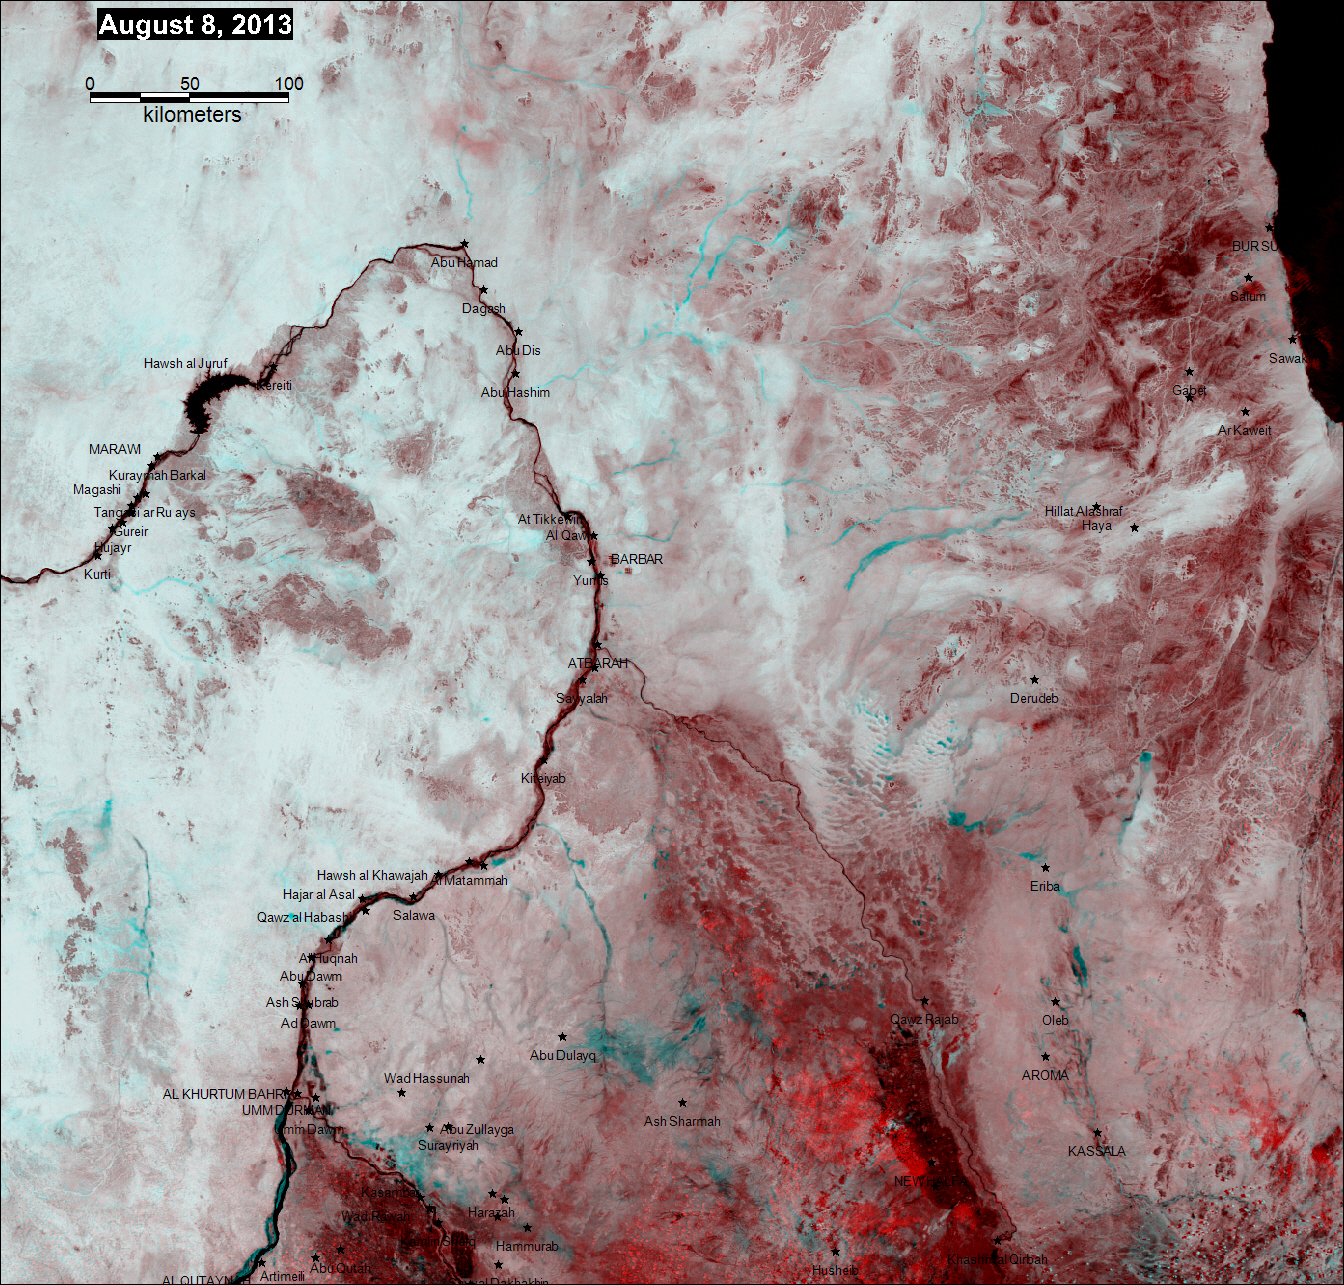
The following updated image, below, is a false color composite using only the band 7 image from MODIS (August 8, 2013 on one RGB channel and June 19, 2013 on the others). Bright blue is flood water on August 8. A Geotif version of this image file is also available. We have not yet performed a classification of the change-detection image product to water versus land.
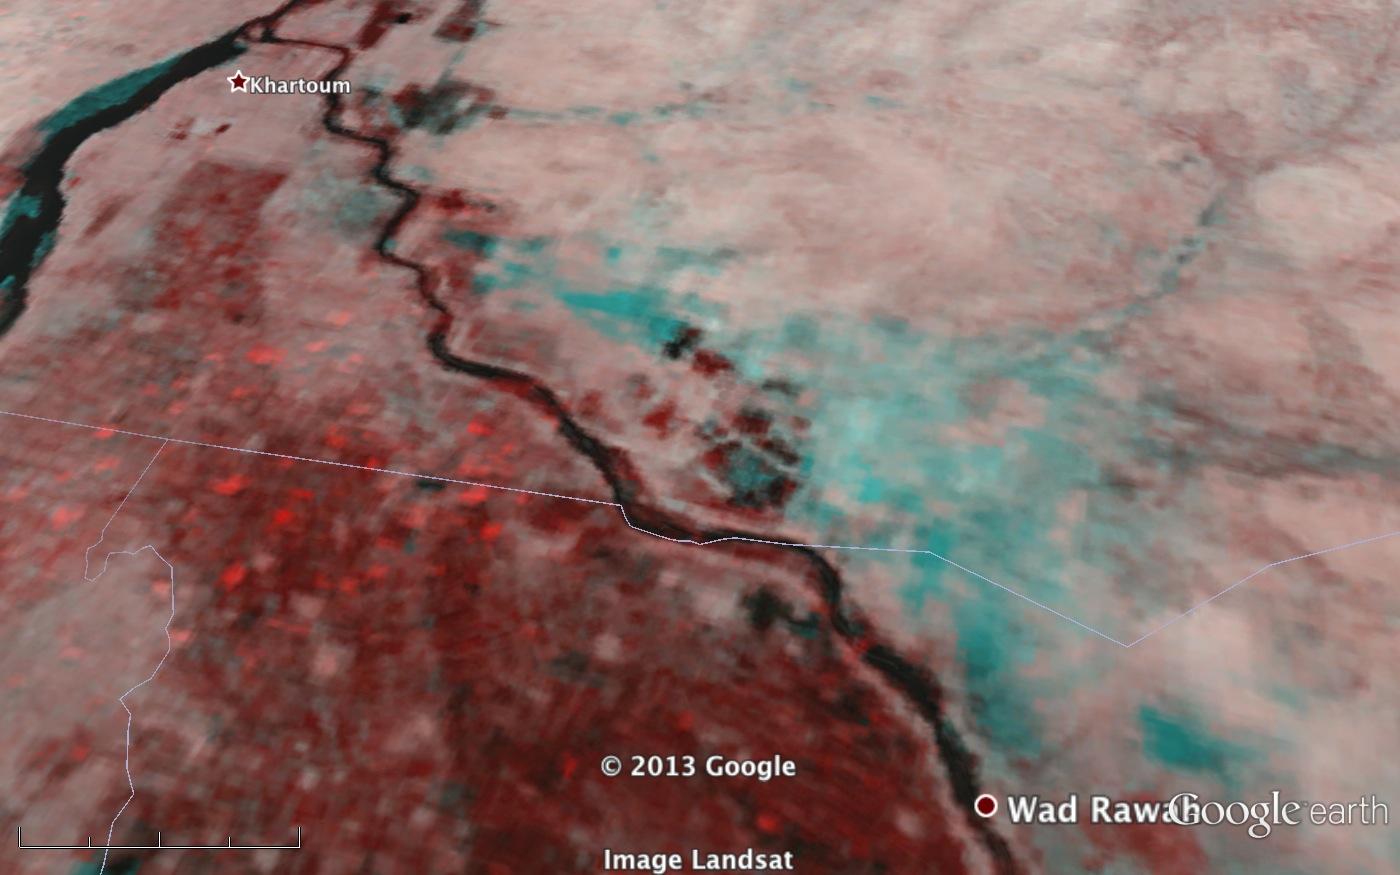
Detailed view using GoogleEarth
Time Series of MODIS/LANCE Rapid Response Subset Images
