

River Watch Version 2
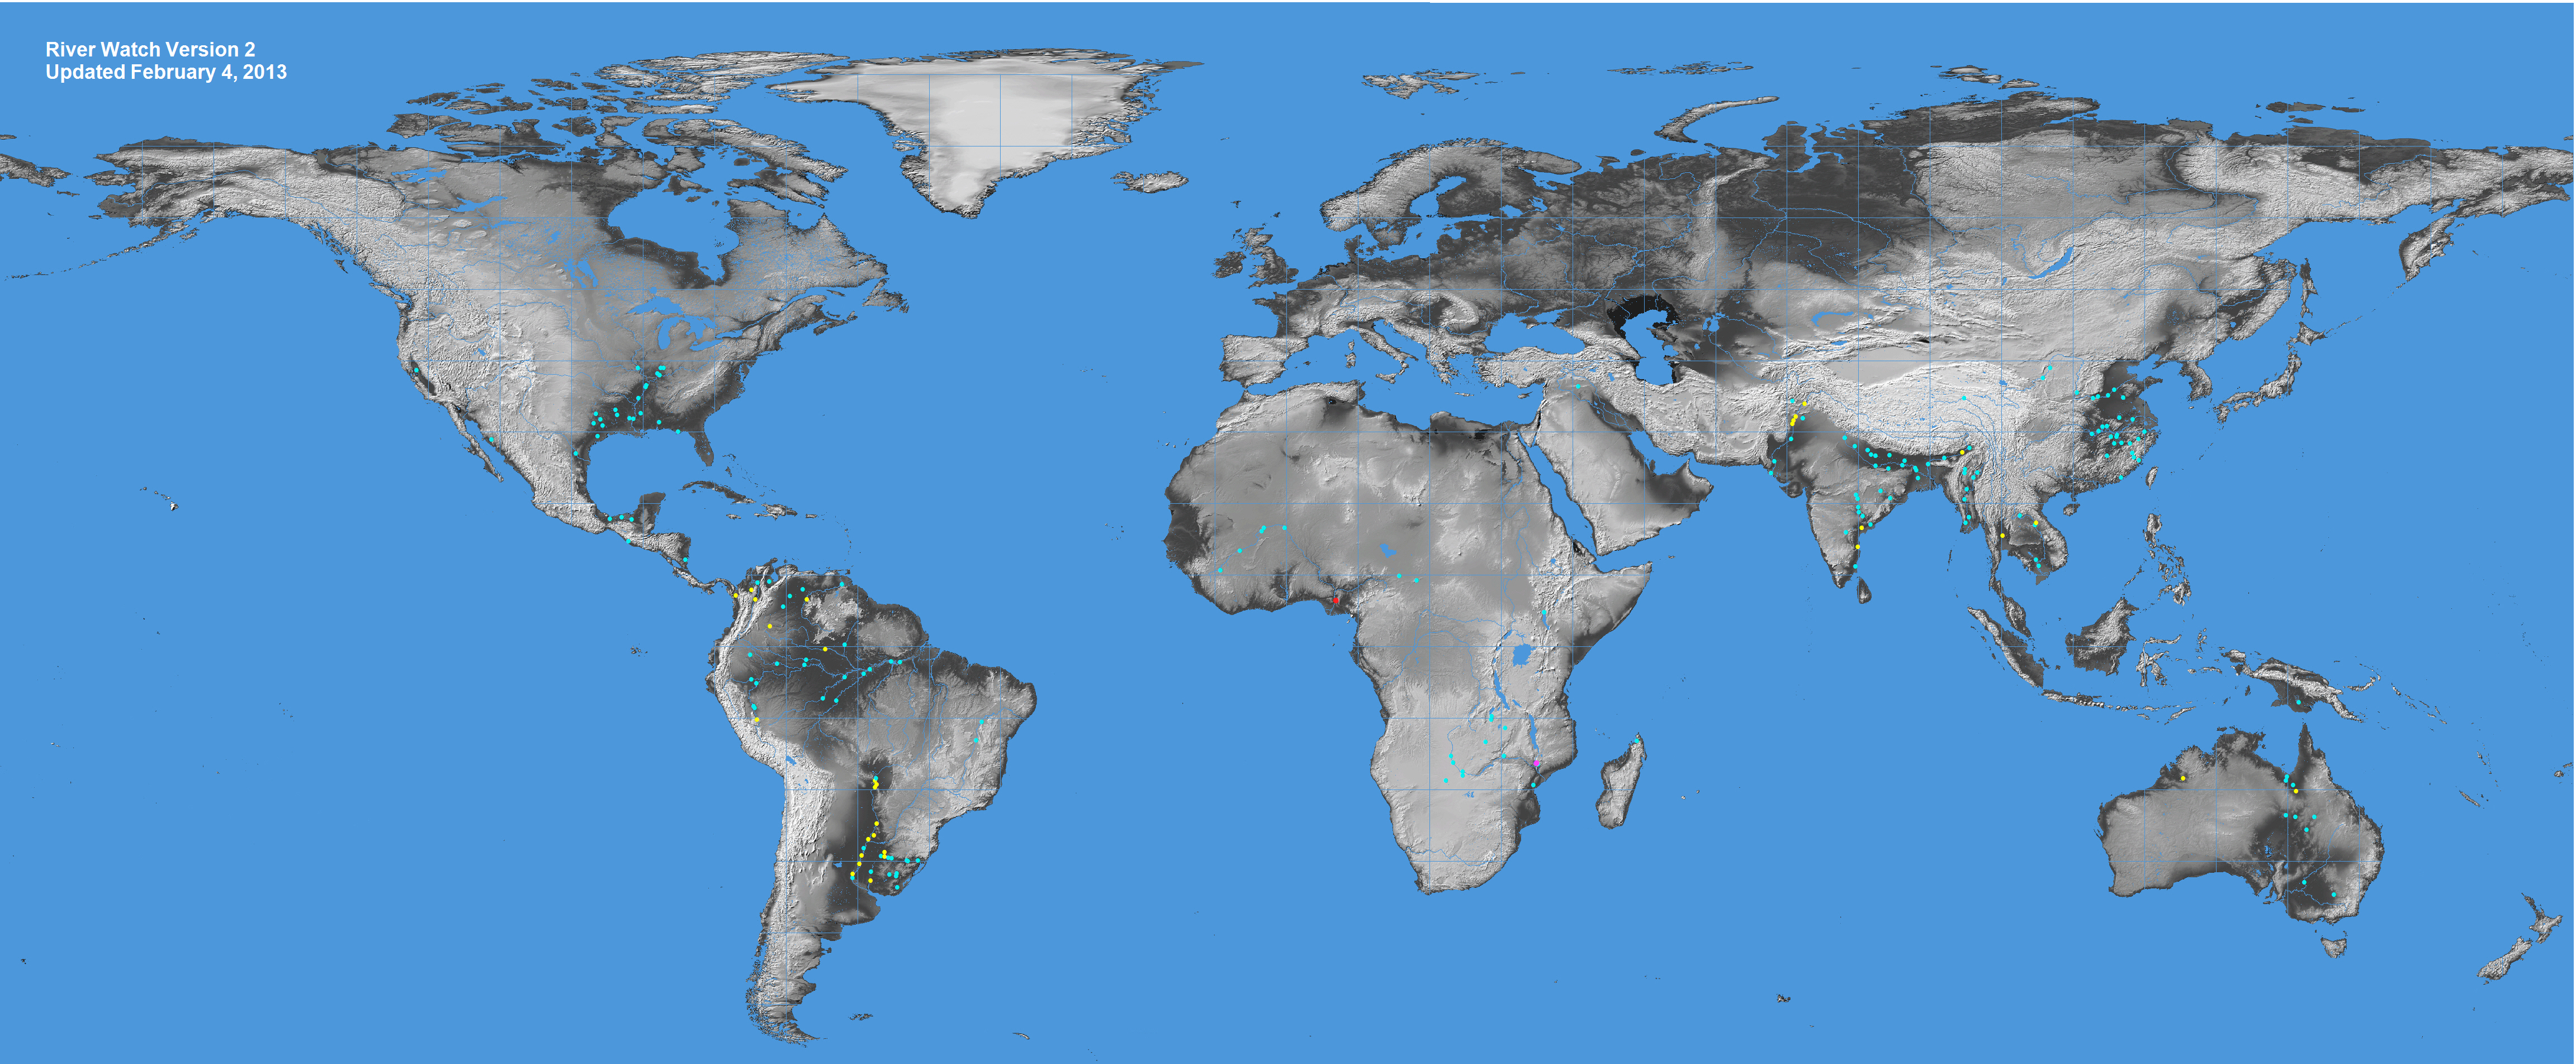
Satellite River Discharge Measurements (clickable dots)
Yellow dots: low flow (<50 % mean daily runoff for this date); Blue dots: normal flow; Purple dots: moderate flooding (>1.33 yr recurrence); Red, major flooding (> 5 yr recurrence).
Period of record for most sites begin January 1, 1998. The Log Pearson III distribution is used for recurrence interval calculation, 2002-2011.
