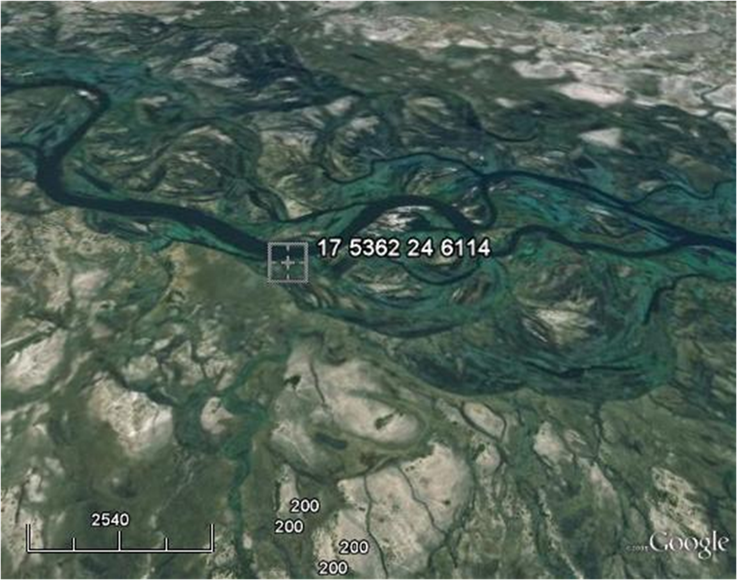
| Site ID: |
|
|
71 |
|
|
|
|
Lat. |
-17.5362 |
|
Zambia |
|
|
Western |
|
|
|
|
|
|
| River: |
|
|
Zambezi |
|
|
|
|
Long. |
24.6114 |
|
|
|
|
|
|
|
|
|
|
|
| Site name: |
|
Sesheke |
|
|
|
Contributing
area: |
338827 |
km2 |
Ratio to Comparison
Station: |
8.92 |
|
|
|
|
|
|
| Latest measurement: |
31-Aug-11 |
|
|
|
Mean annual
runoff: |
41 |
mm |
(2003-2009) |
|
|
|
|
|
|
|
|
| Hydrologic status: |
|
2 |
Normal flow |
Total runoff
this year (2010): |
59.6 |
mm |
|
|
|
|
|
|
|
|
|
|
| Latest M/C ratio: |
|
1.17 |
|
|
|
Seven day
total: |
0.5 |
mm |
|
|
|
|
|
|
|
|
|
|
| Estimated current discharge: |
257 |
m3/sec |
|
Percent of
mean 7-day total: |
111.5 |
% |
(today's value compared to
mean for same period, 2003-2009) |
|
|
|
|
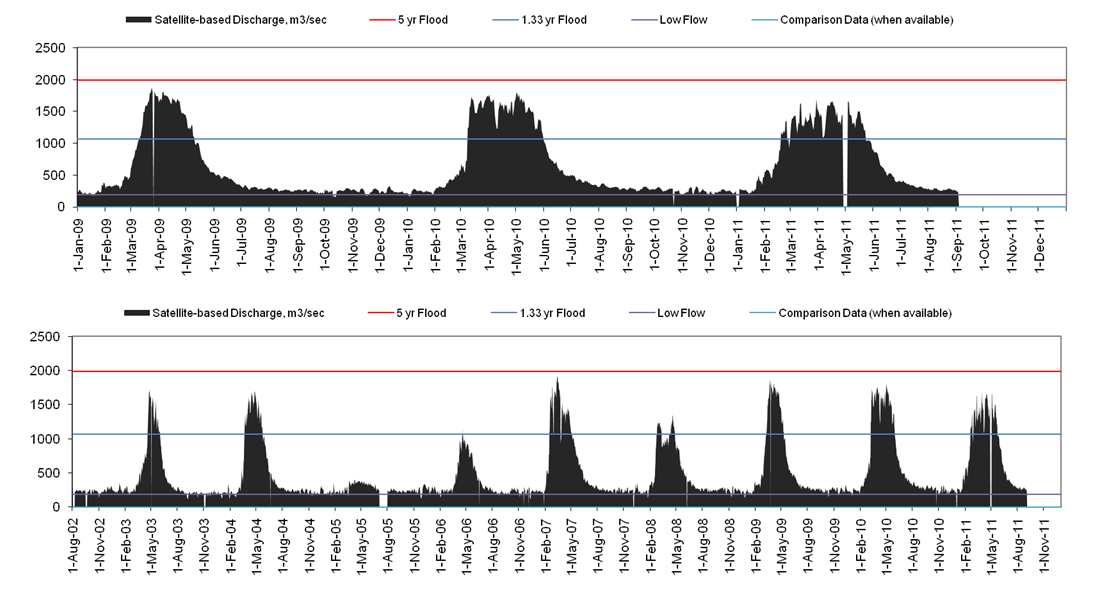
| Ice-cover determination: |
|
|
5 yr
recurrence flood: |
1990 |
m3/sec |
(from Log Pearson III analysis) |
|
|
|
|
|
|
|
| Status Codes: 1 = Low
flow or ice, 2 = Normal flow, 3 = Flood, 4 = Major Flood |
|
1829 |
m3/sec |
(from Gumbel Extreme Value analysis) |
|
|
|
|
|
|
| Comparison Station Information: |
Kamativi
G/w (1491200) |
|
|
|
|
Contributing
Area: |
|
sq mi |
37973 |
sq km |
|
|
|
|
| (Data from this gaging station are used for the calibration to
discharge, with an adjustment for different contributing areas) |
|
|
|
|
|
|
|
|
|
| Notes: |
|
Calibration to nearby ground
station has been accomplished. |
|
Accuracy Estimate: Poor. Comparison basin is much smaller. |
|
|
|
|
|
|
| Discharge and runoff, based on satellite remote sensing (NASA
AMSR-E data) |
|
|
|
|
|
|
|
|
|
|
|
|
|
| (For U.S, sites, nearby ground station discharge may also be
shown) |
|
|
|
|
|
|
|
|
|
|
|
|
|
|
|
|
|
|
|
|
|
|
|
|
|
|
|
|
|
|
|
|
|
|
|
|
|
|
|
|
|
|
|
|
|
|
|
|
|
|
|
|
|
|
|
|
|
|
|
|
|
|
|
|
|
|
|
|
|
|
|
|
|
|
|
|
|
|
|
|
|
|
|
|
|
|
|
|
|
|
|
|
|
|
|
|
|
|
|
|
|
|
|
|
|
|
|
|
|
|
|
|
|
|
|
|
|
|
|
|
|
|
|
|
|
|
|
|
|
|
|
|
|
|
|
|
|
|
|
|
|
|
|
|
|
|
|
|
|
|
|
|
|
|
|
|
|
|
|
|
|
|
|
|
|
|
|
|
|
|
|
|
|
|
|
|
|
|
|
|
|
|
|
|
|
|
|
|
|
|
|
|
|
|
|
|
|
|
|
|
|
|
|
|
|
|
|
|
|
|
|
|
|
|
|
|
|
|
|
|
|
|
|
|
|
|
|
|
|
|
|
|
|
|
|
|
|
|
|
|
|
|
|
|
|
|
|
|
|
|
|
|
|
|
|
|
|
|
|
|
|
|
|
|
|
|
|
|
|
|
|
|
|
|
|
|
|
|
|
|
|
|
|
|
|
|
|
|
|
|
|
|
|
|
|
|
|
|
|
|
|
|
|
|
|
|
|
|
|
|
|
|
|
|
|
|
|
|
|
|
|
|
|
|
|
|
|
|
|
|
|
|
|
|
|
|
|
|
|
|
|
|
|
|
|
|
|
|
|
|
|
|
|
|
|
|
|
|
|
|
|
|
|
|
|
|
|
|
|
|
|
|
|
|
|
|
|
|
|
|
|
|
|
|
|
|
|
|
|
|
|
|
|
|
|
|
|
|
|
|
|
|
|
|
|
|
|
|
|
|
|
|
|
|
|
|
|
|
|
|
|
|
|
|
|
|
|
|
|
|
|
|
|
|
|
|
|
|
|
|
|
|
|
|
|
|
|
|
|
|
|
|
|
|
|
|
|
|
|
|
|
|
|
|
|
|
|
|
|
|
|
|
|
|
|
|
|
|
|
|
|
|
|
|
|
|
|
|
|
|
|
|
|
|
|
|
|
|
|
|
|
|
|
|
|
|
|
|
|
|
|
|
|
|
|
|
|
|
|
|
|
|
|
|
|
|
|
|
|
|
|
|
|
|
|
|
|
|
|
|
|
|
|
|
|
|
|
|
|
|
|
|
|
|
|
|
|
|
|
|
|
|
|
|
|
|
|
|
|
|
|
|
|
|
|
|
|
|
|
|
|
|
|
|
|
|
|
|
|
|
|
|
|
|
|
|
|
|
|
|
|
|
|
|
|
|
|
|
|
|
|
|
|
|
|
|
|
|
|
|
|
|
|
|
|
|
|
|
|
|
|
|
|
|
|
|
|
|
|
|
|
|
|
|
|
|
|
|
|
|
|
|
|
|
|
|
|
|
|
|
|
|
|
|
|
|
|
|
|
|
|
|
|
|
|
|
|
|
|
|
|
|
|
|
|
|
|
|
|
|
|
|
|
|
|
|
|
|
|
|
|
|
|
|
|
|
|
|
|
|
|
|
|
|
|
|
|
|
|
|
|
|
|
|
|
|
|
|
|
|
|
|
|
|
|
|
|
|
|
|
|
|
|
|
|
|
|
|
|
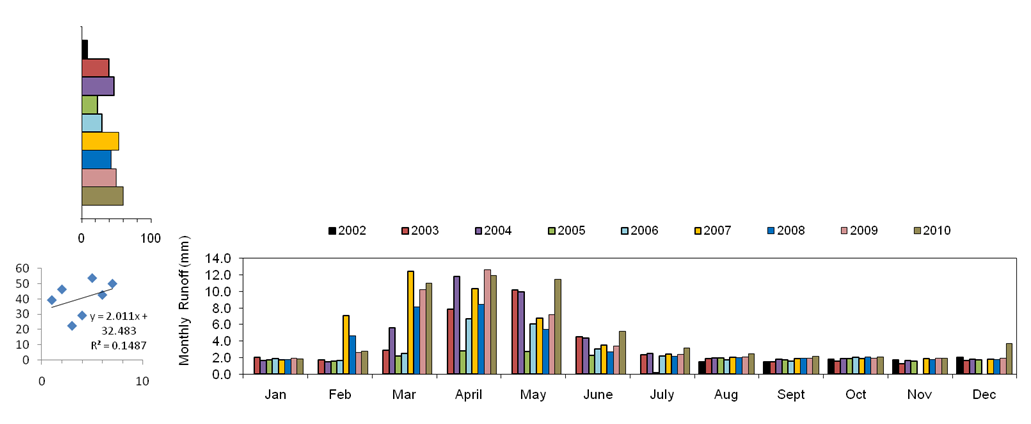
| Annual |
|
|
|
Monthly Total Runoff (mm),
computed from above satellite-based discharge data |
|
|
|
|
|
|
|
|
|
|
|
|
|
|
|
|
|
|
|
|
|
|
|
|
|
|
|
|
|
| (mm) |
|
|
|
Jan |
Feb |
Mar |
April |
May |
June |
July |
Aug |
Sept |
Oct |
Nov |
Dec |
|
|
|
|
|
| 9 |
|
|
2002 |
no data |
no data |
no data |
no data |
no data |
no data |
no data |
1.5 |
1.5 |
1.8 |
1.7 |
2.0 |
|
|
|
|
|
| 39 |
|
|
2003 |
2.0 |
1.7 |
2.9 |
7.9 |
10.2 |
4.5 |
2.3 |
1.9 |
1.5 |
1.6 |
1.3 |
1.6 |
|
|
|
|
|
| 46 |
|
|
2004 |
1.6 |
1.5 |
5.6 |
11.8 |
9.9 |
4.3 |
2.5 |
2.0 |
1.8 |
1.9 |
1.6 |
1.8 |
|
|
|
|
|
| 22 |
|
|
2005 |
1.7 |
1.6 |
2.2 |
2.8 |
2.7 |
2.3 |
0.2 |
1.9 |
1.7 |
1.9 |
1.6 |
1.7 |
|
|
|
|
|
| 29 |
|
|
2006 |
1.9 |
1.6 |
2.5 |
6.7 |
6.1 |
3.0 |
2.2 |
1.7 |
1.6 |
2.0 |
0.0 |
0.0 |
|
|
|
|
|
| 54 |
|
|
2007 |
1.7 |
7.0 |
12.4 |
10.3 |
6.8 |
3.5 |
2.4 |
2.0 |
1.8 |
1.9 |
1.8 |
1.8 |
|
|
|
|
|
| 43 |
|
|
2008 |
1.8 |
4.6 |
8.1 |
8.4 |
5.4 |
2.7 |
2.2 |
2.0 |
1.9 |
2.1 |
1.8 |
1.7 |
|
|
|
|
|
| 50 |
|
|
2009 |
1.9 |
2.6 |
10.3 |
12.6 |
7.2 |
3.4 |
2.4 |
2.1 |
1.9 |
1.9 |
1.9 |
1.9 |
|
|
|
|
|
| 60 |
|
|
2010 |
1.9 |
2.7 |
11.0 |
11.9 |
11.4 |
5.2 |
3.2 |
2.5 |
2.2 |
2.0 |
1.9 |
3.7 |
|
|
|
|
|
|
|
|
|
|
|
|
|
|
|
|
|
|
|
|
|
|
|
|
|
|
|
|
|
|
|
|
|
|
|
|
|
|
|
|
|
|
|
|
|
|
|
|
|
|
|
|
|
|
|
|
|
|
|
|
|
|
|
|
|
|
|
|
|
|
|
|
|
|
|
|
|
|
|
|
|
|
|
|
|
|
|
|
|
|
|
|
|
|
|
|
|
|
|
|
|
|
|
|
|
|
|
|
|
|
|
|
|
|
|
|
|
|
|
|
|
|
|
|
|
|
|
|
|
|
|
|
|
|
|
|
|
|
|
|
|
|
|
|
|
|
|
|
|
|
|
|
|
|
|
|
|
|
|
|
|
|
|
|
|
|
|
|
|
|
|
|
|
|
|
|
|
|
|
|
|
|
|
|
|
|
|
|
|
|
|
|
|
|
|
|
|
|
|
|
|
|
|
|
|
|
|
|
|
|
|
|
|
|
|
|
|
|
|
|
|
|
|
|
|
|
|
|
|
|
|
|
|
|
|
|
|
|
|
|
|
|
|
|
|
|
|
|
|
|
|
|
|
|
|
|
|
|
|
|
|
|
|
|
|
|
|
|
|
|
|
|
|
|
|
|
|
|
|
Mean Annual Runoff (mm): |
41 |
|
Standard Deviation: |
11.3 |
|
|
|
|
|
|
|
|
|
|
|
|
|
Trend in Annual Runoff
(slope): |
2 |
|
|
|
|
|
|
|
|
|
|
|
|
|
|
|
|
|
|
|
|
|
|
|
|
|
|
|
|
|
|
|
|
|
|
|
|
|
| Discharge is estimated via a rating equation directly from
the remote sensing data (M/C ratio) shown below. |
|
|
|
|
|
|
|
|
|
|
|
|
|
|
|
|
|
|
|
|
|
|
|
|
|
|
|
|
|
|
|
|
|
|
|
|
|
|
|
|
|
|
|
|
|
|
|
|
|
|
|
|
|
|
|
|
|
|
|
|
|
|
|
|
|
|
|
|
|
|
|
|
|
|
|
|
|
|
|
|
|
|
|
|
|
|
|
|
|
|
|
|
|
|
|
|
|
|
|
|
|
|
|
|
|
|
|
|
|
|
|
|
|
|
|
|
|
|
|
|
|
|
|
|
|
|
|
|
|
|
|
|
|
|
|
|
|
|
|
|
|
|
|
|
|
|
|
|
|
|
|
|
|
|
|
|
|
|
|
|
|
|
|
|
|
|
|
|
|
|
|
|
|
|
|
|
|
|
|
|
|
|
|
|
|
|
|
|
|
|
|
|
|
|
|
|
|
|
|
|
|
|
|
|
|
|
|
|
|
|
|
|
|
|
|
|
|
|
|
|
|
|
|
|
|
|
|
|
|
|
|
|
|
|
|
|
|
|
|
|
|
|
|
|
|
|
|
|
|
|
|
|
|
|
|
|
|
|
|
|
|
|
|
|
|
|
|
|
|
|
|
|
|
|
|
|
|
|
|
|
|
|
|
|
|
|
|
|
|
|
|
|
|
|
|
|
|
|
|
|
|
|
|
|
|
|
|
|
|
|
|
|
|
|
|
|
|
|
|
|
|
|
|
|
|
|
|
|
|
|
|
|
|
|
|
|
|
|
|
|
|
|
|
|
|
|
|
|
|
|
|
|
|
|
|
|
|
|
|
|
|
|
|
|
|
|
|
|
|
|
|
|
|
|
|
|
|
|
|
|
|
|
|
|
|
|
|
|
|
|
|
|
|
|
|
|
|
|
|
|
|
|
|
|
|
|
|
|
|
|
|
|
|
|
|
|
|
|
|
|
|
|
|
|
|
|
|
|
|
|
|
|
|
|
|
|
|
|
|
|
|
|
|
|
|
|
|
|
|
|
|
|
|
|
|
|
|
|
|
|
|
|
|
|
|
|
|
|
|
|
|
|
|
|
|
|
|
|
|
|
|
|
|
|
|
|
|
|
|
|
|
|
|
|
|
|
|
|
|
|
|
|
|
|
|
|
|
|
|
|
|
|
|
|
|
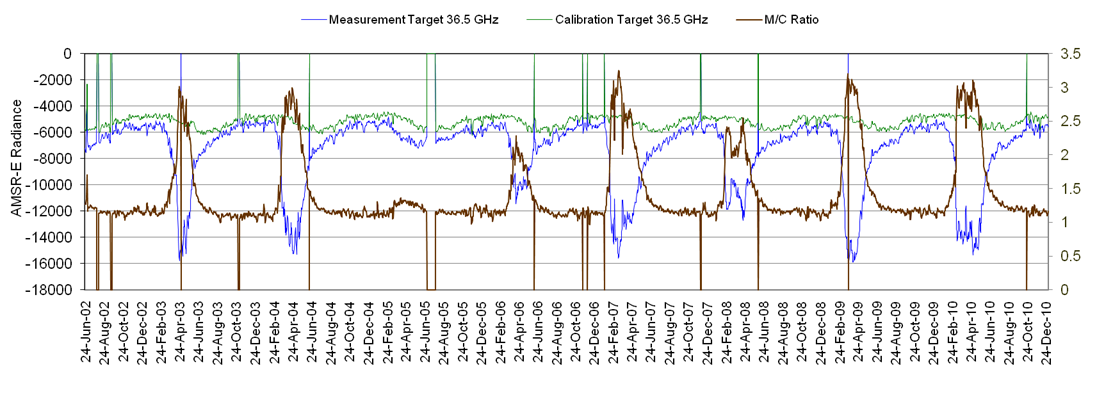
Explanation: |
Green line records upwelling
microwave emission from within 5 km radius of a calbration land target; blue
line is emission from within 5 km radious of the measurement target centered
over the river. |
|
|
|
Brown line is their ratio
(M/C; scale on right) and is used to estimate river discharge via a rating
equation. |
|
|
|
|
|
|
|
|
|
|
|
|
|
|
|
|
|
|
|
|
|
|
|
|
|
|
|
|
|
|
|
|
|
|
|
|
|
|
|
|
|
|
|
|
|
|
|
|
|
|
|
|
|
|
|
|
|
|
|
|
|
|
|
|
|
|
|
|
|
|
|
| GoogleEarth View of Measurement Site |
|
|
|
|
|
|
|
|
|
|
|
|
|
|
|
|
|
|
|
|
|
|
|
|
|
|
| Return |
|
|
|
|
|
|
|
|
|
|
|
|
|
|
|
|
|
|
|
|
|
|
|
|
|
|
|
|
|
|
|
|
|
|
|
|
|
|
|
|
|
|
|
|
|
|
|
|
|
|
|
|
|
|
|
|
|
|
|
|
|
|
|
|
|
|
|
|
|
|
|
|
|
|
|
|
|
|
|
|
|
|
|
|
|
|
|
|
|
|
|
|
|
|
|
|
|
|
|
|
|
|
|
|
|
|
|
|
|
|
|
|
|
|
|
|
|
|
|
|
|
|
|
|
|
|
|
|
|
|
|
|
|
|
|
|
|
|
|
|
|
|
|
|
|
|
|
|
|
|
|
|
|
|
|
|
|
|
|
|
|
|
|
|
|
|
|
|
|
|
|
|
|
|
|
|
|
|
|
|
|
|
|
|
|
|
|
|
|
|
|
|
|
|
|
|
|
|
|
|
|
|
|
|
|
|
|
|
|
|
|
|
|
|
|
|
|
|
|
|
|
|
|
|
|
|
|
|
|
|
|
|
|
|
|
|
|
|
|
|
|
|
|
|
|
|
|
| Estimated |
|
|
|
|
|
|
| Discharge |
|
|
|
|
|
|
|
|
|
|
|
|
|
|
|
|
|
|
|
|
|
|
|
|
|
|
|
| Date |
m3/sec |
|
|
|
|
|
|
|
|
|
|
|
|
|
|
|
|
|
|
|
| 22-Jul-02 |
287 |
|
|
|
|
|
|
|
|
|
|
|
|
|
|
|
|
|
|
|
| 23-Jul-02 |
287 |
|
|
|
|
|
|
|
|
|
|
|
|
|
|
|
|
|
|
|
| 24-Jul-02 |
275 |
|
|
|
|
|
|
|
|
|
|
|
|
|
|
|
|
|
|
|
| 25-Jul-02 |
274 |
|
|
|
|
|
|
|
|
|
|
|
|
|
|
|
|
|
|
|
| 26-Jul-02 |
299 |
|
|
|
|
|
|
|
|
|
|
|
|
|
|
|
|
|
|
|
| 27-Jul-02 |
299 |
|
|
|
|
|
|
|
|
|
|
|
|
|
|
|
|
|
|
|
| 28-Jul-02 |
298 |
|
|
|
|
|
|
|
|
|
|
|
|
|
|
|
|
|
|
|
| 29-Jul-02 |
294 |
|
|
|
|
|
|
|
|
|
|
|
|
|
|
|
|
|
|
|
| 30-Jul-02 |
288 |
|
|
|
|
|
|
|
|
|
|
|
|
|
|
|
|
|
|
|
| 31-Jul-02 |
288 |
|
|
|
|
|
|
|
|
|
|
|
|
|
|
|
|
|
|
|
| 1-Aug-02 |
287 |
|
|
|
|
|
|
|
|
|
|
|
|
|
|
|
|
|
|
|
| 2-Aug-02 |
|
|
|
|
|
|
|
|
|
|
|
|
|
|
|
|
|
|
|
|
| 3-Aug-02 |
|
|
|
|
|
|
|
|
|
|
|
|
|
|
|
|
|
|
|
|
| 4-Aug-02 |
|
|
|
|
|
|
|
|
|
|
|
|
|
|
|
|
|
|
|
|
| 5-Aug-02 |
|
|
|
|
|
|
|
|
|
|
|
|
|
|
|
|
|
|
|
|
| 6-Aug-02 |
|
|
|
|
|
|
|
|
|
|
|
|
|
|
|
|
|
|
|
|
| 7-Aug-02 |
|
|
|
|
|
|
|
|
|
|
|
|
|
|
|
|
|
|
|
|
| 8-Aug-02 |
|
|
|
|
|
|
|
|
|
|
|
|
|
|
|
|
|
|
|
|
| 9-Aug-02 |
233 |
|
|
|
|
|
|
|
|
|
|
|
|
|
|
|
|
|
|
|
| 10-Aug-02 |
233 |
|
|
|
|
|
|
|
|
|
|
|
|
|
|
|
|
|
|
|
| 11-Aug-02 |
229 |
|
|
|
|
|
|
|
|
|
|
|
|
|
|
|
|
|
|
|
| 12-Aug-02 |
229 |
|
|
|
|
|
|
|
|
|
|
|
|
|
|
|
|
|
|
|
| 13-Aug-02 |
239 |
|
|
|
|
|
|
|
|
|
|
|
|
|
|
|
|
|
|
|
| 14-Aug-02 |
240 |
|
|
|
|
|
|
|
|
|
|
|
|
|
|
|
|
|
|
|
| 15-Aug-02 |
256 |
|
|
|
|
|
|
|
|
|
|
|
|
|
|
|
|
|
|
|
| 16-Aug-02 |
251 |
|
|
|
|
|
|
|
|
|
|
|
|
|
|
|
|
|
|
|
| 17-Aug-02 |
250 |
|
|
|
|
|
|
|
|
|
|
|
|
|
|
|
|
|
|
|
| 18-Aug-02 |
247 |
|
|
|
|
|
|
|
|
|
|
|
|
|
|
|
|
|
|
|
| 19-Aug-02 |
233 |
|
|
|
|
|
|
|
|
|
|
|
|
|
|
|
|
|
|
|
| 20-Aug-02 |
228 |
|
|
|
|
|
|
|
|
|
|
|
|
|
|
|
|
|
|
|
| 21-Aug-02 |
237 |
|
|
|
|
|
|
|
|
|
|
|
|
|
|
|
|
|
|
|
| 22-Aug-02 |
241 |
|
|
|
|
|
|
|
|
|
|
|
|
|
|
|
|
|
|
|
| 23-Aug-02 |
243 |
|
|
|
|
|
|
|
|
|
|
|
|
|
|
|
|
|
|
|
| 24-Aug-02 |
249 |
|
|
|
|
|
|
|
|
|
|
|
|
|
|
|
|
|
|
|
| 25-Aug-02 |
243 |
|
|
|
|
|
|
|
|
|
|
|
|
|
|
|
|
|
|
|
| 26-Aug-02 |
241 |
|
|
|
|
|
|
|
|
|
|
|
|
|
|
|
|
|
|
|
| 27-Aug-02 |
246 |
|
|
|
|
|
|
|
|
|
|
|
|
|
|
|
|
|
|
|
| 28-Aug-02 |
246 |
|
|
|
|
|
|
|
|
|
|
|
|
|
|
|
|
|
|
|
| 29-Aug-02 |
243 |
|
|
|
|
|
|
|
|
|
|
|
|
|
|
|
|
|
|
|
| 30-Aug-02 |
239 |
|
|
|
|
|
|
|
|
|
|
|
|
|
|
|
|
|
|
|
| 31-Aug-02 |
240 |
|
|
|
|
|
|
|
|
|
|
|
|
|
|
|
|
|
|
|
| 1-Sep-02 |
224 |
|
|
|
|
|
|
|
|
|
|
|
|
|
|
|
|
|
|
|
| 2-Sep-02 |
222 |
|
|
|
|
|
|
|
|
|
|
|
|
|
|
|
|
|
|
|
| 3-Sep-02 |
223 |
|
|
|
|
|
|
|
|
|
|
|
|
|
|
|
|
|
|
|
| 4-Sep-02 |
205 |
|
|
|
|
|
|
|
|
|
|
|
|
|
|
|
|
|
|
|
| 5-Sep-02 |
242 |
|
|
|
|
|
|
|
|
|
|
|
|
|
|
|
|
|
|
|
| 6-Sep-02 |
256 |
|
|
|
|
|
|
|
|
|
|
|
|
|
|
|
|
|
|
|
| 7-Sep-02 |
253 |
|
|
|
|
|
|
|
|
|
|
|
|
|
|
|
|
|
|
|
| 8-Sep-02 |
237 |
|
|
|
|
|
|
|
|
|
|
|
|
|
|
|
|
|
|
|
| 9-Sep-02 |
232 |
|
|
|
|
|
|
|
|
|
|
|
|
|
|
|
|
|
|
|
| 10-Sep-02 |
230 |
|
|
|
|
|
|
|
|
|
|
|
|
|
|
|
|
|
|
|
| 11-Sep-02 |
235 |
|
|
|
|
|
|
|
|
|
|
|
|
|
|
|
|
|
|
|
| 12-Sep-02 |
256 |
|
|
|
|
|
|
|
|
|
|
|
|
|
|
|
|
|
|
|
| 13-Sep-02 |
256 |
|
|
|
|
|
|
|
|
|
|
|
|
|
|
|
|
|
|
|
| 14-Sep-02 |
232 |
|
|
|
|
|
|
|
|
|
|
|
|
|
|
|
|
|
|
|
| 15-Sep-02 |
232 |
|
|
|
|
|
|
|
|
|
|
|
|
|
|
|
|
|
|
|
| 16-Sep-02 |
|
|
|
|
|
|
|
|
|
|
|
|
|
|
|
|
|
|
|
|
| 17-Sep-02 |
|
|
|
|
|
|
|
|
|
|
|
|
|
|
|
|
|
|
|
|
| 18-Sep-02 |
|
|
|
|
|
|
|
|
|
|
|
|
|
|
|
|
|
|
|
|
| 19-Sep-02 |
|
|
|
|
|
|
|
|
|
|
|
|
|
|
|
|
|
|
|
|
| 20-Sep-02 |
|
|
|
|
|
|
|
|
|
|
|
|
|
|
|
|
|
|
|
|
| 21-Sep-02 |
190 |
|
|
|
|
|
|
|
|
|
|
|
|
|
|
|
|
|
|
|
| 22-Sep-02 |
228 |
|
|
|
|
|
|
|
|
|
|
|
|
|
|
|
|
|
|
|
| 23-Sep-02 |
225 |
|
|
|
|
|
|
|
|
|
|
|
|
|
|
|
|
|
|
|
| 24-Sep-02 |
220 |
|
|
|
|
|
|
|
|
|
|
|
|
|
|
|
|
|
|
|
| 25-Sep-02 |
230 |
|
|
|
|
|
|
|
|
|
|
|
|
|
|
|
|
|
|
|
| 26-Sep-02 |
227 |
|
|
|
|
|
|
|
|
|
|
|
|
|
|
|
|
|
|
|
| 27-Sep-02 |
231 |
|
|
|
|
|
|
|
|
|
|
|
|
|
|
|
|
|
|
|
| 28-Sep-02 |
259 |
|
|
|
|
|
|
|
|
|
|
|
|
|
|
|
|
|
|
|
| 29-Sep-02 |
259 |
|
|
|
|
|
|
|
|
|
|
|
|
|
|
|
|
|
|
|
| 30-Sep-02 |
255 |
|
|
|
|
|
|
|
|
|
|
|
|
|
|
|
|
|
|
|
| 1-Oct-02 |
255 |
|
|
|
|
|
|
|
|
|
|
|
|
|
|
|
|
|
|
|
| 2-Oct-02 |
221 |
|
|
|
|
|
|
|
|
|
|
|
|
|
|
|
|
|
|
|
| 3-Oct-02 |
201 |
|
|
|
|
|
|
|
|
|
|
|
|
|
|
|
|
|
|
|
| 4-Oct-02 |
174 |
|
|
|
|
|
|
|
|
|
|
|
|
|
|
|
|
|
|
|
| 5-Oct-02 |
191 |
|
|
|
|
|
|
|
|
|
|
|
|
|
|
|
|
|
|
|
| 6-Oct-02 |
194 |
|
|
|
|
|
|
|
|
|
|
|
|
|
|
|
|
|
|
|
| 7-Oct-02 |
242 |
|
|
|
|
|
|
|
|
|
|
|
|
|
|
|
|
|
|
|
| 8-Oct-02 |
258 |
|
|
|
|
|
|
|
|
|
|
|
|
|
|
|
|
|
|
|
| 9-Oct-02 |
262 |
|
|
|
|
|
|
|
|
|
|
|
|
|
|
|
|
|
|
|
| 10-Oct-02 |
236 |
|
|
|
|
|
|
|
|
|
|
|
|
|
|
|
|
|
|
|
| 11-Oct-02 |
223 |
|
|
|
|
|
|
|
|
|
|
|
|
|
|
|
|
|
|
|
| 12-Oct-02 |
222 |
|
|
|
|
|
|
|
|
|
|
|
|
|
|
|
|
|
|
|
| 13-Oct-02 |
204 |
|
|
|
|
|
|
|
|
|
|
|
|
|
|
|
|
|
|
|
| 14-Oct-02 |
249 |
|
|
|
|
|
|
|
|
|
|
|
|
|
|
|
|
|
|
|
| 15-Oct-02 |
249 |
|
|
|
|
|
|
|
|
|
|
|
|
|
|
|
|
|
|
|
| 16-Oct-02 |
262 |
|
|
|
|
|
|
|
|
|
|
|
|
|
|
|
|
|
|
|
| 17-Oct-02 |
249 |
|
|
|
|
|
|
|
|
|
|
|
|
|
|
|
|
|
|
|
| 18-Oct-02 |
247 |
|
|
|
|
|
|
|
|
|
|
|
|
|
|
|
|
|
|
|
| 19-Oct-02 |
247 |
|
|
|
|
|
|
|
|
|
|
|
|
|
|
|
|
|
|
|
| 20-Oct-02 |
243 |
|
|
|
|
|
|
|
|
|
|
|
|
|
|
|
|
|
|
|
| 21-Oct-02 |
237 |
|
|
|
|
|
|
|
|
|
|
|
|
|
|
|
|
|
|
|
| 22-Oct-02 |
226 |
|
|
|
|
|
|
|
|
|
|
|
|
|
|
|
|
|
|
|
| 23-Oct-02 |
240 |
|
|
|
|
|
|
|
|
|
|
|
|
|
|
|
|
|
|
|
| 24-Oct-02 |
238 |
|
|
|
|
|
|
|
|
|
|
|
|
|
|
|
|
|
|
|
| 25-Oct-02 |
244 |
|
|
|
|
|
|
|
|
|
|
|
|
|
|
|
|
|
|
|
| 26-Oct-02 |
236 |
|
|
|
|
|
|
|
|
|
|
|
|
|
|
|
|
|
|
|
| 27-Oct-02 |
218 |
|
|
|
|
|
|
|
|
|
|
|
|
|
|
|
|
|
|
|
| 28-Oct-02 |
219 |
|
|
|
|
|
|
|
|
|
|
|
|
|
|
|
|
|
|
|
| 29-Oct-02 |
214 |
|
|
|
|
|
|
|
|
|
|
|
|
|
|
|
|
|
|
|
| 30-Oct-02 |
180 |
|
|
|
|
|
|
|
|
|
|
|
|
|
|
|
|
|
|
|
| 31-Oct-02 |
180 |
|
|
|
|
|
|
|
|
|
|
|
|
|
|
|
|
|
|
|
| 1-Nov-02 |
145 |
|
|
|
|
|
|
|
|
|
|
|
|
|
|
|
|
|
|
|
| 2-Nov-02 |
152 |
|
|
|
|
|
|
|
|
|
|
|
|
|
|
|
|
|
|
|
| 3-Nov-02 |
196 |
|
|
|
|
|
|
|
|
|
|
|
|
|
|
|
|
|
|
|
| 4-Nov-02 |
196 |
|
|
|
|
|
|
|
|
|
|
|
|
|
|
|
|
|
|
|
| 5-Nov-02 |
196 |
|
|
|
|
|
|
|
|
|
|
|
|
|
|
|
|
|
|
|
| 6-Nov-02 |
206 |
|
|
|
|
|
|
|
|
|
|
|
|
|
|
|
|
|
|
|
| 7-Nov-02 |
191 |
|
|
|
|
|
|
|
|
|
|
|
|
|
|
|
|
|
|
|
| 8-Nov-02 |
214 |
|
|
|
|
|
|
|
|
|
|
|
|
|
|
|
|
|
|
|
| 9-Nov-02 |
214 |
|
|
|
|
|
|
|
|
|
|
|
|
|
|
|
|
|
|
|
| 10-Nov-02 |
237 |
|
|
|
|
|
|
|
|
|
|
|
|
|
|
|
|
|
|
|
| 11-Nov-02 |
222 |
|
|
|
|
|
|
|
|
|
|
|
|
|
|
|
|
|
|
|
| 12-Nov-02 |
215 |
|
|
|
|
|
|
|
|
|
|
|
|
|
|
|
|
|
|
|
| 13-Nov-02 |
228 |
|
|
|
|
|
|
|
|
|
|
|
|
|
|
|
|
|
|
|
| 14-Nov-02 |
213 |
|
|
|
|
|
|
|
|
|
|
|
|
|
|
|
|
|
|
|
| 15-Nov-02 |
226 |
|
|
|
|
|
|
|
|
|
|
|
|
|
|
|
|
|
|
|
| 16-Nov-02 |
226 |
|
|
|
|
|
|
|
|
|
|
|
|
|
|
|
|
|
|
|
| 17-Nov-02 |
227 |
|
|
|
|
|
|
|
|
|
|
|
|
|
|
|
|
|
|
|
| 18-Nov-02 |
237 |
|
|
|
|
|
|
|
|
|
|
|
|
|
|
|
|
|
|
|
| 19-Nov-02 |
256 |
|
|
|
|
|
|
|
|
|
|
|
|
|
|
|
|
|
|
|
| 20-Nov-02 |
261 |
|
|
|
|
|
|
|
|
|
|
|
|
|
|
|
|
|
|
|
| 21-Nov-02 |
263 |
|
|
|
|
|
|
|
|
|
|
|
|
|
|
|
|
|
|
|
| 22-Nov-02 |
254 |
|
|
|
|
|
|
|
|
|
|
|
|
|
|
|
|
|
|
|
| 23-Nov-02 |
251 |
|
|
|
|
|
|
|
|
|
|
|
|
|
|
|
|
|
|
|
| 24-Nov-02 |
231 |
|
|
|
|
|
|
|
|
|
|
|
|
|
|
|
|
|
|
|
| 25-Nov-02 |
217 |
|
|
|
|
|
|
|
|
|
|
|
|
|
|
|
|
|
|
|
| 26-Nov-02 |
223 |
|
|
|
|
|
|
|
|
|
|
|
|
|
|
|
|
|
|
|
| 27-Nov-02 |
234 |
|
|
|
|
|
|
|
|
|
|
|
|
|
|
|
|
|
|
|
| 28-Nov-02 |
239 |
|
|
|
|
|
|
|
|
|
|
|
|
|
|
|
|
|
|
|
| 29-Nov-02 |
267 |
|
|
|
|
|
|
|
|
|
|
|
|
|
|
|
|
|
|
|
| 30-Nov-02 |
275 |
|
|
|
|
|
|
|
|
|
|
|
|
|
|
|
|
|
|
|
| 1-Dec-02 |
299 |
|
|
|
|
|
|
|
|
|
|
|
|
|
|
|
|
|
|
|
| 2-Dec-02 |
299 |
|
|
|
|
|
|
|
|
|
|
|
|
|
|
|
|
|
|
|
| 3-Dec-02 |
267 |
|
|
|
|
|
|
|
|
|
|
|
|
|
|
|
|
|
|
|
| 4-Dec-02 |
250 |
|
|
|
|
|
|
|
|
|
|
|
|
|
|
|
|
|
|
|
| 5-Dec-02 |
261 |
|
|
|
|
|
|
|
|
|
|
|
|
|
|
|
|
|
|
|
| 6-Dec-02 |
285 |
|
|
|
|
|
|
|
|
|
|
|
|
|
|
|
|
|
|
|
| 7-Dec-02 |
291 |
|
|
|
|
|
|
|
|
|
|
|
|
|
|
|
|
|
|
|
| 8-Dec-02 |
259 |
|
|
|
|
|
|
|
|
|
|
|
|
|
|
|
|
|
|
|
| 9-Dec-02 |
248 |
|
|
|
|
|
|
|
|
|
|
|
|
|
|
|
|
|
|
|
| 10-Dec-02 |
269 |
|
|
|
|
|
|
|
|
|
|
|
|
|
|
|
|
|
|
|
| 11-Dec-02 |
269 |
|
|
|
|
|
|
|
|
|
|
|
|
|
|
|
|
|
|
|
| 12-Dec-02 |
301 |
|
|
|
|
|
|
|
|
|
|
|
|
|
|
|
|
|
|
|
| 13-Dec-02 |
321 |
|
|
|
|
|
|
|
|
|
|
|
|
|
|
|
|
|
|
|
| 14-Dec-02 |
294 |
|
|
|
|
|
|
|
|
|
|
|
|
|
|
|
|
|
|
|
| 15-Dec-02 |
282 |
|
|
|
|
|
|
|
|
|
|
|
|
|
|
|
|
|
|
|
| 16-Dec-02 |
307 |
|
|
|
|
|
|
|
|
|
|
|
|
|
|
|
|
|
|
|
| 17-Dec-02 |
249 |
|
|
|
|
|
|
|
|
|
|
|
|
|
|
|
|
|
|
|
| 18-Dec-02 |
249 |
|
|
|
|
|
|
|
|
|
|
|
|
|
|
|
|
|
|
|
| 19-Dec-02 |
253 |
|
|
|
|
|
|
|
|
|
|
|
|
|
|
|
|
|
|
|
| 20-Dec-02 |
252 |
|
|
|
|
|
|
|
|
|
|
|
|
|
|
|
|
|
|
|
| 21-Dec-02 |
235 |
|
|
|
|
|
|
|
|
|
|
|
|
|
|
|
|
|
|
|
| 22-Dec-02 |
232 |
|
|
|
|
|
|
|
|
|
|
|
|
|
|
|
|
|
|
|
| 23-Dec-02 |
229 |
|
|
|
|
|
|
|
|
|
|
|
|
|
|
|
|
|
|
|
| 24-Dec-02 |
237 |
|
|
|
|
|
|
|
|
|
|
|
|
|
|
|
|
|
|
|
| 25-Dec-02 |
249 |
|
|
|
|
|
|
|
|
|
|
|
|
|
|
|
|
|
|
|
| 26-Dec-02 |
221 |
|
|
|
|
|
|
|
|
|
|
|
|
|
|
|
|
|
|
|
| 27-Dec-02 |
227 |
|
|
|
|
|
|
|
|
|
|
|
|
|
|
|
|
|
|
|
| 28-Dec-02 |
207 |
|
|
|
|
|
|
|
|
|
|
|
|
|
|
|
|
|
|
|
| 29-Dec-02 |
215 |
|
|
|
|
|
|
|
|
|
|
|
|
|
|
|
|
|
|
|
| 30-Dec-02 |
229 |
|
|
|
|
|
|
|
|
|
|
|
|
|
|
|
|
|
|
|
| 31-Dec-02 |
228 |
|
|
|
|
|
|
|
|
|
|
|
|
|
|
|
|
|
|
|
| 1-Jan-03 |
240 |
|
|
|
|
|
|
|
|
|
|
|
|
|
|
|
|
|
|
|
| 2-Jan-03 |
209 |
|
|
|
|
|
|
|
|
|
|
|
|
|
|
|
|
|
|
|
| 3-Jan-03 |
209 |
|
|
|
|
|
|
|
|
|
|
|
|
|
|
|
|
|
|
|
| 4-Jan-03 |
222 |
|
|
|
|
|
|
|
|
|
|
|
|
|
|
|
|
|
|
|
| 5-Jan-03 |
234 |
|
|
|
|
|
|
|
|
|
|
|
|
|
|
|
|
|
|
|
| 6-Jan-03 |
241 |
|
|
|
|
|
|
|
|
|
|
|
|
|
|
|
|
|
|
|
| 7-Jan-03 |
238 |
|
|
|
|
|
|
|
|
|
|
|
|
|
|
|
|
|
|
|
| 8-Jan-03 |
239 |
|
|
|
|
|
|
|
|
|
|
|
|
|
|
|
|
|
|
|
| 9-Jan-03 |
264 |
|
|
|
|
|
|
|
|
|
|
|
|
|
|
|
|
|
|
|
| 10-Jan-03 |
281 |
|
|
|
|
|
|
|
|
|
|
|
|
|
|
|
|
|
|
|
| 11-Jan-03 |
340 |
|
|
|
|
|
|
|
|
|
|
|
|
|
|
|
|
|
|
|
| 12-Jan-03 |
351 |
|
|
|
|
|
|
|
|
|
|
|
|
|
|
|
|
|
|
|
| 13-Jan-03 |
313 |
|
|
|
|
|
|
|
|
|
|
|
|
|
|
|
|
|
|
|
| 14-Jan-03 |
307 |
|
|
|
|
|
|
|
|
|
|
|
|
|
|
|
|
|
|
|
| 15-Jan-03 |
277 |
|
|
|
|
|
|
|
|
|
|
|
|
|
|
|
|
|
|
|
| 16-Jan-03 |
256 |
|
|
|
|
|
|
|
|
|
|
|
|
|
|
|
|
|
|
|
| 17-Jan-03 |
253 |
|
|
|
|
|
|
|
|
|
|
|
|
|
|
|
|
|
|
|
| 18-Jan-03 |
242 |
|
|
|
|
|
|
|
|
|
|
|
|
|
|
|
|
|
|
|
| 19-Jan-03 |
242 |
|
|
|
|
|
|
|
|
|
|
|
|
|
|
|
|
|
|
|
| 20-Jan-03 |
243 |
|
|
|
|
|
|
|
|
|
|
|
|
|
|
|
|
|
|
|
| 21-Jan-03 |
216 |
|
|
|
|
|
|
|
|
|
|
|
|
|
|
|
|
|
|
|
| 22-Jan-03 |
202 |
|
|
|
|
|
|
|
|
|
|
|
|
|
|
|
|
|
|
|
| 23-Jan-03 |
209 |
|
|
|
|
|
|
|
|
|
|
|
|
|
|
|
|
|
|
|
| 24-Jan-03 |
211 |
|
|
|
|
|
|
|
|
|
|
|
|
|
|
|
|
|
|
|
| 25-Jan-03 |
234 |
|
|
|
|
|
|
|
|
|
|
|
|
|
|
|
|
|
|
|
| 26-Jan-03 |
231 |
|
|
|
|
|
|
|
|
|
|
|
|
|
|
|
|
|
|
|
| 27-Jan-03 |
245 |
|
|
|
|
|
|
|
|
|
|
|
|
|
|
|
|
|
|
|
| 28-Jan-03 |
252 |
|
|
|
|
|
|
|
|
|
|
|
|
|
|
|
|
|
|
|
| 29-Jan-03 |
269 |
|
|
|
|
|
|
|
|
|
|
|
|
|
|
|
|
|
|
|
| 30-Jan-03 |
272 |
|
|
|
|
|
|
|
|
|
|
|
|
|
|
|
|
|
|
|
| 31-Jan-03 |
280 |
|
|
|
|
|
|
|
|
|
|
|
|
|
|
|
|
|
|
|
| 1-Feb-03 |
272 |
|
|
|
|
|
|
|
|
|
|
|
|
|
|
|
|
|
|
|
| 2-Feb-03 |
288 |
|
|
|
|
|
|
|
|
|
|
|
|
|
|
|
|
|
|
|
| 3-Feb-03 |
238 |
|
|
|
|
|
|
|
|
|
|
|
|
|
|
|
|
|
|
|
| 4-Feb-03 |
238 |
|
|
|
|
|
|
|
|
|
|
|
|
|
|
|
|
|
|
|
| 5-Feb-03 |
323 |
|
|
|
|
|
|
|
|
|
|
|
|
|
|
|
|
|
|
|
| 6-Feb-03 |
287 |
|
|
|
|
|
|
|
|
|
|
|
|
|
|
|
|
|
|
|
| 7-Feb-03 |
312 |
|
|
|
|
|
|
|
|
|
|
|
|
|
|
|
|
|
|
|
| 8-Feb-03 |
280 |
|
|
|
|
|
|
|
|
|
|
|
|
|
|
|
|
|
|
|
| 9-Feb-03 |
215 |
|
|
|
|
|
|
|
|
|
|
|
|
|
|
|
|
|
|
|
| 10-Feb-03 |
225 |
|
|
|
|
|
|
|
|
|
|
|
|
|
|
|
|
|
|
|
| 11-Feb-03 |
225 |
|
|
|
|
|
|
|
|
|
|
|
|
|
|
|
|
|
|
|
| 12-Feb-03 |
212 |
|
|
|
|
|
|
|
|
|
|
|
|
|
|
|
|
|
|
|
| 13-Feb-03 |
212 |
|
|
|
|
|
|
|
|
|
|
|
|
|
|
|
|
|
|
|
| 14-Feb-03 |
190 |
|
|
|
|
|
|
|
|
|
|
|
|
|
|
|
|
|
|
|
| 15-Feb-03 |
202 |
|
|
|
|
|
|
|
|
|
|
|
|
|
|
|
|
|
|
|
| 16-Feb-03 |
206 |
|
|
|
|
|
|
|
|
|
|
|
|
|
|
|
|
|
|
|
| 17-Feb-03 |
203 |
|
|
|
|
|
|
|
|
|
|
|
|
|
|
|
|
|
|
|
| 18-Feb-03 |
211 |
|
|
|
|
|
|
|
|
|
|
|
|
|
|
|
|
|
|
|
| 19-Feb-03 |
226 |
|
|
|
|
|
|
|
|
|
|
|
|
|
|
|
|
|
|
|
| 20-Feb-03 |
226 |
|
|
|
|
|
|
|
|
|
|
|
|
|
|
|
|
|
|
|
| 21-Feb-03 |
225 |
|
|
|
|
|
|
|
|
|
|
|
|
|
|
|
|
|
|
|
| 22-Feb-03 |
236 |
|
|
|
|
|
|
|
|
|
|
|
|
|
|
|
|
|
|
|
| 23-Feb-03 |
216 |
|
|
|
|
|
|
|
|
|
|
|
|
|
|
|
|
|
|
|
| 24-Feb-03 |
228 |
|
|
|
|
|
|
|
|
|
|
|
|
|
|
|
|
|
|
|
| 25-Feb-03 |
240 |
|
|
|
|
|
|
|
|
|
|
|
|
|
|
|
|
|
|
|
| 26-Feb-03 |
221 |
|
|
|
|
|
|
|
|
|
|
|
|
|
|
|
|
|
|
|
| 27-Feb-03 |
232 |
|
|
|
|
|
|
|
|
|
|
|
|
|
|
|
|
|
|
|
| 28-Feb-03 |
234 |
|
|
|
|
|
|
|
|
|
|
|
|
|
|
|
|
|
|
|
| 1-Mar-03 |
234 |
|
|
|
|
|
|
|
|
|
|
|
|
|
|
|
|
|
|
|
| 2-Mar-03 |
288 |
|
|
|
|
|
|
|
|
|
|
|
|
|
|
|
|
|
|
|
| 3-Mar-03 |
263 |
|
|
|
|
|
|
|
|
|
|
|
|
|
|
|
|
|
|
|
| 4-Mar-03 |
262 |
|
|
|
|
|
|
|
|
|
|
|
|
|
|
|
|
|
|
|
| 5-Mar-03 |
252 |
|
|
|
|
|
|
|
|
|
|
|
|
|
|
|
|
|
|
|
| 6-Mar-03 |
221 |
|
|
|
|
|
|
|
|
|
|
|
|
|
|
|
|
|
|
|
| 7-Mar-03 |
232 |
|
|
|
|
|
|
|
|
|
|
|
|
|
|
|
|
|
|
|
| 8-Mar-03 |
232 |
|
|
|
|
|
|
|
|
|
|
|
|
|
|
|
|
|
|
|
| 9-Mar-03 |
291 |
|
|
|
|
|
|
|
|
|
|
|
|
|
|
|
|
|
|
|
| 10-Mar-03 |
334 |
|
|
|
|
|
|
|
|
|
|
|
|
|
|
|
|
|
|
|
| 11-Mar-03 |
307 |
|
|
|
|
|
|
|
|
|
|
|
|
|
|
|
|
|
|
|
| 12-Mar-03 |
323 |
|
|
|
|
|
|
|
|
|
|
|
|
|
|
|
|
|
|
|
| 13-Mar-03 |
334 |
|
|
|
|
|
|
|
|
|
|
|
|
|
|
|
|
|
|
|
| 14-Mar-03 |
328 |
|
|
|
|
|
|
|
|
|
|
|
|
|
|
|
|
|
|
|
| 15-Mar-03 |
365 |
|
|
|
|
|
|
|
|
|
|
|
|
|
|
|
|
|
|
|
| 16-Mar-03 |
338 |
|
|
|
|
|
|
|
|
|
|
|
|
|
|
|
|
|
|
|
| 17-Mar-03 |
301 |
|
|
|
|
|
|
|
|
|
|
|
|
|
|
|
|
|
|
|
| 18-Mar-03 |
347 |
|
|
|
|
|
|
|
|
|
|
|
|
|
|
|
|
|
|
|
| 19-Mar-03 |
371 |
|
|
|
|
|
|
|
|
|
|
|
|
|
|
|
|
|
|
|
| 20-Mar-03 |
389 |
|
|
|
|
|
|
|
|
|
|
|
|
|
|
|
|
|
|
|
| 21-Mar-03 |
483 |
|
|
|
|
|
|
|
|
|
|
|
|
|
|
|
|
|
|
|
| 22-Mar-03 |
468 |
|
|
|
|
|
|
|
|
|
|
|
|
|
|
|
|
|
|
|
| 23-Mar-03 |
505 |
|
|
|
|
|
|
|
|
|
|
|
|
|
|
|
|
|
|
|
| 24-Mar-03 |
505 |
|
|
|
|
|
|
|
|
|
|
|
|
|
|
|
|
|
|
|
| 25-Mar-03 |
344 |
|
|
|
|
|
|
|
|
|
|
|
|
|
|
|
|
|
|
|
| 26-Mar-03 |
431 |
|
|
|
|
|
|
|
|
|
|
|
|
|
|
|
|
|
|
|
| 27-Mar-03 |
482 |
|
|
|
|
|
|
|
|
|
|
|
|
|
|
|
|
|
|
|
| 28-Mar-03 |
477 |
|
|
|
|
|
|
|
|
|
|
|
|
|
|
|
|
|
|
|
| 29-Mar-03 |
583 |
|
|
|
|
|
|
|
|
|
|
|
|
|
|
|
|
|
|
|
| 30-Mar-03 |
567 |
|
|
|
|
|
|
|
|
|
|
|
|
|
|
|
|
|
|
|
| 31-Mar-03 |
508 |
|
|
|
|
|
|
|
|
|
|
|
|
|
|
|
|
|
|
|
| 1-Apr-03 |
555 |
|
|
|
|
|
|
|
|
|
|
|
|
|
|
|
|
|
|
|
| 2-Apr-03 |
556 |
|
|
|
|
|
|
|
|
|
|
|
|
|
|
|
|
|
|
|
| 3-Apr-03 |
662 |
|
|
|
|
|
|
|
|
|
|
|
|
|
|
|
|
|
|
|
| 4-Apr-03 |
648 |
|
|
|
|
|
|
|
|
|
|
|
|
|
|
|
|
|
|
|
| 5-Apr-03 |
648 |
|
|
|
|
|
|
|
|
|
|
|
|
|
|
|
|
|
|
|
| 6-Apr-03 |
635 |
|
|
|
|
|
|
|
|
|
|
|
|
|
|
|
|
|
|
|
| 7-Apr-03 |
643 |
|
|
|
|
|
|
|
|
|
|
|
|
|
|
|
|
|
|
|
| 8-Apr-03 |
696 |
|
|
|
|
|
|
|
|
|
|
|
|
|
|
|
|
|
|
|
| 9-Apr-03 |
696 |
|
|
|
|
|
|
|
|
|
|
|
|
|
|
|
|
|
|
|
| 10-Apr-03 |
811 |
|
|
|
|
|
|
|
|
|
|
|
|
|
|
|
|
|
|
|
| 11-Apr-03 |
727 |
|
|
|
|
|
|
|
|
|
|
|
|
|
|
|
|
|
|
|
| 12-Apr-03 |
735 |
|
|
|
|
|
|
|
|
|
|
|
|
|
|
|
|
|
|
|
| 13-Apr-03 |
732 |
|
|
|
|
|
|
|
|
|
|
|
|
|
|
|
|
|
|
|
| 14-Apr-03 |
695 |
|
|
|
|
|
|
|
|
|
|
|
|
|
|
|
|
|
|
|
| 15-Apr-03 |
786 |
|
|
|
|
|
|
|
|
|
|
|
|
|
|
|
|
|
|
|
| 16-Apr-03 |
779 |
|
|
|
|
|
|
|
|
|
|
|
|
|
|
|
|
|
|
|
| 17-Apr-03 |
863 |
|
|
|
|
|
|
|
|
|
|
|
|
|
|
|
|
|
|
|
| 18-Apr-03 |
877 |
|
|
|
|
|
|
|
|
|
|
|
|
|
|
|
|
|
|
|
| 19-Apr-03 |
1079 |
|
|
|
|
|
|
|
|
|
|
|
|
|
|
|
|
|
|
|
| 20-Apr-03 |
1181 |
|
|
|
|
|
|
|
|
|
|
|
|
|
|
|
|
|
|
|
| 21-Apr-03 |
1321 |
|
|
|
|
|
|
|
|
|
|
|
|
|
|
|
|
|
|
|
| 22-Apr-03 |
1432 |
|
|
|
|
|
|
|
|
|
|
|
|
|
|
|
|
|
|
|
| 23-Apr-03 |
1519 |
|
|
|
|
|
|
|
|
|
|
|
|
|
|
|
|
|
|
|
| 24-Apr-03 |
1681 |
|
|
|
|
|
|
|
|
|
|
|
|
|
|
|
|
|
|
|
| 25-Apr-03 |
1681 |
|
|
|
|
|
|
|
|
|
|
|
|
|
|
|
|
|
|
|
| 26-Apr-03 |
1721 |
|
|
|
|
|
|
|
|
|
|
|
|
|
|
|
|
|
|
|
| 27-Apr-03 |
1627 |
|
|
|
|
|
|
|
|
|
|
|
|
|
|
|
|
|
|
|
| 28-Apr-03 |
1613 |
|
|
|
|
|
|
|
|
|
|
|
|
|
|
|
|
|
|
|
| 29-Apr-03 |
1593 |
|
|
|
|
|
|
|
|
|
|
|
|
|
|
|
|
|
|
|
| 30-Apr-03 |
1597 |
|
|
|
|
|
|
|
|
|
|
|
|
|
|
|
|
|
|
|
| 1-May-03 |
1658 |
|
|
|
|
|
|
|
|
|
|
|
|
|
|
|
|
|
|
|
| 2-May-03 |
|
|
|
|
|
|
|
|
|
|
|
|
|
|
|
|
|
|
|
|
| 3-May-03 |
1467 |
|
|
|
|
|
|
|
|
|
|
|
|
|
|
|
|
|
|
|
| 4-May-03 |
1467 |
|
|
|
|
|
|
|
|
|
|
|
|
|
|
|
|
|
|
|
| 5-May-03 |
1519 |
|
|
|
|
|
|
|
|
|
|
|
|
|
|
|
|
|
|
|
| 6-May-03 |
1563 |
|
|
|
|
|
|
|
|
|
|
|
|
|
|
|
|
|
|
|
| 7-May-03 |
1610 |
|
|
|
|
|
|
|
|
|
|
|
|
|
|
|
|
|
|
|
| 8-May-03 |
1541 |
|
|
|
|
|
|
|
|
|
|
|
|
|
|
|
|
|
|
|
| 9-May-03 |
1525 |
|
|
|
|
|
|
|
|
|
|
|
|
|
|
|
|
|
|
|
| 10-May-03 |
1318 |
|
|
|
|
|
|
|
|
|
|
|
|
|
|
|
|
|
|
|
| 11-May-03 |
1318 |
|
|
|
|
|
|
|
|
|
|
|
|
|
|
|
|
|
|
|
| 12-May-03 |
1192 |
|
|
|
|
|
|
|
|
|
|
|
|
|
|
|
|
|
|
|
| 13-May-03 |
1266 |
|
|
|
|
|
|
|
|
|
|
|
|
|
|
|
|
|
|
|
| 14-May-03 |
1279 |
|
|
|
|
|
|
|
|
|
|
|
|
|
|
|
|
|
|
|
| 15-May-03 |
1360 |
|
|
|
|
|
|
|
|
|
|
|
|
|
|
|
|
|
|
|
| 16-May-03 |
1433 |
|
|
|
|
|
|
|
|
|
|
|
|
|
|
|
|
|
|
|
| 17-May-03 |
1471 |
|
|
|
|
|
|
|
|
|
|
|
|
|
|
|
|
|
|
|
| 18-May-03 |
1570 |
|
|
|
|
|
|
|
|
|
|
|
|
|
|
|
|
|
|
|
| 19-May-03 |
1293 |
|
|
|
|
|
|
|
|
|
|
|
|
|
|
|
|
|
|
|
| 20-May-03 |
1293 |
|
|
|
|
|
|
|
|
|
|
|
|
|
|
|
|
|
|
|
| 21-May-03 |
1133 |
|
|
|
|
|
|
|
|
|
|
|
|
|
|
|
|
|
|
|
| 22-May-03 |
1179 |
|
|
|
|
|
|
|
|
|
|
|
|
|
|
|
|
|
|
|
| 23-May-03 |
1240 |
|
|
|
|
|
|
|
|
|
|
|
|
|
|
|
|
|
|
|
| 24-May-03 |
1269 |
|
|
|
|
|
|
|
|
|
|
|
|
|
|
|
|
|
|
|
| 25-May-03 |
1300 |
|
|
|
|
|
|
|
|
|
|
|
|
|
|
|
|
|
|
|
| 26-May-03 |
1176 |
|
|
|
|
|
|
|
|
|
|
|
|
|
|
|
|
|
|
|
| 27-May-03 |
1176 |
|
|
|
|
|
|
|
|
|
|
|
|
|
|
|
|
|
|
|
| 28-May-03 |
1094 |
|
|
|
|
|
|
|
|
|
|
|
|
|
|
|
|
|
|
|
| 29-May-03 |
1097 |
|
|
|
|
|
|
|
|
|
|
|
|
|
|
|
|
|
|
|
| 30-May-03 |
1126 |
|
|
|
|
|
|
|
|
|
|
|
|
|
|
|
|
|
|
|
| 31-May-03 |
1107 |
|
|
|
|
|
|
|
|
|
|
|
|
|
|
|
|
|
|
|
| 1-Jun-03 |
1089 |
|
|
|
|
|
|
|
|
|
|
|
|
|
|
|
|
|
|
|
| 2-Jun-03 |
1023 |
|
|
|
|
|
|
|
|
|
|
|
|
|
|
|
|
|
|
|
| 3-Jun-03 |
973 |
|
|
|
|
|
|
|
|
|
|
|
|
|
|
|
|
|
|
|
| 4-Jun-03 |
886 |
|
|
|
|
|
|
|
|
|
|
|
|
|
|
|
|
|
|
|
| 5-Jun-03 |
905 |
|
|
|
|
|
|
|
|
|
|
|
|
|
|
|
|
|
|
|
| 6-Jun-03 |
788 |
|
|
|
|
|
|
|
|
|
|
|
|
|
|
|
|
|
|
|
| 7-Jun-03 |
785 |
|
|
|
|
|
|
|
|
|
|
|
|
|
|
|
|
|
|
|
| 8-Jun-03 |
736 |
|
|
|
|
|
|
|
|
|
|
|
|
|
|
|
|
|
|
|
| 9-Jun-03 |
688 |
|
|
|
|
|
|
|
|
|
|
|
|
|
|
|
|
|
|
|
| 10-Jun-03 |
693 |
|
|
|
|
|
|
|
|
|
|
|
|
|
|
|
|
|
|
|
| 11-Jun-03 |
553 |
|
|
|
|
|
|
|
|
|
|
|
|
|
|
|
|
|
|
|
| 12-Jun-03 |
553 |
|
|
|
|
|
|
|
|
|
|
|
|
|
|
|
|
|
|
|
| 13-Jun-03 |
558 |
|
|
|
|
|
|
|
|
|
|
|
|
|
|
|
|
|
|
|
| 14-Jun-03 |
554 |
|
|
|
|
|
|
|
|
|
|
|
|
|
|
|
|
|
|
|
| 15-Jun-03 |
582 |
|
|
|
|
|
|
|
|
|
|
|
|
|
|
|
|
|
|
|
| 16-Jun-03 |
562 |
|
|
|
|
|
|
|
|
|
|
|
|
|
|
|
|
|
|
|
| 17-Jun-03 |
546 |
|
|
|
|
|
|
|
|
|
|
|
|
|
|
|
|
|
|
|
| 18-Jun-03 |
503 |
|
|
|
|
|
|
|
|
|
|
|
|
|
|
|
|
|
|
|
| 19-Jun-03 |
462 |
|
|
|
|
|
|
|
|
|
|
|
|
|
|
|
|
|
|
|
| 20-Jun-03 |
440 |
|
|
|
|
|
|
|
|
|
|
|
|
|
|
|
|
|
|
|
| 21-Jun-03 |
432 |
|
|
|
|
|
|
|
|
|
|
|
|
|
|
|
|
|
|
|
| 22-Jun-03 |
433 |
|
|
|
|
|
|
|
|
|
|
|
|
|
|
|
|
|
|
|
| 23-Jun-03 |
427 |
|
|
|
|
|
|
|
|
|
|
|
|
|
|
|
|
|
|
|
| 24-Jun-03 |
418 |
|
|
|
|
|
|
|
|
|
|
|
|
|
|
|
|
|
|
|
| 25-Jun-03 |
403 |
|
|
|
|
|
|
|
|
|
|
|
|
|
|
|
|
|
|
|
| 26-Jun-03 |
394 |
|
|
|
|
|
|
|
|
|
|
|
|
|
|
|
|
|
|
|
| 27-Jun-03 |
364 |
|
|
|
|
|
|
|
|
|
|
|
|
|
|
|
|
|
|
|
| 28-Jun-03 |
364 |
|
|
|
|
|
|
|
|
|
|
|
|
|
|
|
|
|
|
|
| 29-Jun-03 |
356 |
|
|
|
|
|
|
|
|
|
|
|
|
|
|
|
|
|
|
|
| 30-Jun-03 |
356 |
|
|
|
|
|
|
|
|
|
|
|
|
|
|
|
|
|
|
|
| 1-Jul-03 |
365 |
|
|
|
|
|
|
|
|
|
|
|
|
|
|
|
|
|
|
|
| 2-Jul-03 |
354 |
|
|
|
|
|
|
|
|
|
|
|
|
|
|
|
|
|
|
|
| 3-Jul-03 |
353 |
|
|
|
|
|
|
|
|
|
|
|
|
|
|
|
|
|
|
|
| 4-Jul-03 |
345 |
|
|
|
|
|
|
|
|
|
|
|
|
|
|
|
|
|
|
|
| 5-Jul-03 |
326 |
|
|
|
|
|
|
|
|
|
|
|
|
|
|
|
|
|
|
|
| 6-Jul-03 |
346 |
|
|
|
|
|
|
|
|
|
|
|
|
|
|
|
|
|
|
|
| 7-Jul-03 |
346 |
|
|
|
|
|
|
|
|
|
|
|
|
|
|
|
|
|
|
|
| 8-Jul-03 |
346 |
|
|
|
|
|
|
|
|
|
|
|
|
|
|
|
|
|
|
|
| 9-Jul-03 |
336 |
|
|
|
|
|
|
|
|
|
|
|
|
|
|
|
|
|
|
|
| 10-Jul-03 |
324 |
|
|
|
|
|
|
|
|
|
|
|
|
|
|
|
|
|
|
|
| 11-Jul-03 |
309 |
|
|
|
|
|
|
|
|
|
|
|
|
|
|
|
|
|
|
|
| 12-Jul-03 |
298 |
|
|
|
|
|
|
|
|
|
|
|
|
|
|
|
|
|
|
|
| 13-Jul-03 |
279 |
|
|
|
|
|
|
|
|
|
|
|
|
|
|
|
|
|
|
|
| 14-Jul-03 |
279 |
|
|
|
|
|
|
|
|
|
|
|
|
|
|
|
|
|
|
|
| 15-Jul-03 |
299 |
|
|
|
|
|
|
|
|
|
|
|
|
|
|
|
|
|
|
|
| 16-Jul-03 |
299 |
|
|
|
|
|
|
|
|
|
|
|
|
|
|
|
|
|
|
|
| 17-Jul-03 |
304 |
|
|
|
|
|
|
|
|
|
|
|
|
|
|
|
|
|
|
|
| 18-Jul-03 |
293 |
|
|
|
|
|
|
|
|
|
|
|
|
|
|
|
|
|
|
|
| 19-Jul-03 |
285 |
|
|
|
|
|
|
|
|
|
|
|
|
|
|
|
|
|
|
|
| 20-Jul-03 |
264 |
|
|
|
|
|
|
|
|
|
|
|
|
|
|
|
|
|
|
|
| 21-Jul-03 |
247 |
|
|
|
|
|
|
|
|
|
|
|
|
|
|
|
|
|
|
|
| 22-Jul-03 |
254 |
|
|
|
|
|
|
|
|
|
|
|
|
|
|
|
|
|
|
|
| 23-Jul-03 |
260 |
|
|
|
|
|
|
|
|
|
|
|
|
|
|
|
|
|
|
|
| 24-Jul-03 |
277 |
|
|
|
|
|
|
|
|
|
|
|
|
|
|
|
|
|
|
|
| 25-Jul-03 |
254 |
|
|
|
|
|
|
|
|
|
|
|
|
|
|
|
|
|
|
|
| 26-Jul-03 |
244 |
|
|
|
|
|
|
|
|
|
|
|
|
|
|
|
|
|
|
|
| 27-Jul-03 |
244 |
|
|
|
|
|
|
|
|
|
|
|
|
|
|
|
|
|
|
|
| 28-Jul-03 |
229 |
|
|
|
|
|
|
|
|
|
|
|
|
|
|
|
|
|
|
|
| 29-Jul-03 |
238 |
|
|
|
|
|
|
|
|
|
|
|
|
|
|
|
|
|
|
|
| 30-Jul-03 |
238 |
|
|
|
|
|
|
|
|
|
|
|
|
|
|
|
|
|
|
|
| 31-Jul-03 |
259 |
|
|
|
|
|
|
|
|
|
|
|
|
|
|
|
|
|
|
|
| 1-Aug-03 |
274 |
|
|
|
|
|
|
|
|
|
|
|
|
|
|
|
|
|
|
|
| 2-Aug-03 |
301 |
|
|
|
|
|
|
|
|
|
|
|
|
|
|
|
|
|
|
|
| 3-Aug-03 |
293 |
|
|
|
|
|
|
|
|
|
|
|
|
|
|
|
|
|
|
|
| 4-Aug-03 |
292 |
|
|
|
|
|
|
|
|
|
|
|
|
|
|
|
|
|
|
|
| 5-Aug-03 |
277 |
|
|
|
|
|
|
|
|
|
|
|
|
|
|
|
|
|
|
|
| 6-Aug-03 |
265 |
|
|
|
|
|
|
|
|
|
|
|
|
|
|
|
|
|
|
|
| 7-Aug-03 |
260 |
|
|
|
|
|
|
|
|
|
|
|
|
|
|
|
|
|
|
|
| 8-Aug-03 |
247 |
|
|
|
|
|
|
|
|
|
|
|
|
|
|
|
|
|
|
|
| 9-Aug-03 |
240 |
|
|
|
|
|
|
|
|
|
|
|
|
|
|
|
|
|
|
|
| 10-Aug-03 |
238 |
|
|
|
|
|
|
|
|
|
|
|
|
|
|
|
|
|
|
|
| 11-Aug-03 |
231 |
|
|
|
|
|
|
|
|
|
|
|
|
|
|
|
|
|
|
|
| 12-Aug-03 |
226 |
|
|
|
|
|
|
|
|
|
|
|
|
|
|
|
|
|
|
|
| 13-Aug-03 |
218 |
|
|
|
|
|
|
|
|
|
|
|
|
|
|
|
|
|
|
|
| 14-Aug-03 |
238 |
|
|
|
|
|
|
|
|
|
|
|
|
|
|
|
|
|
|
|
| 15-Aug-03 |
238 |
|
|
|
|
|
|
|
|
|
|
|
|
|
|
|
|
|
|
|
| 16-Aug-03 |
255 |
|
|
|
|
|
|
|
|
|
|
|
|
|
|
|
|
|
|
|
| 17-Aug-03 |
240 |
|
|
|
|
|
|
|
|
|
|
|
|
|
|
|
|
|
|
|
| 18-Aug-03 |
241 |
|
|
|
|
|
|
|
|
|
|
|
|
|
|
|
|
|
|
|
| 19-Aug-03 |
237 |
|
|
|
|
|
|
|
|
|
|
|
|
|
|
|
|
|
|
|
| 20-Aug-03 |
236 |
|
|
|
|
|
|
|
|
|
|
|
|
|
|
|
|
|
|
|
| 21-Aug-03 |
242 |
|
|
|
|
|
|
|
|
|
|
|
|
|
|
|
|
|
|
|
| 22-Aug-03 |
225 |
|
|
|
|
|
|
|
|
|
|
|
|
|
|
|
|
|
|
|
| 23-Aug-03 |
221 |
|
|
|
|
|
|
|
|
|
|
|
|
|
|
|
|
|
|
|
| 24-Aug-03 |
211 |
|
|
|
|
|
|
|
|
|
|
|
|
|
|
|
|
|
|
|
| 25-Aug-03 |
216 |
|
|
|
|
|
|
|
|
|
|
|
|
|
|
|
|
|
|
|
| 26-Aug-03 |
202 |
|
|
|
|
|
|
|
|
|
|
|
|
|
|
|
|
|
|
|
| 27-Aug-03 |
197 |
|
|
|
|
|
|
|
|
|
|
|
|
|
|
|
|
|
|
|
| 28-Aug-03 |
203 |
|
|
|
|
|
|
|
|
|
|
|
|
|
|
|
|
|
|
|
| 29-Aug-03 |
185 |
|
|
|
|
|
|
|
|
|
|
|
|
|
|
|
|
|
|
|
| 30-Aug-03 |
210 |
|
|
|
|
|
|
|
|
|
|
|
|
|
|
|
|
|
|
|
| 31-Aug-03 |
210 |
|
|
|
|
|
|
|
|
|
|
|
|
|
|
|
|
|
|
|
| 1-Sep-03 |
207 |
|
|
|
|
|
|
|
|
|
|
|
|
|
|
|
|
|
|
|
| 2-Sep-03 |
176 |
|
|
|
|
|
|
|
|
|
|
|
|
|
|
|
|
|
|
|
| 3-Sep-03 |
148 |
|
|
|
|
|
|
|
|
|
|
|
|
|
|
|
|
|
|
|
| 4-Sep-03 |
137 |
|
|
|
|
|
|
|
|
|
|
|
|
|
|
|
|
|
|
|
| 5-Sep-03 |
122 |
|
|
|
|
|
|
|
|
|
|
|
|
|
|
|
|
|
|
|
| 6-Sep-03 |
124 |
|
|
|
|
|
|
|
|
|
|
|
|
|
|
|
|
|
|
|
| 7-Sep-03 |
125 |
|
|
|
|
|
|
|
|
|
|
|
|
|
|
|
|
|
|
|
| 8-Sep-03 |
173 |
|
|
|
|
|
|
|
|
|
|
|
|
|
|
|
|
|
|
|
| 9-Sep-03 |
180 |
|
|
|
|
|
|
|
|
|
|
|
|
|
|
|
|
|
|
|
| 10-Sep-03 |
220 |
|
|
|
|
|
|
|
|
|
|
|
|
|
|
|
|
|
|
|
| 11-Sep-03 |
217 |
|
|
|
|
|
|
|
|
|
|
|
|
|
|
|
|
|
|
|
| 12-Sep-03 |
223 |
|
|
|
|
|
|
|
|
|
|
|
|
|
|
|
|
|
|
|
| 13-Sep-03 |
213 |
|
|
|
|
|
|
|
|
|
|
|
|
|
|
|
|
|
|
|
| 14-Sep-03 |
201 |
|
|
|
|
|
|
|
|
|
|
|
|
|
|
|
|
|
|
|
| 15-Sep-03 |
187 |
|
|
|
|
|
|
|
|
|
|
|
|
|
|
|
|
|
|
|
| 16-Sep-03 |
187 |
|
|
|
|
|
|
|
|
|
|
|
|
|
|
|
|
|
|
|
| 17-Sep-03 |
194 |
|
|
|
|
|
|
|
|
|
|
|
|
|
|
|
|
|
|
|
| 18-Sep-03 |
194 |
|
|
|
|
|
|
|
|
|
|
|
|
|
|
|
|
|
|
|
| 19-Sep-03 |
201 |
|
|
|
|
|
|
|
|
|
|
|
|
|
|
|
|
|
|
|
| 20-Sep-03 |
201 |
|
|
|
|
|
|
|
|
|
|
|
|
|
|
|
|
|
|
|
| 21-Sep-03 |
199 |
|
|
|
|
|
|
|
|
|
|
|
|
|
|
|
|
|
|
|
| 22-Sep-03 |
206 |
|
|
|
|
|
|
|
|
|
|
|
|
|
|
|
|
|
|
|
| 23-Sep-03 |
209 |
|
|
|
|
|
|
|
|
|
|
|
|
|
|
|
|
|
|
|
| 24-Sep-03 |
214 |
|
|
|
|
|
|
|
|
|
|
|
|
|
|
|
|
|
|
|
| 25-Sep-03 |
204 |
|
|
|
|
|
|
|
|
|
|
|
|
|
|
|
|
|
|
|
| 26-Sep-03 |
218 |
|
|
|
|
|
|
|
|
|
|
|
|
|
|
|
|
|
|
|
| 27-Sep-03 |
221 |
|
|
|
|
|
|
|
|
|
|
|
|
|
|
|
|
|
|
|
| 28-Sep-03 |
230 |
|
|
|
|
|
|
|
|
|
|
|
|
|
|
|
|
|
|
|
| 29-Sep-03 |
222 |
|
|
|
|
|
|
|
|
|
|
|
|
|
|
|
|
|
|
|
| 30-Sep-03 |
214 |
|
|
|
|
|
|
|
|
|
|
|
|
|
|
|
|
|
|
|
| 1-Oct-03 |
199 |
|
|
|
|
|
|
|
|
|
|
|
|
|
|
|
|
|
|
|
| 2-Oct-03 |
199 |
|
|
|
|
|
|
|
|
|
|
|
|
|
|
|
|
|
|
|
| 3-Oct-03 |
210 |
|
|
|
|
|
|
|
|
|
|
|
|
|
|
|
|
|
|
|
| 4-Oct-03 |
214 |
|
|
|
|
|
|
|
|
|
|
|
|
|
|
|
|
|
|
|
| 5-Oct-03 |
229 |
|
|
|
|
|
|
|
|
|
|
|
|
|
|
|
|
|
|
|
| 6-Oct-03 |
231 |
|
|
|
|
|
|
|
|
|
|
|
|
|
|
|
|
|
|
|
| 7-Oct-03 |
231 |
|
|
|
|
|
|
|
|
|
|
|
|
|
|
|
|
|
|
|
| 8-Oct-03 |
203 |
|
|
|
|
|
|
|
|
|
|
|
|
|
|
|
|
|
|
|
| 9-Oct-03 |
188 |
|
|
|
|
|
|
|
|
|
|
|
|
|
|
|
|
|
|
|
| 10-Oct-03 |
147 |
|
|
|
|
|
|
|
|
|
|
|
|
|
|
|
|
|
|
|
| 11-Oct-03 |
147 |
|
|
|
|
|
|
|
|
|
|
|
|
|
|
|
|
|
|
|
| 12-Oct-03 |
186 |
|
|
|
|
|
|
|
|
|
|
|
|
|
|
|
|
|
|
|
| 13-Oct-03 |
183 |
|
|
|
|
|
|
|
|
|
|
|
|
|
|
|
|
|
|
|
| 14-Oct-03 |
194 |
|
|
|
|
|
|
|
|
|
|
|
|
|
|
|
|
|
|
|
| 15-Oct-03 |
193 |
|
|
|
|
|
|
|
|
|
|
|
|
|
|
|
|
|
|
|
| 16-Oct-03 |
177 |
|
|
|
|
|
|
|
|
|
|
|
|
|
|
|
|
|
|
|
| 17-Oct-03 |
181 |
|
|
|
|
|
|
|
|
|
|
|
|
|
|
|
|
|
|
|
| 18-Oct-03 |
181 |
|
|
|
|
|
|
|
|
|
|
|
|
|
|
|
|
|
|
|
| 19-Oct-03 |
193 |
|
|
|
|
|
|
|
|
|
|
|
|
|
|
|
|
|
|
|
| 20-Oct-03 |
209 |
|
|
|
|
|
|
|
|
|
|
|
|
|
|
|
|
|
|
|
| 21-Oct-03 |
217 |
|
|
|
|
|
|
|
|
|
|
|
|
|
|
|
|
|
|
|
| 22-Oct-03 |
216 |
|
|
|
|
|
|
|
|
|
|
|
|
|
|
|
|
|
|
|
| 23-Oct-03 |
221 |
|
|
|
|
|
|
|
|
|
|
|
|
|
|
|
|
|
|
|
| 24-Oct-03 |
209 |
|
|
|
|
|
|
|
|
|
|
|
|
|
|
|
|
|
|
|
| 25-Oct-03 |
210 |
|
|
|
|
|
|
|
|
|
|
|
|
|
|
|
|
|
|
|
| 26-Oct-03 |
199 |
|
|
|
|
|
|
|
|
|
|
|
|
|
|
|
|
|
|
|
| 27-Oct-03 |
172 |
|
|
|
|
|
|
|
|
|
|
|
|
|
|
|
|
|
|
|
| 28-Oct-03 |
178 |
|
|
|
|
|
|
|
|
|
|
|
|
|
|
|
|
|
|
|
| 29-Oct-03 |
188 |
|
|
|
|
|
|
|
|
|
|
|
|
|
|
|
|
|
|
|
| 30-Oct-03 |
193 |
|
|
|
|
|
|
|
|
|
|
|
|
|
|
|
|
|
|
|
| 31-Oct-03 |
215 |
|
|
|
|
|
|
|
|
|
|
|
|
|
|
|
|
|
|
|
| 1-Nov-03 |
214 |
|
|
|
|
|
|
|
|
|
|
|
|
|
|
|
|
|
|
|
| 2-Nov-03 |
|
|
|
|
|
|
|
|
|
|
|
|
|
|
|
|
|
|
|
|
| 3-Nov-03 |
|
|
|
|
|
|
|
|
|
|
|
|
|
|
|
|
|
|
|
|
| 4-Nov-03 |
|
|
|
|
|
|
|
|
|
|
|
|
|
|
|
|
|
|
|
|
| 5-Nov-03 |
|
|
|
|
|
|
|
|
|
|
|
|
|
|
|
|
|
|
|
|
| 6-Nov-03 |
|
|
|
|
|
|
|
|
|
|
|
|
|
|
|
|
|
|
|
|
| 7-Nov-03 |
173 |
|
|
|
|
|
|
|
|
|
|
|
|
|
|
|
|
|
|
|
| 8-Nov-03 |
173 |
|
|
|
|
|
|
|
|
|
|
|
|
|
|
|
|
|
|
|
| 9-Nov-03 |
196 |
|
|
|
|
|
|
|
|
|
|
|
|
|
|
|
|
|
|
|
| 10-Nov-03 |
196 |
|
|
|
|
|
|
|
|
|
|
|
|
|
|
|
|
|
|
|
| 11-Nov-03 |
216 |
|
|
|
|
|
|
|
|
|
|
|
|
|
|
|
|
|
|
|
| 12-Nov-03 |
218 |
|
|
|
|
|
|
|
|
|
|
|
|
|
|
|
|
|
|
|
| 13-Nov-03 |
180 |
|
|
|
|
|
|
|
|
|
|
|
|
|
|
|
|
|
|
|
| 14-Nov-03 |
180 |
|
|
|
|
|
|
|
|
|
|
|
|
|
|
|
|
|
|
|
| 15-Nov-03 |
147 |
|
|
|
|
|
|
|
|
|
|
|
|
|
|
|
|
|
|
|
| 16-Nov-03 |
172 |
|
|
|
|
|
|
|
|
|
|
|
|
|
|
|
|
|
|
|
| 17-Nov-03 |
195 |
|
|
|
|
|
|
|
|
|
|
|
|
|
|
|
|
|
|
|
| 18-Nov-03 |
211 |
|
|
|
|
|
|
|
|
|
|
|
|
|
|
|
|
|
|
|
| 19-Nov-03 |
211 |
|
|
|
|
|
|
|
|
|
|
|
|
|
|
|
|
|
|
|
| 20-Nov-03 |
233 |
|
|
|
|
|
|
|
|
|
|
|
|
|
|
|
|
|
|
|
| 21-Nov-03 |
184 |
|
|
|
|
|
|
|
|
|
|
|
|
|
|
|
|
|
|
|
| 22-Nov-03 |
163 |
|
|
|
|
|
|
|
|
|
|
|
|
|
|
|
|
|
|
|
| 23-Nov-03 |
182 |
|
|
|
|
|
|
|
|
|
|
|
|
|
|
|
|
|
|
|
| 24-Nov-03 |
163 |
|
|
|
|
|
|
|
|
|
|
|
|
|
|
|
|
|
|
|
| 25-Nov-03 |
205 |
|
|
|
|
|
|
|
|
|
|
|
|
|
|
|
|
|
|
|
| 26-Nov-03 |
227 |
|
|
|
|
|
|
|
|
|
|
|
|
|
|
|
|
|
|
|
| 27-Nov-03 |
218 |
|
|
|
|
|
|
|
|
|
|
|
|
|
|
|
|
|
|
|
| 28-Nov-03 |
218 |
|
|
|
|
|
|
|
|
|
|
|
|
|
|
|
|
|
|
|
| 29-Nov-03 |
228 |
|
|
|
|
|
|
|
|
|
|
|
|
|
|
|
|
|
|
|
| 30-Nov-03 |
210 |
|
|
|
|
|
|
|
|
|
|
|
|
|
|
|
|
|
|
|
| 1-Dec-03 |
203 |
|
|
|
|
|
|
|
|
|
|
|
|
|
|
|
|
|
|
|
| 2-Dec-03 |
198 |
|
|
|
|
|
|
|
|
|
|
|
|
|
|
|
|
|
|
|
| 3-Dec-03 |
184 |
|
|
|
|
|
|
|
|
|
|
|
|
|
|
|
|
|
|
|
| 4-Dec-03 |
233 |
|
|
|
|
|
|
|
|
|
|
|
|
|
|
|
|
|
|
|
| 5-Dec-03 |
233 |
|
|
|
|
|
|
|
|
|
|
|
|
|
|
|
|
|
|
|
| 6-Dec-03 |
254 |
|
|
|
|
|
|
|
|
|
|
|
|
|
|
|
|
|
|
|
| 7-Dec-03 |
236 |
|
|
|
|
|
|
|
|
|
|
|
|
|
|
|
|
|
|
|
| 8-Dec-03 |
202 |
|
|
|
|
|
|
|
|
|
|
|
|
|
|
|
|
|
|
|
| 9-Dec-03 |
218 |
|
|
|
|
|
|
|
|
|
|
|
|
|
|
|
|
|
|
|
| 10-Dec-03 |
214 |
|
|
|
|
|
|
|
|
|
|
|
|
|
|
|
|
|
|
|
| 11-Dec-03 |
215 |
|
|
|
|
|
|
|
|
|
|
|
|
|
|
|
|
|
|
|
| 12-Dec-03 |
233 |
|
|
|
|
|
|
|
|
|
|
|
|
|
|
|
|
|
|
|
| 13-Dec-03 |
194 |
|
|
|
|
|
|
|
|
|
|
|
|
|
|
|
|
|
|
|
| 14-Dec-03 |
194 |
|
|
|
|
|
|
|
|
|
|
|
|
|
|
|
|
|
|
|
| 15-Dec-03 |
198 |
|
|
|
|
|
|
|
|
|
|
|
|
|
|
|
|
|
|
|
| 16-Dec-03 |
193 |
|
|
|
|
|
|
|
|
|
|
|
|
|
|
|
|
|
|
|
| 17-Dec-03 |
197 |
|
|
|
|
|
|
|
|
|
|
|
|
|
|
|
|
|
|
|
| 18-Dec-03 |
208 |
|
|
|
|
|
|
|
|
|
|
|
|
|
|
|
|
|
|
|
| 19-Dec-03 |
207 |
|
|
|
|
|
|
|
|
|
|
|
|
|
|
|
|
|
|
|
| 20-Dec-03 |
231 |
|
|
|
|
|
|
|
|
|
|
|
|
|
|
|
|
|
|
|
| 21-Dec-03 |
231 |
|
|
|
|
|
|
|
|
|
|
|
|
|
|
|
|
|
|
|
| 22-Dec-03 |
216 |
|
|
|
|
|
|
|
|
|
|
|
|
|
|
|
|
|
|
|
| 23-Dec-03 |
202 |
|
|
|
|
|
|
|
|
|
|
|
|
|
|
|
|
|
|
|
| 24-Dec-03 |
198 |
|
|
|
|
|
|
|
|
|
|
|
|
|
|
|
|
|
|
|
| 25-Dec-03 |
185 |
|
|
|
|
|
|
|
|
|
|
|
|
|
|
|
|
|
|
|
| 26-Dec-03 |
181 |
|
|
|
|
|
|
|
|
|
|
|
|
|
|
|
|
|
|
|
| 27-Dec-03 |
189 |
|
|
|
|
|
|
|
|
|
|
|
|
|
|
|
|
|
|
|
| 28-Dec-03 |
174 |
|
|
|
|
|
|
|
|
|
|
|
|
|
|
|
|
|
|
|
| 29-Dec-03 |
191 |
|
|
|
|
|
|
|
|
|
|
|
|
|
|
|
|
|
|
|
| 30-Dec-03 |
191 |
|
|
|
|
|
|
|
|
|
|
|
|
|
|
|
|
|
|
|
| 31-Dec-03 |
162 |
|
|
|
|
|
|
|
|
|
|
|
|
|
|
|
|
|
|
|
| 1-Jan-04 |
145 |
|
|
|
|
|
|
|
|
|
|
|
|
|
|
|
|
|
|
|
| 2-Jan-04 |
128 |
|
|
|
|
|
|
|
|
|
|
|
|
|
|
|
|
|
|
|
| 3-Jan-04 |
139 |
|
|
|
|
|
|
|
|
|
|
|
|
|
|
|
|
|
|
|
| 4-Jan-04 |
137 |
|
|
|
|
|
|
|
|
|
|
|
|
|
|
|
|
|
|
|
| 5-Jan-04 |
211 |
|
|
|
|
|
|
|
|
|
|
|
|
|
|
|
|
|
|
|
| 6-Jan-04 |
211 |
|
|
|
|
|
|
|
|
|
|
|
|
|
|
|
|
|
|
|
| 7-Jan-04 |
223 |
|
|
|
|
|
|
|
|
|
|
|
|
|
|
|
|
|
|
|
| 8-Jan-04 |
219 |
|
|
|
|
|
|
|
|
|
|
|
|
|
|
|
|
|
|
|
| 9-Jan-04 |
206 |
|
|
|
|
|
|
|
|
|
|
|
|
|
|
|
|
|
|
|
| 10-Jan-04 |
209 |
|
|
|
|
|
|
|
|
|
|
|
|
|
|
|
|
|
|
|
| 11-Jan-04 |
216 |
|
|
|
|
|
|
|
|
|
|
|
|
|
|
|
|
|
|
|
| 12-Jan-04 |
226 |
|
|
|
|
|
|
|
|
|
|
|
|
|
|
|
|
|
|
|
| 13-Jan-04 |
227 |
|
|
|
|
|
|
|
|
|
|
|
|
|
|
|
|
|
|
|
| 14-Jan-04 |
215 |
|
|
|
|
|
|
|
|
|
|
|
|
|
|
|
|
|
|
|
| 15-Jan-04 |
204 |
|
|
|
|
|
|
|
|
|
|
|
|
|
|
|
|
|
|
|
| 16-Jan-04 |
202 |
|
|
|
|
|
|
|
|
|
|
|
|
|
|
|
|
|
|
|
| 17-Jan-04 |
202 |
|
|
|
|
|
|
|
|
|
|
|
|
|
|
|
|
|
|
|
| 18-Jan-04 |
209 |
|
|
|
|
|
|
|
|
|
|
|
|
|
|
|
|
|
|
|
| 19-Jan-04 |
221 |
|
|
|
|
|
|
|
|
|
|
|
|
|
|
|
|
|
|
|
| 20-Jan-04 |
215 |
|
|
|
|
|
|
|
|
|
|
|
|
|
|
|
|
|
|
|
| 21-Jan-04 |
196 |
|
|
|
|
|
|
|
|
|
|
|
|
|
|
|
|
|
|
|
| 22-Jan-04 |
196 |
|
|
|
|
|
|
|
|
|
|
|
|
|
|
|
|
|
|
|
| 23-Jan-04 |
203 |
|
|
|
|
|
|
|
|
|
|
|
|
|
|
|
|
|
|
|
| 24-Jan-04 |
334 |
|
|
|
|
|
|
|
|
|
|
|
|
|
|
|
|
|
|
|
| 25-Jan-04 |
325 |
|
|
|
|
|
|
|
|
|
|
|
|
|
|
|
|
|
|
|
| 26-Jan-04 |
274 |
|
|
|
|
|
|
|
|
|
|
|
|
|
|
|
|
|
|
|
| 27-Jan-04 |
286 |
|
|
|
|
|
|
|
|
|
|
|
|
|
|
|
|
|
|
|
| 28-Jan-04 |
122 |
|
|
|
|
|
|
|
|
|
|
|
|
|
|
|
|
|
|
|
| 29-Jan-04 |
122 |
|
|
|
|
|
|
|
|
|
|
|
|
|
|
|
|
|
|
|
| 30-Jan-04 |
153 |
|
|
|
|
|
|
|
|
|
|
|
|
|
|
|
|
|
|
|
| 31-Jan-04 |
162 |
|
|
|
|
|
|
|
|
|
|
|
|
|
|
|
|
|
|
|
| 1-Feb-04 |
204 |
|
|
|
|
|
|
|
|
|
|
|
|
|
|
|
|
|
|
|
| 2-Feb-04 |
220 |
|
|
|
|
|
|
|
|
|
|
|
|
|
|
|
|
|
|
|
| 3-Feb-04 |
225 |
|
|
|
|
|
|
|
|
|
|
|
|
|
|
|
|
|
|
|
| 4-Feb-04 |
233 |
|
|
|
|
|
|
|
|
|
|
|
|
|
|
|
|
|
|
|
| 5-Feb-04 |
238 |
|
|
|
|
|
|
|
|
|
|
|
|
|
|
|
|
|
|
|
| 6-Feb-04 |
215 |
|
|
|
|
|
|
|
|
|
|
|
|
|
|
|
|
|
|
|
| 7-Feb-04 |
215 |
|
|
|
|
|
|
|
|
|
|
|
|
|
|
|
|
|
|
|
| 8-Feb-04 |
203 |
|
|
|
|
|
|
|
|
|
|
|
|
|
|
|
|
|
|
|
| 9-Feb-04 |
181 |
|
|
|
|
|
|
|
|
|
|
|
|
|
|
|
|
|
|
|
| 10-Feb-04 |
186 |
|
|
|
|
|
|
|
|
|
|
|
|
|
|
|
|
|
|
|
| 11-Feb-04 |
186 |
|
|
|
|
|
|
|
|
|
|
|
|
|
|
|
|
|
|
|
| 12-Feb-04 |
180 |
|
|
|
|
|
|
|
|
|
|
|
|
|
|
|
|
|
|
|
| 13-Feb-04 |
201 |
|
|
|
|
|
|
|
|
|
|
|
|
|
|
|
|
|
|
|
| 14-Feb-04 |
193 |
|
|
|
|
|
|
|
|
|
|
|
|
|
|
|
|
|
|
|
| 15-Feb-04 |
170 |
|
|
|
|
|
|
|
|
|
|
|
|
|
|
|
|
|
|
|
| 16-Feb-04 |
170 |
|
|
|
|
|
|
|
|
|
|
|
|
|
|
|
|
|
|
|
| 17-Feb-04 |
188 |
|
|
|
|
|
|
|
|
|
|
|
|
|
|
|
|
|
|
|
| 18-Feb-04 |
152 |
|
|
|
|
|
|
|
|
|
|
|
|
|
|
|
|
|
|
|
| 19-Feb-04 |
157 |
|
|
|
|
|
|
|
|
|
|
|
|
|
|
|
|
|
|
|
| 20-Feb-04 |
166 |
|
|
|
|
|
|
|
|
|
|
|
|
|
|
|
|
|
|
|
| 21-Feb-04 |
133 |
|
|
|
|
|
|
|
|
|
|
|
|
|
|
|
|
|
|
|
| 22-Feb-04 |
200 |
|
|
|
|
|
|
|
|
|
|
|
|
|
|
|
|
|
|
|
| 23-Feb-04 |
200 |
|
|
|
|
|
|
|
|
|
|
|
|
|
|
|
|
|
|
|
| 24-Feb-04 |
224 |
|
|
|
|
|
|
|
|
|
|
|
|
|
|
|
|
|
|
|
| 25-Feb-04 |
217 |
|
|
|
|
|
|
|
|
|
|
|
|
|
|
|
|
|
|
|
| 26-Feb-04 |
216 |
|
|
|
|
|
|
|
|
|
|
|
|
|
|
|
|
|
|
|
| 27-Feb-04 |
218 |
|
|
|
|
|
|
|
|
|
|
|
|
|
|
|
|
|
|
|
| 28-Feb-04 |
214 |
|
|
|
|
|
|
|
|
|
|
|
|
|
|
|
|
|
|
|
| 29-Feb-04 |
253 |
|
|
|
|
|
|
|
|
|
|
|
|
|
|
|
|
|
|
|
| 1-Mar-04 |
271 |
|
|
|
|
|
|
|
|
|
|
|
|
|
|
|
|
|
|
|
| 2-Mar-04 |
292 |
|
|
|
|
|
|
|
|
|
|
|
|
|
|
|
|
|
|
|
| 3-Mar-04 |
292 |
|
|
|
|
|
|
|
|
|
|
|
|
|
|
|
|
|
|
|
| 4-Mar-04 |
287 |
|
|
|
|
|
|
|
|
|
|
|
|
|
|
|
|
|
|
|
| 5-Mar-04 |
276 |
|
|
|
|
|
|
|
|
|
|
|
|
|
|
|
|
|
|
|
| 6-Mar-04 |
281 |
|
|
|
|
|
|
|
|
|
|
|
|
|
|
|
|
|
|
|
| 7-Mar-04 |
254 |
|
|
|
|
|
|
|
|
|
|
|
|
|
|
|
|
|
|
|
| 8-Mar-04 |
229 |
|
|
|
|
|
|
|
|
|
|
|
|
|
|
|
|
|
|
|
| 9-Mar-04 |
351 |
|
|
|
|
|
|
|
|
|
|
|
|
|
|
|
|
|
|
|
| 10-Mar-04 |
351 |
|
|
|
|
|
|
|
|
|
|
|
|
|
|
|
|
|
|
|
| 11-Mar-04 |
564 |
|
|
|
|
|
|
|
|
|
|
|
|
|
|
|
|
|
|
|
| 12-Mar-04 |
498 |
|
|
|
|
|
|
|
|
|
|
|
|
|
|
|
|
|
|
|
| 13-Mar-04 |
431 |
|
|
|
|
|
|
|
|
|
|
|
|
|
|
|
|
|
|
|
| 14-Mar-04 |
421 |
|
|
|
|
|
|
|
|
|
|
|
|
|
|
|
|
|
|
|
| 15-Mar-04 |
364 |
|
|
|
|
|
|
|
|
|
|
|
|
|
|
|
|
|
|
|
| 16-Mar-04 |
443 |
|
|
|
|
|
|
|
|
|
|
|
|
|
|
|
|
|
|
|
| 17-Mar-04 |
498 |
|
|
|
|
|
|
|
|
|
|
|
|
|
|
|
|
|
|
|
| 18-Mar-04 |
666 |
|
|
|
|
|
|
|
|
|
|
|
|
|
|
|
|
|
|
|
| 19-Mar-04 |
666 |
|
|
|
|
|
|
|
|
|
|
|
|
|
|
|
|
|
|
|
| 20-Mar-04 |
895 |
|
|
|
|
|
|
|
|
|
|
|
|
|
|
|
|
|
|
|
| 21-Mar-04 |
1046 |
|
|
|
|
|
|
|
|
|
|
|
|
|
|
|
|
|
|
|
| 22-Mar-04 |
1212 |
|
|
|
|
|
|
|
|
|
|
|
|
|
|
|
|
|
|
|
| 23-Mar-04 |
1264 |
|
|
|
|
|
|
|
|
|
|
|
|
|
|
|
|
|
|
|
| 24-Mar-04 |
1363 |
|
|
|
|
|
|
|
|
|
|
|
|
|
|
|
|
|
|
|
| 25-Mar-04 |
1205 |
|
|
|
|
|
|
|
|
|
|
|
|
|
|
|
|
|
|
|
| 26-Mar-04 |
1205 |
|
|
|
|
|
|
|
|
|
|
|
|
|
|
|
|
|
|
|
| 27-Mar-04 |
1176 |
|
|
|
|
|
|
|
|
|
|
|
|
|
|
|
|
|
|
|
| 28-Mar-04 |
1346 |
|
|
|
|
|
|
|
|
|
|
|
|
|
|
|
|
|
|
|
| 29-Mar-04 |
1220 |
|
|
|
|
|
|
|
|
|
|
|
|
|
|
|
|
|
|
|
| 30-Mar-04 |
1357 |
|
|
|
|
|
|
|
|
|
|
|
|
|
|
|
|
|
|
|
| 31-Mar-04 |
1374 |
|
|
|
|
|
|
|
|
|
|
|
|
|
|
|
|
|
|
|
| 1-Apr-04 |
1280 |
|
|
|
|
|
|
|
|
|
|
|
|
|
|
|
|
|
|
|
| 2-Apr-04 |
1594 |
|
|
|
|
|
|
|
|
|
|
|
|
|
|
|
|
|
|
|
| 3-Apr-04 |
1414 |
|
|
|
|
|
|
|
|
|
|
|
|
|
|
|
|
|
|
|
| 4-Apr-04 |
1491 |
|
|
|
|
|
|
|
|
|
|
|
|
|
|
|
|
|
|
|
| 5-Apr-04 |
1615 |
|
|
|
|
|
|
|
|
|
|
|
|
|
|
|
|
|
|
|
| 6-Apr-04 |
1527 |
|
|
|
|
|
|
|
|
|
|
|
|
|
|
|
|
|
|
|
| 7-Apr-04 |
1568 |
|
|
|
|
|
|
|
|
|
|
|
|
|
|
|
|
|
|
|
| 8-Apr-04 |
1514 |
|
|
|
|
|
|
|
|
|
|
|
|
|
|
|
|
|
|
|
| 9-Apr-04 |
1373 |
|
|
|
|
|
|
|
|
|
|
|
|
|
|
|
|
|
|
|
| 10-Apr-04 |
1383 |
|
|
|
|
|
|
|
|
|
|
|
|
|
|
|
|
|
|
|
| 11-Apr-04 |
1383 |
|
|
|
|
|
|
|
|
|
|
|
|
|
|
|
|
|
|
|
| 12-Apr-04 |
1497 |
|
|
|
|
|
|
|
|
|
|
|
|
|
|
|
|
|
|
|
| 13-Apr-04 |
1554 |
|
|
|
|
|
|
|
|
|
|
|
|
|
|
|
|
|
|
|
| 14-Apr-04 |
1650 |
|
|
|
|
|
|
|
|
|
|
|
|
|
|
|
|
|
|
|
| 15-Apr-04 |
1669 |
|
|
|
|
|
|
|
|
|
|
|
|
|
|
|
|
|
|
|
| 16-Apr-04 |
1653 |
|
|
|
|
|
|
|
|
|
|
|
|
|
|
|
|
|
|
|
| 17-Apr-04 |
1613 |
|
|
|
|
|
|
|
|
|
|
|
|
|
|
|
|
|
|
|
| 18-Apr-04 |
1634 |
|
|
|
|
|
|
|
|
|
|
|
|
|
|
|
|
|
|
|
| 19-Apr-04 |
1545 |
|
|
|
|
|
|
|
|
|
|
|
|
|
|
|
|
|
|
|
| 20-Apr-04 |
1556 |
|
|
|
|
|
|
|
|
|
|
|
|
|
|
|
|
|
|
|
| 21-Apr-04 |
1447 |
|
|
|
|
|
|
|
|
|
|
|
|
|
|
|
|
|
|
|
| 22-Apr-04 |
1526 |
|
|
|
|
|
|
|
|
|
|
|
|
|
|
|
|
|
|
|
| 23-Apr-04 |
1518 |
|
|
|
|
|
|
|
|
|
|
|
|
|
|
|
|
|
|
|
| 24-Apr-04 |
1543 |
|
|
|
|
|
|
|
|
|
|
|
|
|
|
|
|
|
|
|
| 25-Apr-04 |
1703 |
|
|
|
|
|
|
|
|
|
|
|
|
|
|
|
|
|
|
|
| 26-Apr-04 |
1681 |
|
|
|
|
|
|
|
|
|
|
|
|
|
|
|
|
|
|
|
| 27-Apr-04 |
1681 |
|
|
|
|
|
|
|
|
|
|
|
|
|
|
|
|
|
|
|
| 28-Apr-04 |
1623 |
|
|
|
|
|
|
|
|
|
|
|
|
|
|
|
|
|
|
|
| 29-Apr-04 |
1624 |
|
|
|
|
|
|
|
|
|
|
|
|
|
|
|
|
|
|
|
| 30-Apr-04 |
1584 |
|
|
|
|
|
|
|
|
|
|
|
|
|
|
|
|
|
|
|
| 1-May-04 |
1532 |
|
|
|
|
|
|
|
|
|
|
|
|
|
|
|
|
|
|
|
| 2-May-04 |
1523 |
|
|
|
|
|
|
|
|
|
|
|
|
|
|
|
|
|
|
|
| 3-May-04 |
1464 |
|
|
|
|
|
|
|
|
|
|
|
|
|
|
|
|
|
|
|
| 4-May-04 |
1398 |
|
|
|
|
|
|
|
|
|
|
|
|
|
|
|
|
|
|
|
| 5-May-04 |
1301 |
|
|
|
|
|
|
|
|
|
|
|
|
|
|
|
|
|
|
|
| 6-May-04 |
1301 |
|
|
|
|
|
|
|
|
|
|
|
|
|
|
|
|
|
|
|
| 7-May-04 |
1440 |
|
|
|
|
|
|
|
|
|
|
|
|
|
|
|
|
|
|
|
| 8-May-04 |
1460 |
|
|
|
|
|
|
|
|
|
|
|
|
|
|
|
|
|
|
|
| 9-May-04 |
1570 |
|
|
|
|
|
|
|
|
|
|
|
|
|
|
|
|
|
|
|
| 10-May-04 |
1472 |
|
|
|
|
|
|
|
|
|
|
|
|
|
|
|
|
|
|
|
| 11-May-04 |
1388 |
|
|
|
|
|
|
|
|
|
|
|
|
|
|
|
|
|
|
|
| 12-May-04 |
1307 |
|
|
|
|
|
|
|
|
|
|
|
|
|
|
|
|
|
|
|
| 13-May-04 |
1307 |
|
|
|
|
|
|
|
|
|
|
|
|
|
|
|
|
|
|
|
| 14-May-04 |
1210 |
|
|
|
|
|
|
|
|
|
|
|
|
|
|
|
|
|
|
|
| 15-May-04 |
1310 |
|
|
|
|
|
|
|
|
|
|
|
|
|
|
|
|
|
|
|
| 16-May-04 |
1380 |
|
|
|
|
|
|
|
|
|
|
|
|
|
|
|
|
|
|
|
| 17-May-04 |
1327 |
|
|
|
|
|
|
|
|
|
|
|
|
|
|
|
|
|
|
|
| 18-May-04 |
1404 |
|
|
|
|
|
|
|
|
|
|
|
|
|
|
|
|
|
|
|
| 19-May-04 |
1286 |
|
|
|
|
|
|
|
|
|
|
|
|
|
|
|
|
|
|
|
| 20-May-04 |
1155 |
|
|
|
|
|
|
|
|
|
|
|
|
|
|
|
|
|
|
|
| 21-May-04 |
1173 |
|
|
|
|
|
|
|
|
|
|
|
|
|
|
|
|
|
|
|
| 22-May-04 |
1173 |
|
|
|
|
|
|
|
|
|
|
|
|
|
|
|
|
|
|
|
| 23-May-04 |
1074 |
|
|
|
|
|
|
|
|
|
|
|
|
|
|
|
|
|
|
|
| 24-May-04 |
1025 |
|
|
|
|
|
|
|
|
|
|
|
|
|
|
|
|
|
|
|
| 25-May-04 |
940 |
|
|
|
|
|
|
|
|
|
|
|
|
|
|
|
|
|
|
|
| 26-May-04 |
992 |
|
|
|
|
|
|
|
|
|
|
|
|
|
|
|
|
|
|
|
| 27-May-04 |
1013 |
|
|
|
|
|
|
|
|
|
|
|
|
|
|
|
|
|
|
|
| 28-May-04 |
1033 |
|
|
|
|
|
|
|
|
|
|
|
|
|
|
|
|
|
|
|
| 29-May-04 |
1033 |
|
|
|
|
|
|
|
|
|
|
|
|
|
|
|
|
|
|
|
| 30-May-04 |
946 |
|
|
|
|
|
|
|
|
|
|
|
|
|
|
|
|
|
|
|
| 31-May-04 |
925 |
|
|
|
|
|
|
|
|
|
|
|
|
|
|
|
|
|
|
|
| 1-Jun-04 |
909 |
|
|
|
|
|
|
|
|
|
|
|
|
|
|
|
|
|
|
|
| 2-Jun-04 |
894 |
|
|
|
|
|
|
|
|
|
|
|
|
|
|
|
|
|
|
|
| 3-Jun-04 |
882 |
|
|
|
|
|
|
|
|
|
|
|
|
|
|
|
|
|
|
|
| 4-Jun-04 |
824 |
|
|
|
|
|
|
|
|
|
|
|
|
|
|
|
|
|
|
|
| 5-Jun-04 |
780 |
|
|
|
|
|
|
|
|
|
|
|
|
|
|
|
|
|
|
|
| 6-Jun-04 |
710 |
|
|
|
|
|
|
|
|
|
|
|
|
|
|
|
|
|
|
|
| 7-Jun-04 |
710 |
|
|
|
|
|
|
|
|
|
|
|
|
|
|
|
|
|
|
|
| 8-Jun-04 |
725 |
|
|
|
|
|
|
|
|
|
|
|
|
|
|
|
|
|
|
|
| 9-Jun-04 |
710 |
|
|
|
|
|
|
|
|
|
|
|
|
|
|
|
|
|
|
|
| 10-Jun-04 |
713 |
|
|
|
|
|
|
|
|
|
|
|
|
|
|
|
|
|
|
|
| 11-Jun-04 |
660 |
|
|
|
|
|
|
|
|
|
|
|
|
|
|
|
|
|
|
|
| 12-Jun-04 |
620 |
|
|
|
|
|
|
|
|
|
|
|
|
|
|
|
|
|
|
|
| 13-Jun-04 |
523 |
|
|
|
|
|
|
|
|
|
|
|
|
|
|
|
|
|
|
|
| 14-Jun-04 |
523 |
|
|
|
|
|
|
|
|
|
|
|
|
|
|
|
|
|
|
|
| 15-Jun-04 |
508 |
|
|
|
|
|
|
|
|
|
|
|
|
|
|
|
|
|
|
|
| 16-Jun-04 |
508 |
|
|
|
|
|
|
|
|
|
|
|
|
|
|
|
|
|
|
|
| 17-Jun-04 |
512 |
|
|
|
|
|
|
|
|
|
|
|
|
|
|
|
|
|
|
|
| 18-Jun-04 |
497 |
|
|
|
|
|
|
|
|
|
|
|
|
|
|
|
|
|
|
|
| 19-Jun-04 |
|
|
|
|
|
|
|
|
|
|
|
|
|
|
|
|
|
|
|
|
| 20-Jun-04 |
485 |
|
|
|
|
|
|
|
|
|
|
|
|
|
|
|
|
|
|
|
| 21-Jun-04 |
485 |
|
|
|
|
|
|
|
|
|
|
|
|
|
|
|
|
|
|
|
| 22-Jun-04 |
486 |
|
|
|
|
|
|
|
|
|
|
|
|
|
|
|
|
|
|
|
| 23-Jun-04 |
486 |
|
|
|
|
|
|
|
|
|
|
|
|
|
|
|
|
|
|
|
| 24-Jun-04 |
432 |
|
|
|
|
|
|
|
|
|
|
|
|
|
|
|
|
|
|
|
| 25-Jun-04 |
428 |
|
|
|
|
|
|
|
|
|
|
|
|
|
|
|
|
|
|
|
| 26-Jun-04 |
401 |
|
|
|
|
|
|
|
|
|
|
|
|
|
|
|
|
|
|
|
| 27-Jun-04 |
400 |
|
|
|
|
|
|
|
|
|
|
|
|
|
|
|
|
|
|
|
| 28-Jun-04 |
410 |
|
|
|
|
|
|
|
|
|
|
|
|
|
|
|
|
|
|
|
| 29-Jun-04 |
366 |
|
|
|
|
|
|
|
|
|
|
|
|
|
|
|
|
|
|
|
| 30-Jun-04 |
366 |
|
|
|
|
|
|
|
|
|
|
|
|
|
|
|
|
|
|
|
| 1-Jul-04 |
381 |
|
|
|
|
|
|
|
|
|
|
|
|
|
|
|
|
|
|
|
| 2-Jul-04 |
394 |
|
|
|
|
|
|
|
|
|
|
|
|
|
|
|
|
|
|
|
| 3-Jul-04 |
420 |
|
|
|
|
|
|
|
|
|
|
|
|
|
|
|
|
|
|
|
| 4-Jul-04 |
403 |
|
|
|
|
|
|
|
|
|
|
|
|
|
|
|
|
|
|
|
| 5-Jul-04 |
395 |
|
|
|
|
|
|
|
|
|
|
|
|
|
|
|
|
|
|
|
| 6-Jul-04 |
357 |
|
|
|
|
|
|
|
|
|
|
|
|
|
|
|
|
|
|
|
| 7-Jul-04 |
331 |
|
|
|
|
|
|
|
|
|
|
|
|
|
|
|
|
|
|
|
| 8-Jul-04 |
331 |
|
|
|
|
|
|
|
|
|
|
|
|
|
|
|
|
|
|
|
| 9-Jul-04 |
331 |
|
|
|
|
|
|
|
|
|
|
|
|
|
|
|
|
|
|
|
| 10-Jul-04 |
347 |
|
|
|
|
|
|
|
|
|
|
|
|
|
|
|
|
|
|
|
| 11-Jul-04 |
331 |
|
|
|
|
|
|
|
|
|
|
|
|
|
|
|
|
|
|
|
| 12-Jul-04 |
319 |
|
|
|
|
|
|
|
|
|
|
|
|
|
|
|
|
|
|
|
| 13-Jul-04 |
307 |
|
|
|
|
|
|
|
|
|
|
|
|
|
|
|
|
|
|
|
| 14-Jul-04 |
290 |
|
|
|
|
|
|
|
|
|
|
|
|
|
|
|
|
|
|
|
| 15-Jul-04 |
292 |
|
|
|
|
|
|
|
|
|
|
|
|
|
|
|
|
|
|
|
| 16-Jul-04 |
292 |
|
|
|
|
|
|
|
|
|
|
|
|
|
|
|
|
|
|
|
| 17-Jul-04 |
292 |
|
|
|
|
|
|
|
|
|
|
|
|
|
|
|
|
|
|
|
| 18-Jul-04 |
275 |
|
|
|
|
|
|
|
|
|
|
|
|
|
|
|
|
|
|
|
| 19-Jul-04 |
279 |
|
|
|
|
|
|
|
|
|
|
|
|
|
|
|
|
|
|
|
| 20-Jul-04 |
278 |
|
|
|
|
|
|
|
|
|
|
|
|
|
|
|
|
|
|
|
| 21-Jul-04 |
277 |
|
|
|
|
|
|
|
|
|
|
|
|
|
|
|
|
|
|
|
| 22-Jul-04 |
286 |
|
|
|
|
|
|
|
|
|
|
|
|
|
|
|
|
|
|
|
| 23-Jul-04 |
271 |
|
|
|
|
|
|
|
|
|
|
|
|
|
|
|
|
|
|
|
| 24-Jul-04 |
269 |
|
|
|
|
|
|
|
|
|
|
|
|
|
|
|
|
|
|
|
| 25-Jul-04 |
269 |
|
|
|
|
|
|
|
|
|
|
|
|
|
|
|
|
|
|
|
| 26-Jul-04 |
279 |
|
|
|
|
|
|
|
|
|
|
|
|
|
|
|
|
|
|
|
| 27-Jul-04 |
286 |
|
|
|
|
|
|
|
|
|
|
|
|
|
|
|
|
|
|
|
| 28-Jul-04 |
293 |
|
|
|
|
|
|
|
|
|
|
|
|
|
|
|
|
|
|
|
| 29-Jul-04 |
286 |
|
|
|
|
|
|
|
|
|
|
|
|
|
|
|
|
|
|
|
| 30-Jul-04 |
285 |
|
|
|
|
|
|
|
|
|
|
|
|
|
|
|
|
|
|
|
| 31-Jul-04 |
275 |
|
|
|
|
|
|
|
|
|
|
|
|
|
|
|
|
|
|
|
| 1-Aug-04 |
275 |
|
|
|
|
|
|
|
|
|
|
|
|
|
|
|
|
|
|
|
| 2-Aug-04 |
273 |
|
|
|
|
|
|
|
|
|
|
|
|
|
|
|
|
|
|
|
| 3-Aug-04 |
278 |
|
|
|
|
|
|
|
|
|
|
|
|
|
|
|
|
|
|
|
| 4-Aug-04 |
290 |
|
|
|
|
|
|
|
|
|
|
|
|
|
|
|
|
|
|
|
| 5-Aug-04 |
278 |
|
|
|
|
|
|
|
|
|
|
|
|
|
|
|
|
|
|
|
| 6-Aug-04 |
280 |
|
|
|
|
|
|
|
|
|
|
|
|
|
|
|
|
|
|
|
| 7-Aug-04 |
267 |
|
|
|
|
|
|
|
|
|
|
|
|
|
|
|
|
|
|
|
| 8-Aug-04 |
244 |
|
|
|
|
|
|
|
|
|
|
|
|
|
|
|
|
|
|
|
| 9-Aug-04 |
262 |
|
|
|
|
|
|
|
|
|
|
|
|
|
|
|
|
|
|
|
| 10-Aug-04 |
252 |
|
|
|
|
|
|
|
|
|
|
|
|
|
|
|
|
|
|
|
| 11-Aug-04 |
259 |
|
|
|
|
|
|
|
|
|
|
|
|
|
|
|
|
|
|
|
| 12-Aug-04 |
245 |
|
|
|
|
|
|
|
|
|
|
|
|
|
|
|
|
|
|
|
| 13-Aug-04 |
228 |
|
|
|
|
|
|
|
|
|
|
|
|
|
|
|
|
|
|
|
| 14-Aug-04 |
239 |
|
|
|
|
|
|
|
|
|
|
|
|
|
|
|
|
|
|
|
| 15-Aug-04 |
228 |
|
|
|
|
|
|
|
|
|
|
|
|
|
|
|
|
|
|
|
| 16-Aug-04 |
238 |
|
|
|
|
|
|
|
|
|
|
|
|
|
|
|
|
|
|
|
| 17-Aug-04 |
238 |
|
|
|
|
|
|
|
|
|
|
|
|
|
|
|
|
|
|
|
| 18-Aug-04 |
248 |
|
|
|
|
|
|
|
|
|
|
|
|
|
|
|
|
|
|
|
| 19-Aug-04 |
256 |
|
|
|
|
|
|
|
|
|
|
|
|
|
|
|
|
|
|
|
| 20-Aug-04 |
259 |
|
|
|
|
|
|
|
|
|
|
|
|
|
|
|
|
|
|
|
| 21-Aug-04 |
246 |
|
|
|
|
|
|
|
|
|
|
|
|
|
|
|
|
|
|
|
| 22-Aug-04 |
243 |
|
|
|
|
|
|
|
|
|
|
|
|
|
|
|
|
|
|
|
| 23-Aug-04 |
234 |
|
|
|
|
|
|
|
|
|
|
|
|
|
|
|
|
|
|
|
| 24-Aug-04 |
225 |
|
|
|
|
|
|
|
|
|
|
|
|
|
|
|
|
|
|
|
| 25-Aug-04 |
233 |
|
|
|
|
|
|
|
|
|
|
|
|
|
|
|
|
|
|
|
| 26-Aug-04 |
232 |
|
|
|
|
|
|
|
|
|
|
|
|
|
|
|
|
|
|
|
| 27-Aug-04 |
234 |
|
|
|
|
|
|
|
|
|
|
|
|
|
|
|
|
|
|
|
| 28-Aug-04 |
225 |
|
|
|
|
|
|
|
|
|
|
|
|
|
|
|
|
|
|
|
| 29-Aug-04 |
232 |
|
|
|
|
|
|
|
|
|
|
|
|
|
|
|
|
|
|
|
| 30-Aug-04 |
227 |
|
|
|
|
|
|
|
|
|
|
|
|
|
|
|
|
|
|
|
| 31-Aug-04 |
218 |
|
|
|
|
|
|
|
|
|
|
|
|
|
|
|
|
|
|
|
| 1-Sep-04 |
242 |
|
|
|
|
|
|
|
|
|
|
|
|
|
|
|
|
|
|
|
| 2-Sep-04 |
242 |
|
|
|
|
|
|
|
|
|
|
|
|
|
|
|
|
|
|
|
| 3-Sep-04 |
269 |
|
|
|
|
|
|
|
|
|
|
|
|
|
|
|
|
|
|
|
| 4-Sep-04 |
262 |
|
|
|
|
|
|
|
|
|
|
|
|
|
|
|
|
|
|
|
| 5-Sep-04 |
266 |
|
|
|
|
|
|
|
|
|
|
|
|
|
|
|
|
|
|
|
| 6-Sep-04 |
256 |
|
|
|
|
|
|
|
|
|
|
|
|
|
|
|
|
|
|
|
| 7-Sep-04 |
244 |
|
|
|
|
|
|
|
|
|
|
|
|
|
|
|
|
|
|
|
| 8-Sep-04 |
236 |
|
|
|
|
|
|
|
|
|
|
|
|
|
|
|
|
|
|
|
| 9-Sep-04 |
226 |
|
|
|
|
|
|
|
|
|
|
|
|
|
|
|
|
|
|
|
| 10-Sep-04 |
217 |
|
|
|
|
|
|
|
|
|
|
|
|
|
|
|
|
|
|
|
| 11-Sep-04 |
235 |
|
|
|
|
|
|
|
|
|
|
|
|
|
|
|
|
|
|
|
| 12-Sep-04 |
223 |
|
|
|
|
|
|
|
|
|
|
|
|
|
|
|
|
|
|
|
| 13-Sep-04 |
230 |
|
|
|
|
|
|
|
|
|
|
|
|
|
|
|
|
|
|
|
| 14-Sep-04 |
241 |
|
|
|
|
|
|
|
|
|
|
|
|
|
|
|
|
|
|
|
| 15-Sep-04 |
242 |
|
|
|
|
|
|
|
|
|
|
|
|
|
|
|
|
|
|
|
| 16-Sep-04 |
252 |
|
|
|
|
|
|
|
|
|
|
|
|
|
|
|
|
|
|
|
| 17-Sep-04 |
226 |
|
|
|
|
|
|
|
|
|
|
|
|
|
|
|
|
|
|
|
| 18-Sep-04 |
226 |
|
|
|
|
|
|
|
|
|
|
|
|
|
|
|
|
|
|
|
| 19-Sep-04 |
227 |
|
|
|
|
|
|
|
|
|
|
|
|
|
|
|
|
|
|
|
| 20-Sep-04 |
241 |
|
|
|
|
|
|
|
|
|
|
|
|
|
|
|
|
|
|
|
| 21-Sep-04 |
258 |
|
|
|
|
|
|
|
|
|
|
|
|
|
|
|
|
|
|
|
| 22-Sep-04 |
250 |
|
|
|
|
|
|
|
|
|
|
|
|
|
|
|
|
|
|
|
| 23-Sep-04 |
247 |
|
|
|
|
|
|
|
|
|
|
|
|
|
|
|
|
|
|
|
| 24-Sep-04 |
233 |
|
|
|
|
|
|
|
|
|
|
|
|
|
|
|
|
|
|
|
| 25-Sep-04 |
227 |
|
|
|
|
|
|
|
|
|
|
|
|
|
|
|
|
|
|
|
| 26-Sep-04 |
260 |
|
|
|
|
|
|
|
|
|
|
|
|
|
|
|
|
|
|
|
| 27-Sep-04 |
241 |
|
|
|
|
|
|
|
|
|
|
|
|
|
|
|
|
|
|
|
| 28-Sep-04 |
248 |
|
|
|
|
|
|
|
|
|
|
|
|
|
|
|
|
|
|
|
| 29-Sep-04 |
216 |
|
|
|
|
|
|
|
|
|
|
|
|
|
|
|
|
|
|
|
| 30-Sep-04 |
193 |
|
|
|
|
|
|
|
|
|
|
|
|
|
|
|
|
|
|
|
| 1-Oct-04 |
206 |
|
|
|
|
|
|
|
|
|
|
|
|
|
|
|
|
|
|
|
| 2-Oct-04 |
187 |
|
|
|
|
|
|
|
|
|
|
|
|
|
|
|
|
|
|
|
| 3-Oct-04 |
251 |
|
|
|
|
|
|
|
|
|
|
|
|
|
|
|
|
|
|
|
| 4-Oct-04 |
251 |
|
|
|
|
|
|
|
|
|
|
|
|
|
|
|
|
|
|
|
| 5-Oct-04 |
261 |
|
|
|
|
|
|
|
|
|
|
|
|
|
|
|
|
|
|
|
| 6-Oct-04 |
264 |
|
|
|
|
|
|
|
|
|
|
|
|
|
|
|
|
|
|
|
| 7-Oct-04 |
282 |
|
|
|
|
|
|
|
|
|
|
|
|
|
|
|
|
|
|
|
| 8-Oct-04 |
270 |
|
|
|
|
|
|
|
|
|
|
|
|
|
|
|
|
|
|
|
| 9-Oct-04 |
272 |
|
|
|
|
|
|
|
|
|
|
|
|
|
|
|
|
|
|
|
| 10-Oct-04 |
259 |
|
|
|
|
|
|
|
|
|
|
|
|
|
|
|
|
|
|
|
| 11-Oct-04 |
235 |
|
|
|
|
|
|
|
|
|
|
|
|
|
|
|
|
|
|
|
| 12-Oct-04 |
238 |
|
|
|
|
|
|
|
|
|
|
|
|
|
|
|
|
|
|
|
| 13-Oct-04 |
245 |
|
|
|
|
|
|
|
|
|
|
|
|
|
|
|
|
|
|
|
| 14-Oct-04 |
217 |
|
|
|
|
|
|
|
|
|
|
|
|
|
|
|
|
|
|
|
| 15-Oct-04 |
213 |
|
|
|
|
|
|
|
|
|
|
|
|
|
|
|
|
|
|
|
| 16-Oct-04 |
203 |
|
|
|
|
|
|
|
|
|
|
|
|
|
|
|
|
|
|
|
| 17-Oct-04 |
212 |
|
|
|
|
|
|
|
|
|
|
|
|
|
|
|
|
|
|
|
| 18-Oct-04 |
243 |
|
|
|
|
|
|
|
|
|
|
|
|
|
|
|
|
|
|
|
| 19-Oct-04 |
259 |
|
|
|
|
|
|
|
|
|
|
|
|
|
|
|
|
|
|
|
| 20-Oct-04 |
259 |
|
|
|
|
|
|
|
|
|
|
|
|
|
|
|
|
|
|
|
| 21-Oct-04 |
259 |
|
|
|
|
|
|
|
|
|
|
|
|
|
|
|
|
|
|
|
| 22-Oct-04 |
264 |
|
|
|
|
|
|
|
|
|
|
|
|
|
|
|
|
|
|
|
| 23-Oct-04 |
281 |
|
|
|
|
|
|
|
|
|
|
|
|
|
|
|
|
|
|
|
| 24-Oct-04 |
263 |
|
|
|
|
|
|
|
|
|
|
|
|
|
|
|
|
|
|
|
| 25-Oct-04 |
254 |
|
|
|
|
|
|
|
|
|
|
|
|
|
|
|
|
|
|
|
| 26-Oct-04 |
232 |
|
|
|
|
|
|
|
|
|
|
|
|
|
|
|
|
|
|
|
| 27-Oct-04 |
210 |
|
|
|
|
|
|
|
|
|
|
|
|
|
|
|
|
|
|
|
| 28-Oct-04 |
172 |
|
|
|
|
|
|
|
|
|
|
|
|
|
|
|
|
|
|
|
| 29-Oct-04 |
183 |
|
|
|
|
|
|
|
|
|
|
|
|
|
|
|
|
|
|
|
| 30-Oct-04 |
188 |
|
|
|
|
|
|
|
|
|
|
|
|
|
|
|
|
|
|
|
| 31-Oct-04 |
197 |
|
|
|
|
|
|
|
|
|
|
|
|
|
|
|
|
|
|
|
| 1-Nov-04 |
218 |
|
|
|
|
|
|
|
|
|
|
|
|
|
|
|
|
|
|
|
| 2-Nov-04 |
232 |
|
|
|
|
|
|
|
|
|
|
|
|
|
|
|
|
|
|
|
| 3-Nov-04 |
238 |
|
|
|
|
|
|
|
|
|
|
|
|
|
|
|
|
|
|
|
| 4-Nov-04 |
253 |
|
|
|
|
|
|
|
|
|
|
|
|
|
|
|
|
|
|
|
| 5-Nov-04 |
253 |
|
|
|
|
|
|
|
|
|
|
|
|
|
|
|
|
|
|
|
| 6-Nov-04 |
259 |
|
|
|
|
|
|
|
|
|
|
|
|
|
|
|
|
|
|
|
| 7-Nov-04 |
240 |
|
|
|
|
|
|
|
|
|
|
|
|
|
|
|
|
|
|
|
| 8-Nov-04 |
222 |
|
|
|
|
|
|
|
|
|
|
|
|
|
|
|
|
|
|
|
| 9-Nov-04 |
205 |
|
|
|
|
|
|
|
|
|
|
|
|
|
|
|
|
|
|
|
| 10-Nov-04 |
187 |
|
|
|
|
|
|
|
|
|
|
|
|
|
|
|
|
|
|
|
| 11-Nov-04 |
170 |
|
|
|
|
|
|
|
|
|
|
|
|
|
|
|
|
|
|
|
| 12-Nov-04 |
158 |
|
|
|
|
|
|
|
|
|
|
|
|
|
|
|
|
|
|
|
| 13-Nov-04 |
199 |
|
|
|
|
|
|
|
|
|
|
|
|
|
|
|
|
|
|
|
| 14-Nov-04 |
204 |
|
|
|
|
|
|
|
|
|
|
|
|
|
|
|
|
|
|
|
| 15-Nov-04 |
230 |
|
|
|
|
|
|
|
|
|
|
|
|
|
|
|
|
|
|
|
| 16-Nov-04 |
210 |
|
|
|
|
|
|
|
|
|
|
|
|
|
|
|
|
|
|
|
| 17-Nov-04 |
197 |
|
|
|
|
|
|
|
|
|
|
|
|
|
|
|
|
|
|
|
| 18-Nov-04 |
206 |
|
|
|
|
|
|
|
|
|
|
|
|
|
|
|
|
|
|
|
| 19-Nov-04 |
196 |
|
|
|
|
|
|
|
|
|
|
|
|
|
|
|
|
|
|
|
| 20-Nov-04 |
239 |
|
|
|
|
|
|
|
|
|
|
|
|
|
|
|
|
|
|
|
| 21-Nov-04 |
239 |
|
|
|
|
|
|
|
|
|
|
|
|
|
|
|
|
|
|
|
| 22-Nov-04 |
193 |
|
|
|
|
|
|
|
|
|
|
|
|
|
|
|
|
|
|
|
| 23-Nov-04 |
210 |
|
|
|
|
|
|
|
|
|
|
|
|
|
|
|
|
|
|
|
| 24-Nov-04 |
188 |
|
|
|
|
|
|
|
|
|
|
|
|
|
|
|
|
|
|
|
| 25-Nov-04 |
192 |
|
|
|
|
|
|
|
|
|
|
|
|
|
|
|
|
|
|
|
| 26-Nov-04 |
192 |
|
|
|
|
|
|
|
|
|
|
|
|
|
|
|
|
|
|
|
| 27-Nov-04 |
189 |
|
|
|
|
|
|
|
|
|
|
|
|
|
|
|
|
|
|
|
| 28-Nov-04 |
211 |
|
|
|
|
|
|
|
|
|
|
|
|
|
|
|
|
|
|
|
| 29-Nov-04 |
221 |
|
|
|
|
|
|
|
|
|
|
|
|
|
|
|
|
|
|
|
| 30-Nov-04 |
217 |
|
|
|
|
|
|
|
|
|
|
|
|
|
|
|
|
|
|
|
| 1-Dec-04 |
211 |
|
|
|
|
|
|
|
|
|
|
|
|
|
|
|
|
|
|
|
| 2-Dec-04 |
198 |
|
|
|
|
|
|
|
|
|
|
|
|
|
|
|
|
|
|
|
| 3-Dec-04 |
189 |
|
|
|
|
|
|
|
|
|
|
|
|
|
|
|
|
|
|
|
| 4-Dec-04 |
195 |
|
|
|
|
|
|
|
|
|
|
|
|
|
|
|
|
|
|
|
| 5-Dec-04 |
193 |
|
|
|
|
|
|
|
|
|
|
|
|
|
|
|
|
|
|
|
| 6-Dec-04 |
179 |
|
|
|
|
|
|
|
|
|
|
|
|
|
|
|
|
|
|
|
| 7-Dec-04 |
179 |
|
|
|
|
|
|
|
|
|
|
|
|
|
|
|
|
|
|
|
| 8-Dec-04 |
191 |
|
|
|
|
|
|
|
|
|
|
|
|
|
|
|
|
|
|
|
| 9-Dec-04 |
197 |
|
|
|
|
|
|
|
|
|
|
|
|
|
|
|
|
|
|
|
| 10-Dec-04 |
266 |
|
|
|
|
|
|
|
|
|
|
|
|
|
|
|
|
|
|
|
| 11-Dec-04 |
276 |
|
|
|
|
|
|
|
|
|
|
|
|
|
|
|
|
|
|
|
| 12-Dec-04 |
286 |
|
|
|
|
|
|
|
|
|
|
|
|
|
|
|
|
|
|
|
| 13-Dec-04 |
312 |
|
|
|
|
|
|
|
|
|
|
|
|
|
|
|
|
|
|
|
| 14-Dec-04 |
295 |
|
|
|
|
|
|
|
|
|
|
|
|
|
|
|
|
|
|
|
| 15-Dec-04 |
279 |
|
|
|
|
|
|
|
|
|
|
|
|
|
|
|
|
|
|
|
| 16-Dec-04 |
287 |
|
|
|
|
|
|
|
|
|
|
|
|
|
|
|
|
|
|
|
| 17-Dec-04 |
260 |
|
|
|
|
|
|
|
|
|
|
|
|
|
|
|
|
|
|
|
| 18-Dec-04 |
267 |
|
|
|
|
|
|
|
|
|
|
|
|
|
|
|
|
|
|
|
| 19-Dec-04 |
263 |
|
|
|
|
|
|
|
|
|
|
|
|
|
|
|
|
|
|
|
| 20-Dec-04 |
249 |
|
|
|
|
|
|
|
|
|
|
|
|
|
|
|
|
|
|
|
| 21-Dec-04 |
256 |
|
|
|
|
|
|
|
|
|
|
|
|
|
|
|
|
|
|
|
| 22-Dec-04 |
185 |
|
|
|
|
|
|
|
|
|
|
|
|
|
|
|
|
|
|
|
| 23-Dec-04 |
185 |
|
|
|
|
|
|
|
|
|
|
|
|
|
|
|
|
|
|
|
| 24-Dec-04 |
185 |
|
|
|
|
|
|
|
|
|
|
|
|
|
|
|
|
|
|
|
| 25-Dec-04 |
182 |
|
|
|
|
|
|
|
|
|
|
|
|
|
|
|
|
|
|
|
| 26-Dec-04 |
190 |
|
|
|
|
|
|
|
|
|
|
|
|
|
|
|
|
|
|
|
| 27-Dec-04 |
197 |
|
|
|
|
|
|
|
|
|
|
|
|
|
|
|
|
|
|
|
| 28-Dec-04 |
186 |
|
|
|
|
|
|
|
|
|
|
|
|
|
|
|
|
|
|
|
| 29-Dec-04 |
194 |
|
|
|
|
|
|
|
|
|
|
|
|
|
|
|
|
|
|
|
| 30-Dec-04 |
208 |
|
|
|
|
|
|
|
|
|
|
|
|
|
|
|
|
|
|
|
| 31-Dec-04 |
181 |
|
|
|
|
|
|
|
|
|
|
|
|
|
|
|
|
|
|
|
| 1-Jan-05 |
181 |
|
|
|
|
|
|
|
|
|
|
|
|
|
|
|
|
|
|
|
| 2-Jan-05 |
190 |
|
|
|
|
|
|
|
|
|
|
|
|
|
|
|
|
|
|
|
| 3-Jan-05 |
203 |
|
|
|
|
|
|
|
|
|
|
|
|
|
|
|
|
|
|
|
| 4-Jan-05 |
222 |
|
|
|
|
|
|
|
|
|
|
|
|
|
|
|
|
|
|
|
| 5-Jan-05 |
213 |
|
|
|
|
|
|
|
|
|
|
|
|
|
|
|
|
|
|
|
| 6-Jan-05 |
211 |
|
|
|
|
|
|
|
|
|
|
|
|
|
|
|
|
|
|
|
| 7-Jan-05 |
200 |
|
|
|
|
|
|
|
|
|
|
|
|
|
|
|
|
|
|
|
| 8-Jan-05 |
200 |
|
|
|
|
|
|
|
|
|
|
|
|
|
|
|
|
|
|
|
| 9-Jan-05 |
209 |
|
|
|
|
|
|
|
|
|
|
|
|
|
|
|
|
|
|
|
| 10-Jan-05 |
214 |
|
|
|
|
|
|
|
|
|
|
|
|
|
|
|
|
|
|
|
| 11-Jan-05 |
238 |
|
|
|
|
|
|
|
|
|
|
|
|
|
|
|
|
|
|
|
| 12-Jan-05 |
244 |
|
|
|
|
|
|
|
|
|
|
|
|
|
|
|
|
|
|
|
| 13-Jan-05 |
254 |
|
|
|
|
|
|
|
|
|
|
|
|
|
|
|
|
|
|
|
| 14-Jan-05 |
221 |
|
|
|
|
|
|
|
|
|
|
|
|
|
|
|
|
|
|
|
| 15-Jan-05 |
194 |
|
|
|
|
|
|
|
|
|
|
|
|
|
|
|
|
|
|
|
| 16-Jan-05 |
166 |
|
|
|
|
|
|
|
|
|
|
|
|
|
|
|
|
|
|
|
| 17-Jan-05 |
166 |
|
|
|
|
|
|
|
|
|
|
|
|
|
|
|
|
|
|
|
| 18-Jan-05 |
225 |
|
|
|
|
|
|
|
|
|
|
|
|
|
|
|
|
|
|
|
| 19-Jan-05 |
218 |
|
|
|
|
|
|
|
|
|
|
|
|
|
|
|
|
|
|
|
| 20-Jan-05 |
230 |
|
|
|
|
|
|
|
|
|
|
|
|
|
|
|
|
|
|
|
| 21-Jan-05 |
216 |
|
|
|
|
|
|
|
|
|
|
|
|
|
|
|
|
|
|
|
| 22-Jan-05 |
200 |
|
|
|
|
|
|
|
|
|
|
|
|
|
|
|
|
|
|
|
| 23-Jan-05 |
221 |
|
|
|
|
|
|
|
|
|
|
|
|
|
|
|
|
|
|
|
| 24-Jan-05 |
221 |
|
|
|
|
|
|
|
|
|
|
|
|
|
|
|
|
|
|
|
| 25-Jan-05 |
367 |
|
|
|
|
|
|
|
|
|
|
|
|
|
|
|
|
|
|
|
| 26-Jan-05 |
318 |
|
|
|
|
|
|
|
|
|
|
|
|
|
|
|
|
|
|
|
| 27-Jan-05 |
272 |
|
|
|
|
|
|
|
|
|
|
|
|
|
|
|
|
|
|
|
| 28-Jan-05 |
252 |
|
|
|
|
|
|
|
|
|
|
|
|
|
|
|
|
|
|
|
| 29-Jan-05 |
181 |
|
|
|
|
|
|
|
|
|
|
|
|
|
|
|
|
|
|
|
| 30-Jan-05 |
175 |
|
|
|
|
|
|
|
|
|
|
|
|
|
|
|
|
|
|
|
| 31-Jan-05 |
200 |
|
|
|
|
|
|
|
|
|
|
|
|
|
|
|
|
|
|
|
| 1-Feb-05 |
219 |
|
|
|
|
|
|
|
|
|
|
|
|
|
|
|
|
|
|
|
| 2-Feb-05 |
219 |
|
|
|
|
|
|
|
|
|
|
|
|
|
|
|
|
|
|
|
| 3-Feb-05 |
227 |
|
|
|
|
|
|
|
|
|
|
|
|
|
|
|
|
|
|
|
| 4-Feb-05 |
222 |
|
|
|
|
|
|
|
|
|
|
|
|
|
|
|
|
|
|
|
| 5-Feb-05 |
217 |
|
|
|
|
|
|
|
|
|
|
|
|
|
|
|
|
|
|
|
| 6-Feb-05 |
230 |
|
|
|
|
|
|
|
|
|
|
|
|
|
|
|
|
|
|
|
| 7-Feb-05 |
234 |
|
|
|
|
|
|
|
|
|
|
|
|
|
|
|
|
|
|
|
| 8-Feb-05 |
228 |
|
|
|
|
|
|
|
|
|
|
|
|
|
|
|
|
|
|
|
| 9-Feb-05 |
228 |
|
|
|
|
|
|
|
|
|
|
|
|
|
|
|
|
|
|
|
| 10-Feb-05 |
185 |
|
|
|
|
|
|
|
|
|
|
|
|
|
|
|
|
|
|
|
| 11-Feb-05 |
179 |
|
|
|
|
|
|
|
|
|
|
|
|
|
|
|
|
|
|
|
| 12-Feb-05 |
216 |
|
|
|
|
|
|
|
|
|
|
|
|
|
|
|
|
|
|
|
| 13-Feb-05 |
220 |
|
|
|
|
|
|
|
|
|
|
|
|
|
|
|
|
|
|
|
| 14-Feb-05 |
237 |
|
|
|
|
|
|
|
|
|
|
|
|
|
|
|
|
|
|
|
| 15-Feb-05 |
266 |
|
|
|
|
|
|
|
|
|
|
|
|
|
|
|
|
|
|
|
| 16-Feb-05 |
241 |
|
|
|
|
|
|
|
|
|
|
|
|
|
|
|
|
|
|
|
| 17-Feb-05 |
211 |
|
|
|
|
|
|
|
|
|
|
|
|
|
|
|
|
|
|
|
| 18-Feb-05 |
211 |
|
|
|
|
|
|
|
|
|
|
|
|
|
|
|
|
|
|
|
| 19-Feb-05 |
207 |
|
|
|
|
|
|
|
|
|
|
|
|
|
|
|
|
|
|
|
| 20-Feb-05 |
195 |
|
|
|
|
|
|
|
|
|
|
|
|
|
|
|
|
|
|
|
| 21-Feb-05 |
204 |
|
|
|
|
|
|
|
|
|
|
|
|
|
|
|
|
|
|
|
| 22-Feb-05 |
209 |
|
|
|
|
|
|
|
|
|
|
|
|
|
|
|
|
|
|
|
| 23-Feb-05 |
195 |
|
|
|
|
|
|
|
|
|
|
|
|
|
|
|
|
|
|
|
| 24-Feb-05 |
238 |
|
|
|
|
|
|
|
|
|
|
|
|
|
|
|
|
|
|
|
| 25-Feb-05 |
238 |
|
|
|
|
|
|
|
|
|
|
|
|
|
|
|
|
|
|
|
| 26-Feb-05 |
259 |
|
|
|
|
|
|
|
|
|
|
|
|
|
|
|
|
|
|
|
| 27-Feb-05 |
243 |
|
|
|
|
|
|
|
|
|
|
|
|
|
|
|
|
|
|
|
| 28-Feb-05 |
214 |
|
|
|
|
|
|
|
|
|
|
|
|
|
|
|
|
|
|
|
| 1-Mar-05 |
204 |
|
|
|
|
|
|
|
|
|
|
|
|
|
|
|
|
|
|
|
| 2-Mar-05 |
184 |
|
|
|
|
|
|
|
|
|
|
|
|
|
|
|
|
|
|
|
| 3-Mar-05 |
210 |
|
|
|
|
|
|
|
|
|
|
|
|
|
|
|
|
|
|
|
| 4-Mar-05 |
229 |
|
|
|
|
|
|
|
|
|
|
|
|
|
|
|
|
|
|
|
| 5-Mar-05 |
289 |
|
|
|
|
|
|
|
|
|
|
|
|
|
|
|
|
|
|
|
| 6-Mar-05 |
284 |
|
|
|
|
|
|
|
|
|
|
|
|
|
|
|
|
|
|
|
| 7-Mar-05 |
292 |
|
|
|
|
|
|
|
|
|
|
|
|
|
|
|
|
|
|
|
| 8-Mar-05 |
257 |
|
|
|
|
|
|
|
|
|
|
|
|
|
|
|
|
|
|
|
| 9-Mar-05 |
237 |
|
|
|
|
|
|
|
|
|
|
|
|
|
|
|
|
|
|
|
| 10-Mar-05 |
257 |
|
|
|
|
|
|
|
|
|
|
|
|
|
|
|
|
|
|
|
| 11-Mar-05 |
236 |
|
|
|
|
|
|
|
|
|
|
|
|
|
|
|
|
|
|
|
| 12-Mar-05 |
293 |
|
|
|
|
|
|
|
|
|
|
|
|
|
|
|
|
|
|
|
| 13-Mar-05 |
293 |
|
|
|
|
|
|
|
|
|
|
|
|
|
|
|
|
|
|
|
| 14-Mar-05 |
299 |
|
|
|
|
|
|
|
|
|
|
|
|
|
|
|
|
|
|
|
| 15-Mar-05 |
191 |
|
|
|
|
|
|
|
|
|
|
|
|
|
|
|
|
|
|
|
| 16-Mar-05 |
162 |
|
|
|
|
|
|
|
|
|
|
|
|
|
|
|
|
|
|
|
| 17-Mar-05 |
198 |
|
|
|
|
|
|
|
|
|
|
|
|
|
|
|
|
|
|
|
| 18-Mar-05 |
168 |
|
|
|
|
|
|
|
|
|
|
|
|
|
|
|
|
|
|
|
| 19-Mar-05 |
303 |
|
|
|
|
|
|
|
|
|
|
|
|
|
|
|
|
|
|
|
| 20-Mar-05 |
356 |
|
|
|
|
|
|
|
|
|
|
|
|
|
|
|
|
|
|
|
| 21-Mar-05 |
383 |
|
|
|
|
|
|
|
|
|
|
|
|
|
|
|
|
|
|
|
| 22-Mar-05 |
383 |
|
|
|
|
|
|
|
|
|
|
|
|
|
|
|
|
|
|
|
| 23-Mar-05 |
359 |
|
|
|
|
|
|
|
|
|
|
|
|
|
|
|
|
|
|
|
| 24-Mar-05 |
336 |
|
|
|
|
|
|
|
|
|
|
|
|
|
|
|
|
|
|
|
| 25-Mar-05 |
320 |
|
|
|
|
|
|
|
|
|
|
|
|
|
|
|
|
|
|
|
| 26-Mar-05 |
319 |
|
|
|
|
|
|
|
|
|
|
|
|
|
|
|
|
|
|
|
| 27-Mar-05 |
305 |
|
|
|
|
|
|
|
|
|
|
|
|
|
|
|
|
|
|
|
| 28-Mar-05 |
345 |
|
|
|
|
|
|
|
|
|
|
|
|
|
|
|
|
|
|
|
| 29-Mar-05 |
345 |
|
|
|
|
|
|
|
|
|
|
|
|
|
|
|
|
|
|
|
| 30-Mar-05 |
342 |
|
|
|
|
|
|
|
|
|
|
|
|
|
|
|
|
|
|
|
| 31-Mar-05 |
346 |
|
|
|
|
|
|
|
|
|
|
|
|
|
|
|
|
|
|
|
| 1-Apr-05 |
354 |
|
|
|
|
|
|
|
|
|
|
|
|
|
|
|
|
|
|
|
| 2-Apr-05 |
356 |
|
|
|
|
|
|
|
|
|
|
|
|
|
|
|
|
|
|
|
| 3-Apr-05 |
350 |
|
|
|
|
|
|
|
|
|
|
|
|
|
|
|
|
|
|
|
| 4-Apr-05 |
343 |
|
|
|
|
|
|
|
|
|
|
|
|
|
|
|
|
|
|
|
| 5-Apr-05 |
327 |
|
|
|
|
|
|
|
|
|
|
|
|
|
|
|
|
|
|
|
| 6-Apr-05 |
332 |
|
|
|
|
|
|
|
|
|
|
|
|
|
|
|
|
|
|
|
| 7-Apr-05 |
369 |
|
|
|
|
|
|
|
|
|
|
|
|
|
|
|
|
|
|
|
| 8-Apr-05 |
399 |
|
|
|
|
|
|
|
|
|
|
|
|
|
|
|
|
|
|
|
| 9-Apr-05 |
405 |
|
|
|
|
|
|
|
|
|
|
|
|
|
|
|
|
|
|
|
| 10-Apr-05 |
393 |
|
|
|
|
|
|
|
|
|
|
|
|
|
|
|
|
|
|
|
| 11-Apr-05 |
359 |
|
|
|
|
|
|
|
|
|
|
|
|
|
|
|
|
|
|
|
| 12-Apr-05 |
342 |
|
|
|
|
|
|
|
|
|
|
|
|
|
|
|
|
|
|
|
| 13-Apr-05 |
340 |
|
|
|
|
|
|
|
|
|
|
|
|
|
|
|
|
|
|
|
| 14-Apr-05 |
359 |
|
|
|
|
|
|
|
|
|
|
|
|
|
|
|
|
|
|
|
| 15-Apr-05 |
367 |
|
|
|
|
|
|
|
|
|
|
|
|
|
|
|
|
|
|
|
| 16-Apr-05 |
359 |
|
|
|
|
|
|
|
|
|
|
|
|
|
|
|
|
|
|
|
| 17-Apr-05 |
365 |
|
|
|
|
|
|
|
|
|
|
|
|
|
|
|
|
|
|
|
| 18-Apr-05 |
361 |
|
|
|
|
|
|
|
|
|
|
|
|
|
|
|
|
|
|
|
| 19-Apr-05 |
366 |
|
|
|
|
|
|
|
|
|
|
|
|
|
|
|
|
|
|
|
| 20-Apr-05 |
380 |
|
|
|
|
|
|
|
|
|
|
|
|
|
|
|
|
|
|
|
| 21-Apr-05 |
381 |
|
|
|
|
|
|
|
|
|
|
|
|
|
|
|
|
|
|
|
| 22-Apr-05 |
376 |
|
|
|
|
|
|
|
|
|
|
|
|
|
|
|
|
|
|
|
| 23-Apr-05 |
378 |
|
|
|
|
|
|
|
|
|
|
|
|
|
|
|
|
|
|
|
| 24-Apr-05 |
382 |
|
|
|
|
|
|
|
|
|
|
|
|
|
|
|
|
|
|
|
| 25-Apr-05 |
381 |
|
|
|
|
|
|
|
|
|
|
|
|
|
|
|
|
|
|
|
| 26-Apr-05 |
379 |
|
|
|
|
|
|
|
|
|
|
|
|
|
|
|
|
|
|
|
| 27-Apr-05 |
371 |
|
|
|
|
|
|
|
|
|
|
|
|
|
|
|
|
|
|
|
| 28-Apr-05 |
356 |
|
|
|
|
|
|
|
|
|
|
|
|
|
|
|
|
|
|
|
| 29-Apr-05 |
347 |
|
|
|
|
|
|
|
|
|
|
|
|
|
|
|
|
|
|
|
| 30-Apr-05 |
353 |
|
|
|
|
|
|
|
|
|
|
|
|
|
|
|
|
|
|
|
| 1-May-05 |
363 |
|
|
|
|
|
|
|
|
|
|
|
|
|
|
|
|
|
|
|
| 2-May-05 |
373 |
|
|
|
|
|
|
|
|
|
|
|
|
|
|
|
|
|
|
|
| 3-May-05 |
378 |
|
|
|
|
|
|
|
|
|
|
|
|
|
|
|
|
|
|
|
| 4-May-05 |
376 |
|
|
|
|
|
|
|
|
|
|
|
|
|
|
|
|
|
|
|
| 5-May-05 |
363 |
|
|
|
|
|
|
|
|
|
|
|
|
|
|
|
|
|
|
|
| 6-May-05 |
340 |
|
|
|
|
|
|
|
|
|
|
|
|
|
|
|
|
|
|
|
| 7-May-05 |
345 |
|
|
|
|
|
|
|
|
|
|
|
|
|
|
|
|
|
|
|
| 8-May-05 |
345 |
|
|
|
|
|
|
|
|
|
|
|
|
|
|
|
|
|
|
|
| 9-May-05 |
362 |
|
|
|
|
|
|
|
|
|
|
|
|
|
|
|
|
|
|
|
| 10-May-05 |
376 |
|
|
|
|
|
|
|
|
|
|
|
|
|
|
|
|
|
|
|
| 11-May-05 |
364 |
|
|
|
|
|
|
|
|
|
|
|
|
|
|
|
|
|
|
|
| 12-May-05 |
365 |
|
|
|
|
|
|
|
|
|
|
|
|
|
|
|
|
|
|
|
| 13-May-05 |
339 |
|
|
|
|
|
|
|
|
|
|
|
|
|
|
|
|
|
|
|
| 14-May-05 |
334 |
|
|
|
|
|
|
|
|
|
|
|
|
|
|
|
|
|
|
|
| 15-May-05 |
334 |
|
|
|
|
|
|
|
|
|
|
|
|
|
|
|
|
|
|
|
| 16-May-05 |
343 |
|
|
|
|
|
|
|
|
|
|
|
|
|
|
|
|
|
|
|
| 17-May-05 |
338 |
|
|
|
|
|
|
|
|
|
|
|
|
|
|
|
|
|
|
|
| 18-May-05 |
343 |
|
|
|
|
|
|
|
|
|
|
|
|
|
|
|
|
|
|
|
| 19-May-05 |
353 |
|
|
|
|
|
|
|
|
|
|
|
|
|
|
|
|
|
|
|
| 20-May-05 |
341 |
|
|
|
|
|
|
|
|
|
|
|
|
|
|
|
|
|
|
|
| 21-May-05 |
346 |
|
|
|
|
|
|
|
|
|
|
|
|
|
|
|
|
|
|
|
| 22-May-05 |
321 |
|
|
|
|
|
|
|
|
|
|
|
|
|
|
|
|
|
|
|
| 23-May-05 |
316 |
|
|
|
|
|
|
|
|
|
|
|
|
|
|
|
|
|
|
|
| 24-May-05 |
318 |
|
|
|
|
|
|
|
|
|
|
|
|
|
|
|
|
|
|
|
| 25-May-05 |
336 |
|
|
|
|
|
|
|
|
|
|
|
|
|
|
|
|
|
|
|
| 26-May-05 |
351 |
|
|
|
|
|
|
|
|
|
|
|
|
|
|
|
|
|
|
|
| 27-May-05 |
346 |
|
|
|
|
|
|
|
|
|
|
|
|
|
|
|
|
|
|
|
| 28-May-05 |
344 |
|
|
|
|
|
|
|
|
|
|
|
|
|
|
|
|
|
|
|
| 29-May-05 |
324 |
|
|
|
|
|
|
|
|
|
|
|
|
|
|
|
|
|
|
|
| 30-May-05 |
320 |
|
|
|
|
|
|
|
|
|
|
|
|
|
|
|
|
|
|
|
| 31-May-05 |
325 |
|
|
|
|
|
|
|
|
|
|
|
|
|
|
|
|
|
|
|
| 1-Jun-05 |
336 |
|
|
|
|
|
|
|
|
|
|
|
|
|
|
|
|
|
|
|
| 2-Jun-05 |
352 |
|
|
|
|
|
|
|
|
|
|
|
|
|
|
|
|
|
|
|
| 3-Jun-05 |
338 |
|
|
|
|
|
|
|
|
|
|
|
|
|
|
|
|
|
|
|
| 4-Jun-05 |
323 |
|
|
|
|
|
|
|
|
|
|
|
|
|
|
|
|
|
|
|
| 5-Jun-05 |
318 |
|
|
|
|
|
|
|
|
|
|
|
|
|
|
|
|
|
|
|
| 6-Jun-05 |
318 |
|
|
|
|
|
|
|
|
|
|
|
|
|
|
|
|
|
|
|
| 7-Jun-05 |
316 |
|
|
|
|
|
|
|
|
|
|
|
|
|
|
|
|
|
|
|
| 8-Jun-05 |
306 |
|
|
|
|
|
|
|
|
|
|
|
|
|
|
|
|
|
|
|
| 9-Jun-05 |
305 |
|
|
|
|
|
|
|
|
|
|
|
|
|
|
|
|
|
|
|
| 10-Jun-05 |
305 |
|
|
|
|
|
|
|
|
|
|
|
|
|
|
|
|
|
|
|
| 11-Jun-05 |
302 |
|
|
|
|
|
|
|
|
|
|
|
|
|
|
|
|
|
|
|
| 12-Jun-05 |
305 |
|
|
|
|
|
|
|
|
|
|
|
|
|
|
|
|
|
|
|
| 13-Jun-05 |
303 |
|
|
|
|
|
|
|
|
|
|
|
|
|
|
|
|
|
|
|
| 14-Jun-05 |
287 |
|
|
|
|
|
|
|
|
|
|
|
|
|
|
|
|
|
|
|
| 15-Jun-05 |
282 |
|
|
|
|
|
|
|
|
|
|
|
|
|
|
|
|
|
|
|
| 16-Jun-05 |
272 |
|
|
|
|
|
|
|
|
|
|
|
|
|
|
|
|
|
|
|
| 17-Jun-05 |
272 |
|
|
|
|
|
|
|
|
|
|
|
|
|
|
|
|
|
|
|
| 18-Jun-05 |
316 |
|
|
|
|
|
|
|
|
|
|
|
|
|
|
|
|
|
|
|
| 19-Jun-05 |
336 |
|
|
|
|
|
|
|
|
|
|
|
|
|
|
|
|
|
|
|
| 20-Jun-05 |
310 |
|
|
|
|
|
|
|
|
|
|
|
|
|
|
|
|
|
|
|
| 21-Jun-05 |
295 |
|
|
|
|
|
|
|
|
|
|
|
|
|
|
|
|
|
|
|
| 22-Jun-05 |
272 |
|
|
|
|
|
|
|
|
|
|
|
|
|
|
|
|
|
|
|
| 23-Jun-05 |
246 |
|
|
|
|
|
|
|
|
|
|
|
|
|
|
|
|
|
|
|
| 24-Jun-05 |
237 |
|
|
|
|
|
|
|
|
|
|
|
|
|
|
|
|
|
|
|
| 25-Jun-05 |
255 |
|
|
|
|
|
|
|
|
|
|
|
|
|
|
|
|
|
|
|
| 26-Jun-05 |
255 |
|
|
|
|
|
|
|
|
|
|
|
|
|
|
|
|
|
|
|
| 27-Jun-05 |
280 |
|
|
|
|
|
|
|
|
|
|
|
|
|
|
|
|
|
|
|
| 28-Jun-05 |
277 |
|
|
|
|
|
|
|
|
|
|
|
|
|
|
|
|
|
|
|
| 29-Jun-05 |
263 |
|
|
|
|
|
|
|
|
|
|
|
|
|
|
|
|
|
|
|
| 30-Jun-05 |
257 |
|
|
|
|
|
|
|
|
|
|
|
|
|
|
|
|
|
|
|
| 1-Jul-05 |
258 |
|
|
|
|
|
|
|
|
|
|
|
|
|
|
|
|
|
|
|
| 2-Jul-05 |
243 |
|
|
|
|
|
|
|
|
|
|
|
|
|
|
|
|
|
|
|
| 3-Jul-05 |
243 |
|
|
|
|
|
|
|
|
|
|
|
|
|
|
|
|
|
|
|
| 4-Jul-05 |
|
|
|
|
|
|
|
|
|
|
|
|
|
|
|
|
|
|
|
|
| 5-Jul-05 |
|
|
|
|
|
|
|
|
|
|
|
|
|
|
|
|
|
|
|
|
| 6-Jul-05 |
|
|
|
|
|
|
|
|
|
|
|
|
|
|
|
|
|
|
|
|
| 7-Jul-05 |
|
|
|
|
|
|
|
|
|
|
|
|
|
|
|
|
|
|
|
|
| 8-Jul-05 |
|
|
|
|
|
|
|
|
|
|
|
|
|
|
|
|
|
|
|
|
| 9-Jul-05 |
|
|
|
|
|
|
|
|
|
|
|
|
|
|
|
|
|
|
|
|
| 10-Jul-05 |
|
|
|
|
|
|
|
|
|
|
|
|
|
|
|
|
|
|
|
|
| 11-Jul-05 |
|
|
|
|
|
|
|
|
|
|
|
|
|
|
|
|
|
|
|
|
| 12-Jul-05 |
|
|
|
|
|
|
|
|
|
|
|
|
|
|
|
|
|
|
|
|
| 13-Jul-05 |
|
|
|
|
|
|
|
|
|
|
|
|
|
|
|
|
|
|
|
|
| 14-Jul-05 |
|
|
|
|
|
|
|
|
|
|
|
|
|
|
|
|
|
|
|
|
| 15-Jul-05 |
|
|
|
|
|
|
|
|
|
|
|
|
|
|
|
|
|
|
|
|
| 16-Jul-05 |
|
|
|
|
|
|
|
|
|
|
|
|
|
|
|
|
|
|
|
|
| 17-Jul-05 |
|
|
|
|
|
|
|
|
|
|
|
|
|
|
|
|
|
|
|
|
| 18-Jul-05 |
|
|
|
|
|
|
|
|
|
|
|
|
|
|
|
|
|
|
|
|
| 19-Jul-05 |
|
|
|
|
|
|
|
|
|
|
|
|
|
|
|
|
|
|
|
|
| 20-Jul-05 |
|
|
|
|
|
|
|
|
|
|
|
|
|
|
|
|
|
|
|
|
| 21-Jul-05 |
|
|
|
|
|
|
|
|
|
|
|
|
|
|
|
|
|
|
|
|
| 22-Jul-05 |
|
|
|
|
|
|
|
|
|
|
|
|
|
|
|
|
|
|
|
|
| 23-Jul-05 |
|
|
|
|
|
|
|
|
|
|
|
|
|
|
|
|
|
|
|
|
| 24-Jul-05 |
|
|
|
|
|
|
|
|
|
|
|
|
|
|
|
|
|
|
|
|
| 25-Jul-05 |
|
|
|
|
|
|
|
|
|
|
|
|
|
|
|
|
|
|
|
|
| 26-Jul-05 |
|
|
|
|
|
|
|
|
|
|
|
|
|
|
|
|
|
|
|
|
| 27-Jul-05 |
|
|
|
|
|
|
|
|
|
|
|
|
|
|
|
|
|
|
|
|
| 28-Jul-05 |
|
|
|
|
|
|
|
|
|
|
|
|
|
|
|
|
|
|
|
|
| 29-Jul-05 |
|
|
|
|
|
|
|
|
|
|
|
|
|
|
|
|
|
|
|
|
| 30-Jul-05 |
|
|
|
|
|
|
|
|
|
|
|
|
|
|
|
|
|
|
|
|
| 31-Jul-05 |
|
|
|
|
|
|
|
|
|
|
|
|
|
|
|
|
|
|
|
|
| 1-Aug-05 |
246 |
|
|
|
|
|
|
|
|
|
|
|
|
|
|
|
|
|
|
|
| 2-Aug-05 |
242 |
|
|
|
|
|
|
|
|
|
|
|
|
|
|
|
|
|
|
|
| 3-Aug-05 |
240 |
|
|
|
|
|
|
|
|
|
|
|
|
|
|
|
|
|
|
|
| 4-Aug-05 |
228 |
|
|
|
|
|
|
|
|
|
|
|
|
|
|
|
|
|
|
|
| 5-Aug-05 |
215 |
|
|
|
|
|
|
|
|
|
|
|
|
|
|
|
|
|
|
|
| 6-Aug-05 |
221 |
|
|
|
|
|
|
|
|
|
|
|
|
|
|
|
|
|
|
|
| 7-Aug-05 |
226 |
|
|
|
|
|
|
|
|
|
|
|
|
|
|
|
|
|
|
|
| 8-Aug-05 |
233 |
|
|
|
|
|
|
|
|
|
|
|
|
|
|
|
|
|
|
|
| 9-Aug-05 |
240 |
|
|
|
|
|
|
|
|
|
|
|
|
|
|
|
|
|
|
|
| 10-Aug-05 |
235 |
|
|
|
|
|
|
|
|
|
|
|
|
|
|
|
|
|
|
|
| 11-Aug-05 |
236 |
|
|
|
|
|
|
|
|
|
|
|
|
|
|
|
|
|
|
|
| 12-Aug-05 |
256 |
|
|
|
|
|
|
|
|
|
|
|
|
|
|
|
|
|
|
|
| 13-Aug-05 |
271 |
|
|
|
|
|
|
|
|
|
|
|
|
|
|
|
|
|
|
|
| 14-Aug-05 |
271 |
|
|
|
|
|
|
|
|
|
|
|
|
|
|
|
|
|
|
|
| 15-Aug-05 |
270 |
|
|
|
|
|
|
|
|
|
|
|
|
|
|
|
|
|
|
|
| 16-Aug-05 |
257 |
|
|
|
|
|
|
|
|
|
|
|
|
|
|
|
|
|
|
|
| 17-Aug-05 |
242 |
|
|
|
|
|
|
|
|
|
|
|
|
|
|
|
|
|
|
|
| 18-Aug-05 |
241 |
|
|
|
|
|
|
|
|
|
|
|
|
|
|
|
|
|
|
|
| 19-Aug-05 |
240 |
|
|
|
|
|
|
|
|
|
|
|
|
|
|
|
|
|
|
|
| 20-Aug-05 |
248 |
|
|
|
|
|
|
|
|
|
|
|
|
|
|
|
|
|
|
|
| 21-Aug-05 |
261 |
|
|
|
|
|
|
|
|
|
|
|
|
|
|
|
|
|
|
|
| 22-Aug-05 |
271 |
|
|
|
|
|
|
|
|
|
|
|
|
|
|
|
|
|
|
|
| 23-Aug-05 |
270 |
|
|
|
|
|
|
|
|
|
|
|
|
|
|
|
|
|
|
|
| 24-Aug-05 |
265 |
|
|
|
|
|
|
|
|
|
|
|
|
|
|
|
|
|
|
|
| 25-Aug-05 |
257 |
|
|
|
|
|
|
|
|
|
|
|
|
|
|
|
|
|
|
|
| 26-Aug-05 |
240 |
|
|
|
|
|
|
|
|
|
|
|
|
|
|
|
|
|
|
|
| 27-Aug-05 |
238 |
|
|
|
|
|
|
|
|
|
|
|
|
|
|
|
|
|
|
|
| 28-Aug-05 |
243 |
|
|
|
|
|
|
|
|
|
|
|
|
|
|
|
|
|
|
|
| 29-Aug-05 |
245 |
|
|
|
|
|
|
|
|
|
|
|
|
|
|
|
|
|
|
|
| 30-Aug-05 |
245 |
|
|
|
|
|
|
|
|
|
|
|
|
|
|
|
|
|
|
|
| 31-Aug-05 |
241 |
|
|
|
|
|
|
|
|
|
|
|
|
|
|
|
|
|
|
|
| 1-Sep-05 |
235 |
|
|
|
|
|
|
|
|
|
|
|
|
|
|
|
|
|
|
|
| 2-Sep-05 |
228 |
|
|
|
|
|
|
|
|
|
|
|
|
|
|
|
|
|
|
|
| 3-Sep-05 |
220 |
|
|
|
|
|
|
|
|
|
|
|
|
|
|
|
|
|
|
|
| 4-Sep-05 |
214 |
|
|
|
|
|
|
|
|
|
|
|
|
|
|
|
|
|
|
|
| 5-Sep-05 |
217 |
|
|
|
|
|
|
|
|
|
|
|
|
|
|
|
|
|
|
|
| 6-Sep-05 |
218 |
|
|
|
|
|
|
|
|
|
|
|
|
|
|
|
|
|
|
|
| 7-Sep-05 |
225 |
|
|
|
|
|
|
|
|
|
|
|
|
|
|
|
|
|
|
|
| 8-Sep-05 |
233 |
|
|
|
|
|
|
|
|
|
|
|
|
|
|
|
|
|
|
|
| 9-Sep-05 |
231 |
|
|
|
|
|
|
|
|
|
|
|
|
|
|
|
|
|
|
|
| 10-Sep-05 |
237 |
|
|
|
|
|
|
|
|
|
|
|
|
|
|
|
|
|
|
|
| 11-Sep-05 |
237 |
|
|
|
|
|
|
|
|
|
|
|
|
|
|
|
|
|
|
|
| 12-Sep-05 |
235 |
|
|
|
|
|
|
|
|
|
|
|
|
|
|
|
|
|
|
|
| 13-Sep-05 |
237 |
|
|
|
|
|
|
|
|
|
|
|
|
|
|
|
|
|
|
|
| 14-Sep-05 |
231 |
|
|
|
|
|
|
|
|
|
|
|
|
|
|
|
|
|
|
|
| 15-Sep-05 |
225 |
|
|
|
|
|
|
|
|
|
|
|
|
|
|
|
|
|
|
|
| 16-Sep-05 |
222 |
|
|
|
|
|
|
|
|
|
|
|
|
|
|
|
|
|
|
|
| 17-Sep-05 |
216 |
|
|
|
|
|
|
|
|
|
|
|
|
|
|
|
|
|
|
|
| 18-Sep-05 |
212 |
|
|
|
|
|
|
|
|
|
|
|
|
|
|
|
|
|
|
|
| 19-Sep-05 |
215 |
|
|
|
|
|
|
|
|
|
|
|
|
|
|
|
|
|
|
|
| 20-Sep-05 |
217 |
|
|
|
|
|
|
|
|
|
|
|
|
|
|
|
|
|
|
|
| 21-Sep-05 |
233 |
|
|
|
|
|
|
|
|
|
|
|
|
|
|
|
|
|
|
|
| 22-Sep-05 |
247 |
|
|
|
|
|
|
|
|
|
|
|
|
|
|
|
|
|
|
|
| 23-Sep-05 |
247 |
|
|
|
|
|
|
|
|
|
|
|
|
|
|
|
|
|
|
|
| 24-Sep-05 |
246 |
|
|
|
|
|
|
|
|
|
|
|
|
|
|
|
|
|
|
|
| 25-Sep-05 |
240 |
|
|
|
|
|
|
|
|
|
|
|
|
|
|
|
|
|
|
|
| 26-Sep-05 |
232 |
|
|
|
|
|
|
|
|
|
|
|
|
|
|
|
|
|
|
|
| 27-Sep-05 |
226 |
|
|
|
|
|
|
|
|
|
|
|
|
|
|
|
|
|
|
|
| 28-Sep-05 |
222 |
|
|
|
|
|
|
|
|
|
|
|
|
|
|
|
|
|
|
|
| 29-Sep-05 |
218 |
|
|
|
|
|
|
|
|
|
|
|
|
|
|
|
|
|
|
|
| 30-Sep-05 |
218 |
|
|
|
|
|
|
|
|
|
|
|
|
|
|
|
|
|
|
|
| 1-Oct-05 |
223 |
|
|
|
|
|
|
|
|
|
|
|
|
|
|
|
|
|
|
|
| 2-Oct-05 |
218 |
|
|
|
|
|
|
|
|
|
|
|
|
|
|
|
|
|
|
|
| 3-Oct-05 |
218 |
|
|
|
|
|
|
|
|
|
|
|
|
|
|
|
|
|
|
|
| 4-Oct-05 |
209 |
|
|
|
|
|
|
|
|
|
|
|
|
|
|
|
|
|
|
|
| 5-Oct-05 |
215 |
|
|
|
|
|
|
|
|
|
|
|
|
|
|
|
|
|
|
|
| 6-Oct-05 |
229 |
|
|
|
|
|
|
|
|
|
|
|
|
|
|
|
|
|
|
|
| 7-Oct-05 |
240 |
|
|
|
|
|
|
|
|
|
|
|
|
|
|
|
|
|
|
|
| 8-Oct-05 |
247 |
|
|
|
|
|
|
|
|
|
|
|
|
|
|
|
|
|
|
|
| 9-Oct-05 |
243 |
|
|
|
|
|
|
|
|
|
|
|
|
|
|
|
|
|
|
|
| 10-Oct-05 |
241 |
|
|
|
|
|
|
|
|
|
|
|
|
|
|
|
|
|
|
|
| 11-Oct-05 |
241 |
|
|
|
|
|
|
|
|
|
|
|
|
|
|
|
|
|
|
|
| 12-Oct-05 |
240 |
|
|
|
|
|
|
|
|
|
|
|
|
|
|
|
|
|
|
|
| 13-Oct-05 |
243 |
|
|
|
|
|
|
|
|
|
|
|
|
|
|
|
|
|
|
|
| 14-Oct-05 |
244 |
|
|
|
|
|
|
|
|
|
|
|
|
|
|
|
|
|
|
|
| 15-Oct-05 |
242 |
|
|
|
|
|
|
|
|
|
|
|
|
|
|
|
|
|
|
|
| 16-Oct-05 |
241 |
|
|
|
|
|
|
|
|
|
|
|
|
|
|
|
|
|
|
|
| 17-Oct-05 |
242 |
|
|
|
|
|
|
|
|
|
|
|
|
|
|
|
|
|
|
|
| 18-Oct-05 |
244 |
|
|
|
|
|
|
|
|
|
|
|
|
|
|
|
|
|
|
|
| 19-Oct-05 |
237 |
|
|
|
|
|
|
|
|
|
|
|
|
|
|
|
|
|
|
|
| 20-Oct-05 |
233 |
|
|
|
|
|
|
|
|
|
|
|
|
|
|
|
|
|
|
|
| 21-Oct-05 |
223 |
|
|
|
|
|
|
|
|
|
|
|
|
|
|
|
|
|
|
|
| 22-Oct-05 |
216 |
|
|
|
|
|
|
|
|
|
|
|
|
|
|
|
|
|
|
|
| 23-Oct-05 |
232 |
|
|
|
|
|
|
|
|
|
|
|
|
|
|
|
|
|
|
|
| 24-Oct-05 |
251 |
|
|
|
|
|
|
|
|
|
|
|
|
|
|
|
|
|
|
|
| 25-Oct-05 |
258 |
|
|
|
|
|
|
|
|
|
|
|
|
|
|
|
|
|
|
|
| 26-Oct-05 |
259 |
|
|
|
|
|
|
|
|
|
|
|
|
|
|
|
|
|
|
|
| 27-Oct-05 |
248 |
|
|
|
|
|
|
|
|
|
|
|
|
|
|
|
|
|
|
|
| 28-Oct-05 |
241 |
|
|
|
|
|
|
|
|
|
|
|
|
|
|
|
|
|
|
|
| 29-Oct-05 |
230 |
|
|
|
|
|
|
|
|
|
|
|
|
|
|
|
|
|
|
|
| 30-Oct-05 |
227 |
|
|
|
|
|
|
|
|
|
|
|
|
|
|
|
|
|
|
|
| 31-Oct-05 |
245 |
|
|
|
|
|
|
|
|
|
|
|
|
|
|
|
|
|
|
|
| 1-Nov-05 |
264 |
|
|
|
|
|
|
|
|
|
|
|
|
|
|
|
|
|
|
|
| 2-Nov-05 |
268 |
|
|
|
|
|
|
|
|
|
|
|
|
|
|
|
|
|
|
|
| 3-Nov-05 |
266 |
|
|
|
|
|
|
|
|
|
|
|
|
|
|
|
|
|
|
|
| 4-Nov-05 |
247 |
|
|
|
|
|
|
|
|
|
|
|
|
|
|
|
|
|
|
|
| 5-Nov-05 |
211 |
|
|
|
|
|
|
|
|
|
|
|
|
|
|
|
|
|
|
|
| 6-Nov-05 |
213 |
|
|
|
|
|
|
|
|
|
|
|
|
|
|
|
|
|
|
|
| 7-Nov-05 |
232 |
|
|
|
|
|
|
|
|
|
|
|
|
|
|
|
|
|
|
|
| 8-Nov-05 |
248 |
|
|
|
|
|
|
|
|
|
|
|
|
|
|
|
|
|
|
|
| 9-Nov-05 |
247 |
|
|
|
|
|
|
|
|
|
|
|
|
|
|
|
|
|
|
|
| 10-Nov-05 |
216 |
|
|
|
|
|
|
|
|
|
|
|
|
|
|
|
|
|
|
|
| 11-Nov-05 |
203 |
|
|
|
|
|
|
|
|
|
|
|
|
|
|
|
|
|
|
|
| 12-Nov-05 |
204 |
|
|
|
|
|
|
|
|
|
|
|
|
|
|
|
|
|
|
|
| 13-Nov-05 |
208 |
|
|
|
|
|
|
|
|
|
|
|
|
|
|
|
|
|
|
|
| 14-Nov-05 |
211 |
|
|
|
|
|
|
|
|
|
|
|
|
|
|
|
|
|
|
|
| 15-Nov-05 |
216 |
|
|
|
|
|
|
|
|
|
|
|
|
|
|
|
|
|
|
|
| 16-Nov-05 |
236 |
|
|
|
|
|
|
|
|
|
|
|
|
|
|
|
|
|
|
|
| 17-Nov-05 |
260 |
|
|
|
|
|
|
|
|
|
|
|
|
|
|
|
|
|
|
|
| 18-Nov-05 |
276 |
|
|
|
|
|
|
|
|
|
|
|
|
|
|
|
|
|
|
|
| 19-Nov-05 |
287 |
|
|
|
|
|
|
|
|
|
|
|
|
|
|
|
|
|
|
|
| 20-Nov-05 |
294 |
|
|
|
|
|
|
|
|
|
|
|
|
|
|
|
|
|
|
|
| 21-Nov-05 |
293 |
|
|
|
|
|
|
|
|
|
|
|
|
|
|
|
|
|
|
|
| 22-Nov-05 |
240 |
|
|
|
|
|
|
|
|
|
|
|
|
|
|
|
|
|
|
|
| 23-Nov-05 |
188 |
|
|
|
|
|
|
|
|
|
|
|
|
|
|
|
|
|
|
|
| 24-Nov-05 |
143 |
|
|
|
|
|
|
|
|
|
|
|
|
|
|
|
|
|
|
|
| 25-Nov-05 |
130 |
|
|
|
|
|
|
|
|
|
|
|
|
|
|
|
|
|
|
|
| 26-Nov-05 |
140 |
|
|
|
|
|
|
|
|
|
|
|
|
|
|
|
|
|
|
|
| 27-Nov-05 |
132 |
|
|
|
|
|
|
|
|
|
|
|
|
|
|
|
|
|
|
|
| 28-Nov-05 |
168 |
|
|
|
|
|
|
|
|
|
|
|
|
|
|
|
|
|
|
|
| 29-Nov-05 |
182 |
|
|
|
|
|
|
|
|
|
|
|
|
|
|
|
|
|
|
|
| 30-Nov-05 |
220 |
|
|
|
|
|
|
|
|
|
|
|
|
|
|
|
|
|
|
|
| 1-Dec-05 |
275 |
|
|
|
|
|
|
|
|
|
|
|
|
|
|
|
|
|
|
|
| 2-Dec-05 |
294 |
|
|
|
|
|
|
|
|
|
|
|
|
|
|
|
|
|
|
|
| 3-Dec-05 |
307 |
|
|
|
|
|
|
|
|
|
|
|
|
|
|
|
|
|
|
|
| 4-Dec-05 |
325 |
|
|
|
|
|
|
|
|
|
|
|
|
|
|
|
|
|
|
|
| 5-Dec-05 |
324 |
|
|
|
|
|
|
|
|
|
|
|
|
|
|
|
|
|
|
|
| 6-Dec-05 |
329 |
|
|
|
|
|
|
|
|
|
|
|
|
|
|
|
|
|
|
|
| 7-Dec-05 |
341 |
|
|
|
|
|
|
|
|
|
|
|
|
|
|
|
|
|
|
|
| 8-Dec-05 |
340 |
|
|
|
|
|
|
|
|
|
|
|
|
|
|
|
|
|
|
|
| 9-Dec-05 |
333 |
|
|
|
|
|
|
|
|
|
|
|
|
|
|
|
|
|
|
|
| 10-Dec-05 |
329 |
|
|
|
|
|
|
|
|
|
|
|
|
|
|
|
|
|
|
|
| 11-Dec-05 |
317 |
|
|
|
|
|
|
|
|
|
|
|
|
|
|
|
|
|
|
|
| 12-Dec-05 |
302 |
|
|
|
|
|
|
|
|
|
|
|
|
|
|
|
|
|
|
|
| 13-Dec-05 |
290 |
|
|
|
|
|
|
|
|
|
|
|
|
|
|
|
|
|
|
|
| 14-Dec-05 |
277 |
|
|
|
|
|
|
|
|
|
|
|
|
|
|
|
|
|
|
|
| 15-Dec-05 |
270 |
|
|
|
|
|
|
|
|
|
|
|
|
|
|
|
|
|
|
|
| 16-Dec-05 |
273 |
|
|
|
|
|
|
|
|
|
|
|
|
|
|
|
|
|
|
|
| 17-Dec-05 |
258 |
|
|
|
|
|
|
|
|
|
|
|
|
|
|
|
|
|
|
|
| 18-Dec-05 |
248 |
|
|
|
|
|
|
|
|
|
|
|
|
|
|
|
|
|
|
|
| 19-Dec-05 |
257 |
|
|
|
|
|
|
|
|
|
|
|
|
|
|
|
|
|
|
|
| 20-Dec-05 |
271 |
|
|
|
|
|
|
|
|
|
|
|
|
|
|
|
|
|
|
|
| 21-Dec-05 |
296 |
|
|
|
|
|
|
|
|
|
|
|
|
|
|
|
|
|
|
|
| 22-Dec-05 |
306 |
|
|
|
|
|
|
|
|
|
|
|
|
|
|
|
|
|
|
|
| 23-Dec-05 |
299 |
|
|
|
|
|
|
|
|
|
|
|
|
|
|
|
|
|
|
|
| 24-Dec-05 |
239 |
|
|
|
|
|
|
|
|
|
|
|
|
|
|
|
|
|
|
|
| 25-Dec-05 |
180 |
|
|
|
|
|
|
|
|
|
|
|
|
|
|
|
|
|
|
|
| 26-Dec-05 |
187 |
|
|
|
|
|
|
|
|
|
|
|
|
|
|
|
|
|
|
|
| 27-Dec-05 |
208 |
|
|
|
|
|
|
|
|
|
|
|
|
|
|
|
|
|
|
|
| 28-Dec-05 |
226 |
|
|
|
|
|
|
|
|
|
|
|
|
|
|
|
|
|
|
|
| 29-Dec-05 |
236 |
|
|
|
|
|
|
|
|
|
|
|
|
|
|
|
|
|
|
|
| 30-Dec-05 |
235 |
|
|
|
|
|
|
|
|
|
|
|
|
|
|
|
|
|
|
|
| 31-Dec-05 |
231 |
|
|
|
|
|
|
|
|
|
|
|
|
|
|
|
|
|
|
|
| 1-Jan-06 |
248 |
|
|
|
|
|
|
|
|
|
|
|
|
|
|
|
|
|
|
|
| 2-Jan-06 |
288 |
|
|
|
|
|
|
|
|
|
|
|
|
|
|
|
|
|
|
|
| 3-Jan-06 |
290 |
|
|
|
|
|
|
|
|
|
|
|
|
|
|
|
|
|
|
|
| 4-Jan-06 |
292 |
|
|
|
|
|
|
|
|
|
|
|
|
|
|
|
|
|
|
|
| 5-Jan-06 |
284 |
|
|
|
|
|
|
|
|
|
|
|
|
|
|
|
|
|
|
|
| 6-Jan-06 |
271 |
|
|
|
|
|
|
|
|
|
|
|
|
|
|
|
|
|
|
|
| 7-Jan-06 |
269 |
|
|
|
|
|
|
|
|
|
|
|
|
|
|
|
|
|
|
|
| 8-Jan-06 |
243 |
|
|
|
|
|
|
|
|
|
|
|
|
|
|
|
|
|
|
|
| 9-Jan-06 |
226 |
|
|
|
|
|
|
|
|
|
|
|
|
|
|
|
|
|
|
|
| 10-Jan-06 |
292 |
|
|
|
|
|
|
|
|
|
|
|
|
|
|
|
|
|
|
|
| 11-Jan-06 |
293 |
|
|
|
|
|
|
|
|
|
|
|
|
|
|
|
|
|
|
|
| 12-Jan-06 |
308 |
|
|
|
|
|
|
|
|
|
|
|
|
|
|
|
|
|
|
|
| 13-Jan-06 |
288 |
|
|
|
|
|
|
|
|
|
|
|
|
|
|
|
|
|
|
|
| 14-Jan-06 |
264 |
|
|
|
|
|
|
|
|
|
|
|
|
|
|
|
|
|
|
|
| 15-Jan-06 |
259 |
|
|
|
|
|
|
|
|
|
|
|
|
|
|
|
|
|
|
|
| 16-Jan-06 |
239 |
|
|
|
|
|
|
|
|
|
|
|
|
|
|
|
|
|
|
|
| 17-Jan-06 |
224 |
|
|
|
|
|
|
|
|
|
|
|
|
|
|
|
|
|
|
|
| 18-Jan-06 |
205 |
|
|
|
|
|
|
|
|
|
|
|
|
|
|
|
|
|
|
|
| 19-Jan-06 |
198 |
|
|
|
|
|
|
|
|
|
|
|
|
|
|
|
|
|
|
|
| 20-Jan-06 |
219 |
|
|
|
|
|
|
|
|
|
|
|
|
|
|
|
|
|
|
|
| 21-Jan-06 |
228 |
|
|
|
|
|
|
|
|
|
|
|
|
|
|
|
|
|
|
|
| 22-Jan-06 |
235 |
|
|
|
|
|
|
|
|
|
|
|
|
|
|
|
|
|
|
|
| 23-Jan-06 |
235 |
|
|
|
|
|
|
|
|
|
|
|
|
|
|
|
|
|
|
|
| 24-Jan-06 |
208 |
|
|
|
|
|
|
|
|
|
|
|
|
|
|
|
|
|
|
|
| 25-Jan-06 |
193 |
|
|
|
|
|
|
|
|
|
|
|
|
|
|
|
|
|
|
|
| 26-Jan-06 |
193 |
|
|
|
|
|
|
|
|
|
|
|
|
|
|
|
|
|
|
|
| 27-Jan-06 |
193 |
|
|
|
|
|
|
|
|
|
|
|
|
|
|
|
|
|
|
|
| 28-Jan-06 |
260 |
|
|
|
|
|
|
|
|
|
|
|
|
|
|
|
|
|
|
|
| 29-Jan-06 |
206 |
|
|
|
|
|
|
|
|
|
|
|
|
|
|
|
|
|
|
|
| 30-Jan-06 |
195 |
|
|
|
|
|
|
|
|
|
|
|
|
|
|
|
|
|
|
|
| 31-Jan-06 |
164 |
|
|
|
|
|
|
|
|
|
|
|
|
|
|
|
|
|
|
|
| 1-Feb-06 |
135 |
|
|
|
|
|
|
|
|
|
|
|
|
|
|
|
|
|
|
|
| 2-Feb-06 |
164 |
|
|
|
|
|
|
|
|
|
|
|
|
|
|
|
|
|
|
|
| 3-Feb-06 |
159 |
|
|
|
|
|
|
|
|
|
|
|
|
|
|
|
|
|
|
|
| 4-Feb-06 |
245 |
|
|
|
|
|
|
|
|
|
|
|
|
|
|
|
|
|
|
|
| 5-Feb-06 |
257 |
|
|
|
|
|
|
|
|
|
|
|
|
|
|
|
|
|
|
|
| 6-Feb-06 |
247 |
|
|
|
|
|
|
|
|
|
|
|
|
|
|
|
|
|
|
|
| 7-Feb-06 |
252 |
|
|
|
|
|
|
|
|
|
|
|
|
|
|
|
|
|
|
|
| 8-Feb-06 |
255 |
|
|
|
|
|
|
|
|
|
|
|
|
|
|
|
|
|
|
|
| 9-Feb-06 |
255 |
|
|
|
|
|
|
|
|
|
|
|
|
|
|
|
|
|
|
|
| 10-Feb-06 |
273 |
|
|
|
|
|
|
|
|
|
|
|
|
|
|
|
|
|
|
|
| 11-Feb-06 |
224 |
|
|
|
|
|
|
|
|
|
|
|
|
|
|
|
|
|
|
|
| 12-Feb-06 |
224 |
|
|
|
|
|
|
|
|
|
|
|
|
|
|
|
|
|
|
|
| 13-Feb-06 |
206 |
|
|
|
|
|
|
|
|
|
|
|
|
|
|
|
|
|
|
|
| 14-Feb-06 |
219 |
|
|
|
|
|
|
|
|
|
|
|
|
|
|
|
|
|
|
|
| 15-Feb-06 |
248 |
|
|
|
|
|
|
|
|
|
|
|
|
|
|
|
|
|
|
|
| 16-Feb-06 |
251 |
|
|
|
|
|
|
|
|
|
|
|
|
|
|
|
|
|
|
|
| 17-Feb-06 |
254 |
|
|
|
|
|
|
|
|
|
|
|
|
|
|
|
|
|
|
|
| 18-Feb-06 |
237 |
|
|
|
|
|
|
|
|
|
|
|
|
|
|
|
|
|
|
|
| 19-Feb-06 |
228 |
|
|
|
|
|
|
|
|
|
|
|
|
|
|
|
|
|
|
|
| 20-Feb-06 |
221 |
|
|
|
|
|
|
|
|
|
|
|
|
|
|
|
|
|
|
|
| 21-Feb-06 |
232 |
|
|
|
|
|
|
|
|
|
|
|
|
|
|
|
|
|
|
|
| 22-Feb-06 |
260 |
|
|
|
|
|
|
|
|
|
|
|
|
|
|
|
|
|
|
|
| 23-Feb-06 |
260 |
|
|
|
|
|
|
|
|
|
|
|
|
|
|
|
|
|
|
|
| 24-Feb-06 |
266 |
|
|
|
|
|
|
|
|
|
|
|
|
|
|
|
|
|
|
|
| 25-Feb-06 |
239 |
|
|
|
|
|
|
|
|
|
|
|
|
|
|
|
|
|
|
|
| 26-Feb-06 |
198 |
|
|
|
|
|
|
|
|
|
|
|
|
|
|
|
|
|
|
|
| 27-Feb-06 |
218 |
|
|
|
|
|
|
|
|
|
|
|
|
|
|
|
|
|
|
|
| 28-Feb-06 |
218 |
|
|
|
|
|
|
|
|
|
|
|
|
|
|
|
|
|
|
|
| 1-Mar-06 |
240 |
|
|
|
|
|
|
|
|
|
|
|
|
|
|
|
|
|
|
|
| 2-Mar-06 |
251 |
|
|
|
|
|
|
|
|
|
|
|
|
|
|
|
|
|
|
|
| 3-Mar-06 |
235 |
|
|
|
|
|
|
|
|
|
|
|
|
|
|
|
|
|
|
|
| 4-Mar-06 |
243 |
|
|
|
|
|
|
|
|
|
|
|
|
|
|
|
|
|
|
|
| 5-Mar-06 |
243 |
|
|
|
|
|
|
|
|
|
|
|
|
|
|
|
|
|
|
|
| 6-Mar-06 |
229 |
|
|
|
|
|
|
|
|
|
|
|
|
|
|
|
|
|
|
|
| 7-Mar-06 |
247 |
|
|
|
|
|
|
|
|
|
|
|
|
|
|
|
|
|
|
|
| 8-Mar-06 |
256 |
|
|
|
|
|
|
|
|
|
|
|
|
|
|
|
|
|
|
|
| 9-Mar-06 |
270 |
|
|
|
|
|
|
|
|
|
|
|
|
|
|
|
|
|
|
|
| 10-Mar-06 |
277 |
|
|
|
|
|
|
|
|
|
|
|
|
|
|
|
|
|
|
|
| 11-Mar-06 |
253 |
|
|
|
|
|
|
|
|
|
|
|
|
|
|
|
|
|
|
|
| 12-Mar-06 |
243 |
|
|
|
|
|
|
|
|
|
|
|
|
|
|
|
|
|
|
|
| 13-Mar-06 |
219 |
|
|
|
|
|
|
|
|
|
|
|
|
|
|
|
|
|
|
|
| 14-Mar-06 |
203 |
|
|
|
|
|
|
|
|
|
|
|
|
|
|
|
|
|
|
|
| 15-Mar-06 |
252 |
|
|
|
|
|
|
|
|
|
|
|
|
|
|
|
|
|
|
|
| 16-Mar-06 |
252 |
|
|
|
|
|
|
|
|
|
|
|
|
|
|
|
|
|
|
|
| 17-Mar-06 |
275 |
|
|
|
|
|
|
|
|
|
|
|
|
|
|
|
|
|
|
|
| 18-Mar-06 |
284 |
|
|
|
|
|
|
|
|
|
|
|
|
|
|
|
|
|
|
|
| 19-Mar-06 |
315 |
|
|
|
|
|
|
|
|
|
|
|
|
|
|
|
|
|
|
|
| 20-Mar-06 |
312 |
|
|
|
|
|
|
|
|
|
|
|
|
|
|
|
|
|
|
|
| 21-Mar-06 |
325 |
|
|
|
|
|
|
|
|
|
|
|
|
|
|
|
|
|
|
|
| 22-Mar-06 |
349 |
|
|
|
|
|
|
|
|
|
|
|
|
|
|
|
|
|
|
|
| 23-Mar-06 |
337 |
|
|
|
|
|
|
|
|
|
|
|
|
|
|
|
|
|
|
|
| 24-Mar-06 |
366 |
|
|
|
|
|
|
|
|
|
|
|
|
|
|
|
|
|
|
|
| 25-Mar-06 |
356 |
|
|
|
|
|
|
|
|
|
|
|
|
|
|
|
|
|
|
|
| 26-Mar-06 |
499 |
|
|
|
|
|
|
|
|
|
|
|
|
|
|
|
|
|
|
|
| 27-Mar-06 |
451 |
|
|
|
|
|
|
|
|
|
|
|
|
|
|
|
|
|
|
|
| 28-Mar-06 |
496 |
|
|
|
|
|
|
|
|
|
|
|
|
|
|
|
|
|
|
|
| 29-Mar-06 |
483 |
|
|
|
|
|
|
|
|
|
|
|
|
|
|
|
|
|
|
|
| 30-Mar-06 |
398 |
|
|
|
|
|
|
|
|
|
|
|
|
|
|
|
|
|
|
|
| 31-Mar-06 |
497 |
|
|
|
|
|
|
|
|
|
|
|
|
|
|
|
|
|
|
|
| 1-Apr-06 |
497 |
|
|
|
|
|
|
|
|
|
|
|
|
|
|
|
|
|
|
|
| 2-Apr-06 |
679 |
|
|
|
|
|
|
|
|
|
|
|
|
|
|
|
|
|
|
|
| 3-Apr-06 |
638 |
|
|
|
|
|
|
|
|
|
|
|
|
|
|
|
|
|
|
|
| 4-Apr-06 |
668 |
|
|
|
|
|
|
|
|
|
|
|
|
|
|
|
|
|
|
|
| 5-Apr-06 |
645 |
|
|
|
|
|
|
|
|
|
|
|
|
|
|
|
|
|
|
|
| 6-Apr-06 |
568 |
|
|
|
|
|
|
|
|
|
|
|
|
|
|
|
|
|
|
|
| 7-Apr-06 |
777 |
|
|
|
|
|
|
|
|
|
|
|
|
|
|
|
|
|
|
|
| 8-Apr-06 |
775 |
|
|
|
|
|
|
|
|
|
|
|
|
|
|
|
|
|
|
|
| 9-Apr-06 |
1003 |
|
|
|
|
|
|
|
|
|
|
|
|
|
|
|
|
|
|
|
| 10-Apr-06 |
946 |
|
|
|
|
|
|
|
|
|
|
|
|
|
|
|
|
|
|
|
| 11-Apr-06 |
949 |
|
|
|
|
|
|
|
|
|
|
|
|
|
|
|
|
|
|
|
| 12-Apr-06 |
907 |
|
|
|
|
|
|
|
|
|
|
|
|
|
|
|
|
|
|
|
| 13-Apr-06 |
864 |
|
|
|
|
|
|
|
|
|
|
|
|
|
|
|
|
|
|
|
| 14-Apr-06 |
856 |
|
|
|
|
|
|
|
|
|
|
|
|
|
|
|
|
|
|
|
| 15-Apr-06 |
798 |
|
|
|
|
|
|
|
|
|
|
|
|
|
|
|
|
|
|
|
| 16-Apr-06 |
954 |
|
|
|
|
|
|
|
|
|
|
|
|
|
|
|
|
|
|
|
| 17-Apr-06 |
954 |
|
|
|
|
|
|
|
|
|
|
|
|
|
|
|
|
|
|
|
| 18-Apr-06 |
1144 |
|
|
|
|
|
|
|
|
|
|
|
|
|
|
|
|
|
|
|
| 19-Apr-06 |
1045 |
|
|
|
|
|
|
|
|
|
|
|
|
|
|
|
|
|
|
|
| 20-Apr-06 |
1064 |
|
|
|
|
|
|
|
|
|
|
|
|
|
|
|
|
|
|
|
| 21-Apr-06 |
1007 |
|
|
|
|
|
|
|
|
|
|
|
|
|
|
|
|
|
|
|
| 22-Apr-06 |
947 |
|
|
|
|
|
|
|
|
|
|
|
|
|
|
|
|
|
|
|
| 23-Apr-06 |
990 |
|
|
|
|
|
|
|
|
|
|
|
|
|
|
|
|
|
|
|
| 24-Apr-06 |
910 |
|
|
|
|
|
|
|
|
|
|
|
|
|
|
|
|
|
|
|
| 25-Apr-06 |
1009 |
|
|
|
|
|
|
|
|
|
|
|
|
|
|
|
|
|
|
|
| 26-Apr-06 |
975 |
|
|
|
|
|
|
|
|
|
|
|
|
|
|
|
|
|
|
|
| 27-Apr-06 |
965 |
|
|
|
|
|
|
|
|
|
|
|
|
|
|
|
|
|
|
|
| 28-Apr-06 |
941 |
|
|
|
|
|
|
|
|
|
|
|
|
|
|
|
|
|
|
|
| 29-Apr-06 |
910 |
|
|
|
|
|
|
|
|
|
|
|
|
|
|
|
|
|
|
|
| 30-Apr-06 |
872 |
|
|
|
|
|
|
|
|
|
|
|
|
|
|
|
|
|
|
|
| 1-May-06 |
834 |
|
|
|
|
|
|
|
|
|
|
|
|
|
|
|
|
|
|
|
| 2-May-06 |
882 |
|
|
|
|
|
|
|
|
|
|
|
|
|
|
|
|
|
|
|
| 3-May-06 |
882 |
|
|
|
|
|
|
|
|
|
|
|
|
|
|
|
|
|
|
|
| 4-May-06 |
941 |
|
|
|
|
|
|
|
|
|
|
|
|
|
|
|
|
|
|
|
| 5-May-06 |
914 |
|
|
|
|
|
|
|
|
|
|
|
|
|
|
|
|
|
|
|
| 6-May-06 |
938 |
|
|
|
|
|
|
|
|
|
|
|
|
|
|
|
|
|
|
|
| 7-May-06 |
908 |
|
|
|
|
|
|
|
|
|
|
|
|
|
|
|
|
|
|
|
| 8-May-06 |
908 |
|
|
|
|
|
|
|
|
|
|
|
|
|
|
|
|
|
|
|
| 9-May-06 |
906 |
|
|
|
|
|
|
|
|
|
|
|
|
|
|
|
|
|
|
|
| 10-May-06 |
840 |
|
|
|
|
|
|
|
|
|
|
|
|
|
|
|
|
|
|
|
| 11-May-06 |
859 |
|
|
|
|
|
|
|
|
|
|
|
|
|
|
|
|
|
|
|
| 12-May-06 |
724 |
|
|
|
|
|
|
|
|
|
|
|
|
|
|
|
|
|
|
|
| 13-May-06 |
735 |
|
|
|
|
|
|
|
|
|
|
|
|
|
|
|
|
|
|
|
| 14-May-06 |
736 |
|
|
|
|
|
|
|
|
|
|
|
|
|
|
|
|
|
|
|
| 15-May-06 |
736 |
|
|
|
|
|
|
|
|
|
|
|
|
|
|
|
|
|
|
|
| 16-May-06 |
798 |
|
|
|
|
|
|
|
|
|
|
|
|
|
|
|
|
|
|
|
| 17-May-06 |
757 |
|
|
|
|
|
|
|
|
|
|
|
|
|
|
|
|
|
|
|
| 18-May-06 |
794 |
|
|
|
|
|
|
|
|
|
|
|
|
|
|
|
|
|
|
|
| 19-May-06 |
794 |
|
|
|
|
|
|
|
|
|
|
|
|
|
|
|
|
|
|
|
| 20-May-06 |
805 |
|
|
|
|
|
|
|
|
|
|
|
|
|
|
|
|
|
|
|
| 21-May-06 |
786 |
|
|
|
|
|
|
|
|
|
|
|
|
|
|
|
|
|
|
|
| 22-May-06 |
788 |
|
|
|
|
|
|
|
|
|
|
|
|
|
|
|
|
|
|
|
| 23-May-06 |
729 |
|
|
|
|
|
|
|
|
|
|
|
|
|
|
|
|
|
|
|
| 24-May-06 |
707 |
|
|
|
|
|
|
|
|
|
|
|
|
|
|
|
|
|
|
|
| 25-May-06 |
637 |
|
|
|
|
|
|
|
|
|
|
|
|
|
|
|
|
|
|
|
| 26-May-06 |
551 |
|
|
|
|
|
|
|
|
|
|
|
|
|
|
|
|
|
|
|
| 27-May-06 |
565 |
|
|
|
|
|
|
|
|
|
|
|
|
|
|
|
|
|
|
|
| 28-May-06 |
573 |
|
|
|
|
|
|
|
|
|
|
|
|
|
|
|
|
|
|
|
| 29-May-06 |
613 |
|
|
|
|
|
|
|
|
|
|
|
|
|
|
|
|
|
|
|
| 30-May-06 |
604 |
|
|
|
|
|
|
|
|
|
|
|
|
|
|
|
|
|
|
|
| 31-May-06 |
606 |
|
|
|
|
|
|
|
|
|
|
|
|
|
|
|
|
|
|
|
| 1-Jun-06 |
585 |
|
|
|
|
|
|
|
|
|
|
|
|
|
|
|
|
|
|
|
| 2-Jun-06 |
552 |
|
|
|
|
|
|
|
|
|
|
|
|
|
|
|
|
|
|
|
| 3-Jun-06 |
525 |
|
|
|
|
|
|
|
|
|
|
|
|
|
|
|
|
|
|
|
| 4-Jun-06 |
525 |
|
|
|
|
|
|
|
|
|
|
|
|
|
|
|
|
|
|
|
| 5-Jun-06 |
545 |
|
|
|
|
|
|
|
|
|
|
|
|
|
|
|
|
|
|
|
| 6-Jun-06 |
523 |
|
|
|
|
|
|
|
|
|
|
|
|
|
|
|
|
|
|
|
| 7-Jun-06 |
468 |
|
|
|
|
|
|
|
|
|
|
|
|
|
|
|
|
|
|
|
| 8-Jun-06 |
459 |
|
|
|
|
|
|
|
|
|
|
|
|
|
|
|
|
|
|
|
| 9-Jun-06 |
426 |
|
|
|
|
|
|
|
|
|
|
|
|
|
|
|
|
|
|
|
| 10-Jun-06 |
386 |
|
|
|
|
|
|
|
|
|
|
|
|
|
|
|
|
|
|
|
| 11-Jun-06 |
397 |
|
|
|
|
|
|
|
|
|
|
|
|
|
|
|
|
|
|
|
| 12-Jun-06 |
383 |
|
|
|
|
|
|
|
|
|
|
|
|
|
|
|
|
|
|
|
| 13-Jun-06 |
405 |
|
|
|
|
|
|
|
|
|
|
|
|
|
|
|
|
|
|
|
| 14-Jun-06 |
440 |
|
|
|
|
|
|
|
|
|
|
|
|
|
|
|
|
|
|
|
| 15-Jun-06 |
414 |
|
|
|
|
|
|
|
|
|
|
|
|
|
|
|
|
|
|
|
| 16-Jun-06 |
|
|
|
|
|
|
|
|
|
|
|
|
|
|
|
|
|
|
|
|
| 17-Jun-06 |
386 |
|
|
|
|
|
|
|
|
|
|
|
|
|
|
|
|
|
|
|
| 18-Jun-06 |
386 |
|
|
|
|
|
|
|
|
|
|
|
|
|
|
|
|
|
|
|
| 19-Jun-06 |
389 |
|
|
|
|
|
|
|
|
|
|
|
|
|
|
|
|
|
|
|
| 20-Jun-06 |
389 |
|
|
|
|
|
|
|
|
|
|
|
|
|
|
|
|
|
|
|
| 21-Jun-06 |
372 |
|
|
|
|
|
|
|
|
|
|
|
|
|
|
|
|
|
|
|
| 22-Jun-06 |
363 |
|
|
|
|
|
|
|
|
|
|
|
|
|
|
|
|
|
|
|
| 23-Jun-06 |
350 |
|
|
|
|
|
|
|
|
|
|
|
|
|
|
|
|
|
|
|
| 24-Jun-06 |
338 |
|
|
|
|
|
|
|
|
|
|
|
|
|
|
|
|
|
|
|
| 25-Jun-06 |
332 |
|
|
|
|
|
|
|
|
|
|
|
|
|
|
|
|
|
|
|
| 26-Jun-06 |
319 |
|
|
|
|
|
|
|
|
|
|
|
|
|
|
|
|
|
|
|
| 27-Jun-06 |
304 |
|
|
|
|
|
|
|
|
|
|
|
|
|
|
|
|
|
|
|
| 28-Jun-06 |
283 |
|
|
|
|
|
|
|
|
|
|
|
|
|
|
|
|
|
|
|
| 29-Jun-06 |
283 |
|
|
|
|
|
|
|
|
|
|
|
|
|
|
|
|
|
|
|
| 30-Jun-06 |
286 |
|
|
|
|
|
|
|
|
|
|
|
|
|
|
|
|
|
|
|
| 1-Jul-06 |
268 |
|
|
|
|
|
|
|
|
|
|
|
|
|
|
|
|
|
|
|
| 2-Jul-06 |
270 |
|
|
|
|
|
|
|
|
|
|
|
|
|
|
|
|
|
|
|
| 3-Jul-06 |
266 |
|
|
|
|
|
|
|
|
|
|
|
|
|
|
|
|
|
|
|
| 4-Jul-06 |
243 |
|
|
|
|
|
|
|
|
|
|
|
|
|
|
|
|
|
|
|
| 5-Jul-06 |
279 |
|
|
|
|
|
|
|
|
|
|
|
|
|
|
|
|
|
|
|
| 6-Jul-06 |
279 |
|
|
|
|
|
|
|
|
|
|
|
|
|
|
|
|
|
|
|
| 7-Jul-06 |
320 |
|
|
|
|
|
|
|
|
|
|
|
|
|
|
|
|
|
|
|
| 8-Jul-06 |
301 |
|
|
|
|
|
|
|
|
|
|
|
|
|
|
|
|
|
|
|
| 9-Jul-06 |
316 |
|
|
|
|
|
|
|
|
|
|
|
|
|
|
|
|
|
|
|
| 10-Jul-06 |
302 |
|
|
|
|
|
|
|
|
|
|
|
|
|
|
|
|
|
|
|
| 11-Jul-06 |
285 |
|
|
|
|
|
|
|
|
|
|
|
|
|
|
|
|
|
|
|
| 12-Jul-06 |
295 |
|
|
|
|
|
|
|
|
|
|
|
|
|
|
|
|
|
|
|
| 13-Jul-06 |
278 |
|
|
|
|
|
|
|
|
|
|
|
|
|
|
|
|
|
|
|
| 14-Jul-06 |
289 |
|
|
|
|
|
|
|
|
|
|
|
|
|
|
|
|
|
|
|
| 15-Jul-06 |
291 |
|
|
|
|
|
|
|
|
|
|
|
|
|
|
|
|
|
|
|
| 16-Jul-06 |
263 |
|
|
|
|
|
|
|
|
|
|
|
|
|
|
|
|
|
|
|
| 17-Jul-06 |
255 |
|
|
|
|
|
|
|
|
|
|
|
|
|
|
|
|
|
|
|
| 18-Jul-06 |
237 |
|
|
|
|
|
|
|
|
|
|
|
|
|
|
|
|
|
|
|
| 19-Jul-06 |
250 |
|
|
|
|
|
|
|
|
|
|
|
|
|
|
|
|
|
|
|
| 20-Jul-06 |
252 |
|
|
|
|
|
|
|
|
|
|
|
|
|
|
|
|
|
|
|
| 21-Jul-06 |
276 |
|
|
|
|
|
|
|
|
|
|
|
|
|
|
|
|
|
|
|
| 22-Jul-06 |
276 |
|
|
|
|
|
|
|
|
|
|
|
|
|
|
|
|
|
|
|
| 23-Jul-06 |
296 |
|
|
|
|
|
|
|
|
|
|
|
|
|
|
|
|
|
|
|
| 24-Jul-06 |
293 |
|
|
|
|
|
|
|
|
|
|
|
|
|
|
|
|
|
|
|
| 25-Jul-06 |
277 |
|
|
|
|
|
|
|
|
|
|
|
|
|
|
|
|
|
|
|
| 26-Jul-06 |
264 |
|
|
|
|
|
|
|
|
|
|
|
|
|
|
|
|
|
|
|
| 27-Jul-06 |
249 |
|
|
|
|
|
|
|
|
|
|
|
|
|
|
|
|
|
|
|
| 28-Jul-06 |
236 |
|
|
|
|
|
|
|
|
|
|
|
|
|
|
|
|
|
|
|
| 29-Jul-06 |
236 |
|
|
|
|
|
|
|
|
|
|
|
|
|
|
|
|
|
|
|
| 30-Jul-06 |
249 |
|
|
|
|
|
|
|
|
|
|
|
|
|
|
|
|
|
|
|
| 31-Jul-06 |
279 |
|
|
|
|
|
|
|
|
|
|
|
|
|
|
|
|
|
|
|
| 1-Aug-06 |
247 |
|
|
|
|
|
|
|
|
|
|
|
|
|
|
|
|
|
|
|
| 2-Aug-06 |
231 |
|
|
|
|
|
|
|
|
|
|
|
|
|
|
|
|
|
|
|
| 3-Aug-06 |
221 |
|
|
|
|
|
|
|
|
|
|
|
|
|
|
|
|
|
|
|
| 4-Aug-06 |
221 |
|
|
|
|
|
|
|
|
|
|
|
|
|
|
|
|
|
|
|
| 5-Aug-06 |
216 |
|
|
|
|
|
|
|
|
|
|
|
|
|
|
|
|
|
|
|
| 6-Aug-06 |
216 |
|
|
|
|
|
|
|
|
|
|
|
|
|
|
|
|
|
|
|
| 7-Aug-06 |
222 |
|
|
|
|
|
|
|
|
|
|
|
|
|
|
|
|
|
|
|
| 8-Aug-06 |
212 |
|
|
|
|
|
|
|
|
|
|
|
|
|
|
|
|
|
|
|
| 9-Aug-06 |
229 |
|
|
|
|
|
|
|
|
|
|
|
|
|
|
|
|
|
|
|
| 10-Aug-06 |
227 |
|
|
|
|
|
|
|
|
|
|
|
|
|
|
|
|
|
|
|
| 11-Aug-06 |
228 |
|
|
|
|
|
|
|
|
|
|
|
|
|
|
|
|
|
|
|
| 12-Aug-06 |
244 |
|
|
|
|
|
|
|
|
|
|
|
|
|
|
|
|
|
|
|
| 13-Aug-06 |
230 |
|
|
|
|
|
|
|
|
|
|
|
|
|
|
|
|
|
|
|
| 14-Aug-06 |
227 |
|
|
|
|
|
|
|
|
|
|
|
|
|
|
|
|
|
|
|
| 15-Aug-06 |
225 |
|
|
|
|
|
|
|
|
|
|
|
|
|
|
|
|
|
|
|
| 16-Aug-06 |
200 |
|
|
|
|
|
|
|
|
|
|
|
|
|
|
|
|
|
|
|
| 17-Aug-06 |
193 |
|
|
|
|
|
|
|
|
|
|
|
|
|
|
|
|
|
|
|
| 18-Aug-06 |
187 |
|
|
|
|
|
|
|
|
|
|
|
|
|
|
|
|
|
|
|
| 19-Aug-06 |
200 |
|
|
|
|
|
|
|
|
|
|
|
|
|
|
|
|
|
|
|
| 20-Aug-06 |
200 |
|
|
|
|
|
|
|
|
|
|
|
|
|
|
|
|
|
|
|
| 21-Aug-06 |
214 |
|
|
|
|
|
|
|
|
|
|
|
|
|
|
|
|
|
|
|
| 22-Aug-06 |
214 |
|
|
|
|
|
|
|
|
|
|
|
|
|
|
|
|
|
|
|
| 23-Aug-06 |
199 |
|
|
|
|
|
|
|
|
|
|
|
|
|
|
|
|
|
|
|
| 24-Aug-06 |
184 |
|
|
|
|
|
|
|
|
|
|
|
|
|
|
|
|
|
|
|
| 25-Aug-06 |
168 |
|
|
|
|
|
|
|
|
|
|
|
|
|
|
|
|
|
|
|
| 26-Aug-06 |
190 |
|
|
|
|
|
|
|
|
|
|
|
|
|
|
|
|
|
|
|
| 27-Aug-06 |
190 |
|
|
|
|
|
|
|
|
|
|
|
|
|
|
|
|
|
|
|
| 28-Aug-06 |
216 |
|
|
|
|
|
|
|
|
|
|
|
|
|
|
|
|
|
|
|
| 29-Aug-06 |
216 |
|
|
|
|
|
|
|
|
|
|
|
|
|
|
|
|
|
|
|
| 30-Aug-06 |
221 |
|
|
|
|
|
|
|
|
|
|
|
|
|
|
|
|
|
|
|
| 31-Aug-06 |
213 |
|
|
|
|
|
|
|
|
|
|
|
|
|
|
|
|
|
|
|
| 1-Sep-06 |
241 |
|
|
|
|
|
|
|
|
|
|
|
|
|
|
|
|
|
|
|
| 2-Sep-06 |
232 |
|
|
|
|
|
|
|
|
|
|
|
|
|
|
|
|
|
|
|
| 3-Sep-06 |
242 |
|
|
|
|
|
|
|
|
|
|
|
|
|
|
|
|
|
|
|
| 4-Sep-06 |
221 |
|
|
|
|
|
|
|
|
|
|
|
|
|
|
|
|
|
|
|
| 5-Sep-06 |
207 |
|
|
|
|
|
|
|
|
|
|
|
|
|
|
|
|
|
|
|
| 6-Sep-06 |
209 |
|
|
|
|
|
|
|
|
|
|
|
|
|
|
|
|
|
|
|
| 7-Sep-06 |
209 |
|
|
|
|
|
|
|
|
|
|
|
|
|
|
|
|
|
|
|
| 8-Sep-06 |
210 |
|
|
|
|
|
|
|
|
|
|
|
|
|
|
|
|
|
|
|
| 9-Sep-06 |
199 |
|
|
|
|
|
|
|
|
|
|
|
|
|
|
|
|
|
|
|
| 10-Sep-06 |
193 |
|
|
|
|
|
|
|
|
|
|
|
|
|
|
|
|
|
|
|
| 11-Sep-06 |
190 |
|
|
|
|
|
|
|
|
|
|
|
|
|
|
|
|
|
|
|
| 12-Sep-06 |
181 |
|
|
|
|
|
|
|
|
|
|
|
|
|
|
|
|
|
|
|
| 13-Sep-06 |
200 |
|
|
|
|
|
|
|
|
|
|
|
|
|
|
|
|
|
|
|
| 14-Sep-06 |
200 |
|
|
|
|
|
|
|
|
|
|
|
|
|
|
|
|
|
|
|
| 15-Sep-06 |
214 |
|
|
|
|
|
|
|
|
|
|
|
|
|
|
|
|
|
|
|
| 16-Sep-06 |
214 |
|
|
|
|
|
|
|
|
|
|
|
|
|
|
|
|
|
|
|
| 17-Sep-06 |
204 |
|
|
|
|
|
|
|
|
|
|
|
|
|
|
|
|
|
|
|
| 18-Sep-06 |
199 |
|
|
|
|
|
|
|
|
|
|
|
|
|
|
|
|
|
|
|
| 19-Sep-06 |
192 |
|
|
|
|
|
|
|
|
|
|
|
|
|
|
|
|
|
|
|
| 20-Sep-06 |
189 |
|
|
|
|
|
|
|
|
|
|
|
|
|
|
|
|
|
|
|
| 21-Sep-06 |
187 |
|
|
|
|
|
|
|
|
|
|
|
|
|
|
|
|
|
|
|
| 22-Sep-06 |
198 |
|
|
|
|
|
|
|
|
|
|
|
|
|
|
|
|
|
|
|
| 23-Sep-06 |
198 |
|
|
|
|
|
|
|
|
|
|
|
|
|
|
|
|
|
|
|
| 24-Sep-06 |
222 |
|
|
|
|
|
|
|
|
|
|
|
|
|
|
|
|
|
|
|
| 25-Sep-06 |
207 |
|
|
|
|
|
|
|
|
|
|
|
|
|
|
|
|
|
|
|
| 26-Sep-06 |
206 |
|
|
|
|
|
|
|
|
|
|
|
|
|
|
|
|
|
|
|
| 27-Sep-06 |
197 |
|
|
|
|
|
|
|
|
|
|
|
|
|
|
|
|
|
|
|
| 28-Sep-06 |
184 |
|
|
|
|
|
|
|
|
|
|
|
|
|
|
|
|
|
|
|
| 29-Sep-06 |
197 |
|
|
|
|
|
|
|
|
|
|
|
|
|
|
|
|
|
|
|
| 30-Sep-06 |
191 |
|
|
|
|
|
|
|
|
|
|
|
|
|
|
|
|
|
|
|
| 1-Oct-06 |
237 |
|
|
|
|
|
|
|
|
|
|
|
|
|
|
|
|
|
|
|
| 2-Oct-06 |
246 |
|
|
|
|
|
|
|
|
|
|
|
|
|
|
|
|
|
|
|
| 3-Oct-06 |
230 |
|
|
|
|
|
|
|
|
|
|
|
|
|
|
|
|
|
|
|
| 4-Oct-06 |
237 |
|
|
|
|
|
|
|
|
|
|
|
|
|
|
|
|
|
|
|
| 5-Oct-06 |
238 |
|
|
|
|
|
|
|
|
|
|
|
|
|
|
|
|
|
|
|
| 6-Oct-06 |
258 |
|
|
|
|
|
|
|
|
|
|
|
|
|
|
|
|
|
|
|
| 7-Oct-06 |
271 |
|
|
|
|
|
|
|
|
|
|
|
|
|
|
|
|
|
|
|
| 8-Oct-06 |
283 |
|
|
|
|
|
|
|
|
|
|
|
|
|
|
|
|
|
|
|
| 9-Oct-06 |
283 |
|
|
|
|
|
|
|
|
|
|
|
|
|
|
|
|
|
|
|
| 10-Oct-06 |
249 |
|
|
|
|
|
|
|
|
|
|
|
|
|
|
|
|
|
|
|
| 11-Oct-06 |
249 |
|
|
|
|
|
|
|
|
|
|
|
|
|
|
|
|
|
|
|
| 12-Oct-06 |
260 |
|
|
|
|
|
|
|
|
|
|
|
|
|
|
|
|
|
|
|
| 13-Oct-06 |
254 |
|
|
|
|
|
|
|
|
|
|
|
|
|
|
|
|
|
|
|
| 14-Oct-06 |
265 |
|
|
|
|
|
|
|
|
|
|
|
|
|
|
|
|
|
|
|
| 15-Oct-06 |
270 |
|
|
|
|
|
|
|
|
|
|
|
|
|
|
|
|
|
|
|
| 16-Oct-06 |
252 |
|
|
|
|
|
|
|
|
|
|
|
|
|
|
|
|
|
|
|
| 17-Oct-06 |
282 |
|
|
|
|
|
|
|
|
|
|
|
|
|
|
|
|
|
|
|
| 18-Oct-06 |
292 |
|
|
|
|
|
|
|
|
|
|
|
|
|
|
|
|
|
|
|
| 19-Oct-06 |
237 |
|
|
|
|
|
|
|
|
|
|
|
|
|
|
|
|
|
|
|
| 20-Oct-06 |
252 |
|
|
|
|
|
|
|
|
|
|
|
|
|
|
|
|
|
|
|
| 21-Oct-06 |
246 |
|
|
|
|
|
|
|
|
|
|
|
|
|
|
|
|
|
|
|
| 22-Oct-06 |
215 |
|
|
|
|
|
|
|
|
|
|
|
|
|
|
|
|
|
|
|
| 23-Oct-06 |
239 |
|
|
|
|
|
|
|
|
|
|
|
|
|
|
|
|
|
|
|
| 24-Oct-06 |
218 |
|
|
|
|
|
|
|
|
|
|
|
|
|
|
|
|
|
|
|
| 25-Oct-06 |
218 |
|
|
|
|
|
|
|
|
|
|
|
|
|
|
|
|
|
|
|
| 26-Oct-06 |
278 |
|
|
|
|
|
|
|
|
|
|
|
|
|
|
|
|
|
|
|
| 27-Oct-06 |
263 |
|
|
|
|
|
|
|
|
|
|
|
|
|
|
|
|
|
|
|
| 28-Oct-06 |
273 |
|
|
|
|
|
|
|
|
|
|
|
|
|
|
|
|
|
|
|
| 29-Oct-06 |
261 |
|
|
|
|
|
|
|
|
|
|
|
|
|
|
|
|
|
|
|
| 30-Oct-06 |
248 |
|
|
|
|
|
|
|
|
|
|
|
|
|
|
|
|
|
|
|
| 31-Oct-06 |
228 |
|
|
|
|
|
|
|
|
|
|
|
|
|
|
|
|
|
|
|
| 1-Nov-06 |
200 |
|
|
|
|
|
|
|
|
|
|
|
|
|
|
|
|
|
|
|
| 2-Nov-06 |
174 |
|
|
|
|
|
|
|
|
|
|
|
|
|
|
|
|
|
|
|
| 3-Nov-06 |
142 |
|
|
|
|
|
|
|
|
|
|
|
|
|
|
|
|
|
|
|
| 4-Nov-06 |
212 |
|
|
|
|
|
|
|
|
|
|
|
|
|
|
|
|
|
|
|
| 5-Nov-06 |
188 |
|
|
|
|
|
|
|
|
|
|
|
|
|
|
|
|
|
|
|
| 6-Nov-06 |
188 |
|
|
|
|
|
|
|
|
|
|
|
|
|
|
|
|
|
|
|
| 7-Nov-06 |
189 |
|
|
|
|
|
|
|
|
|
|
|
|
|
|
|
|
|
|
|
| 8-Nov-06 |
163 |
|
|
|
|
|
|
|
|
|
|
|
|
|
|
|
|
|
|
|
| 9-Nov-06 |
198 |
|
|
|
|
|
|
|
|
|
|
|
|
|
|
|
|
|
|
|
| 10-Nov-06 |
198 |
|
|
|
|
|
|
|
|
|
|
|
|
|
|
|
|
|
|
|
| 11-Nov-06 |
214 |
|
|
|
|
|
|
|
|
|
|
|
|
|
|
|
|
|
|
|
| 12-Nov-06 |
222 |
|
|
|
|
|
|
|
|
|
|
|
|
|
|
|
|
|
|
|
| 13-Nov-06 |
239 |
|
|
|
|
|
|
|
|
|
|
|
|
|
|
|
|
|
|
|
| 14-Nov-06 |
230 |
|
|
|
|
|
|
|
|
|
|
|
|
|
|
|
|
|
|
|
| 15-Nov-06 |
238 |
|
|
|
|
|
|
|
|
|
|
|
|
|
|
|
|
|
|
|
| 16-Nov-06 |
237 |
|
|
|
|
|
|
|
|
|
|
|
|
|
|
|
|
|
|
|
| 17-Nov-06 |
204 |
|
|
|
|
|
|
|
|
|
|
|
|
|
|
|
|
|
|
|
| 18-Nov-06 |
|
|
|
|
|
|
|
|
|
|
|
|
|
|
|
|
|
|
|
|
| 19-Nov-06 |
288 |
|
|
|
|
|
|
|
|
|
|
|
|
|
|
|
|
|
|
|
| 20-Nov-06 |
287 |
|
|
|
|
|
|
|
|
|
|
|
|
|
|
|
|
|
|
|
| 21-Nov-06 |
261 |
|
|
|
|
|
|
|
|
|
|
|
|
|
|
|
|
|
|
|
| 22-Nov-06 |
261 |
|
|
|
|
|
|
|
|
|
|
|
|
|
|
|
|
|
|
|
| 23-Nov-06 |
216 |
|
|
|
|
|
|
|
|
|
|
|
|
|
|
|
|
|
|
|
| 24-Nov-06 |
181 |
|
|
|
|
|
|
|
|
|
|
|
|
|
|
|
|
|
|
|
| 25-Nov-06 |
174 |
|
|
|
|
|
|
|
|
|
|
|
|
|
|
|
|
|
|
|
| 26-Nov-06 |
174 |
|
|
|
|
|
|
|
|
|
|
|
|
|
|
|
|
|
|
|
| 27-Nov-06 |
193 |
|
|
|
|
|
|
|
|
|
|
|
|
|
|
|
|
|
|
|
| 28-Nov-06 |
222 |
|
|
|
|
|
|
|
|
|
|
|
|
|
|
|
|
|
|
|
| 29-Nov-06 |
253 |
|
|
|
|
|
|
|
|
|
|
|
|
|
|
|
|
|
|
|
| 30-Nov-06 |
256 |
|
|
|
|
|
|
|
|
|
|
|
|
|
|
|
|
|
|
|
| 1-Dec-06 |
256 |
|
|
|
|
|
|
|
|
|
|
|
|
|
|
|
|
|
|
|
| 2-Dec-06 |
258 |
|
|
|
|
|
|
|
|
|
|
|
|
|
|
|
|
|
|
|
| 3-Dec-06 |
261 |
|
|
|
|
|
|
|
|
|
|
|
|
|
|
|
|
|
|
|
| 4-Dec-06 |
|
|
|
|
|
|
|
|
|
|
|
|
|
|
|
|
|
|
|
|
| 5-Dec-06 |
265 |
|
|
|
|
|
|
|
|
|
|
|
|
|
|
|
|
|
|
|
| 6-Dec-06 |
303 |
|
|
|
|
|
|
|
|
|
|
|
|
|
|
|
|
|
|
|
| 7-Dec-06 |
277 |
|
|
|
|
|
|
|
|
|
|
|
|
|
|
|
|
|
|
|
| 8-Dec-06 |
277 |
|
|
|
|
|
|
|
|
|
|
|
|
|
|
|
|
|
|
|
| 9-Dec-06 |
176 |
|
|
|
|
|
|
|
|
|
|
|
|
|
|
|
|
|
|
|
| 10-Dec-06 |
122 |
|
|
|
|
|
|
|
|
|
|
|
|
|
|
|
|
|
|
|
| 11-Dec-06 |
122 |
|
|
|
|
|
|
|
|
|
|
|
|
|
|
|
|
|
|
|
| 12-Dec-06 |
122 |
|
|
|
|
|
|
|
|
|
|
|
|
|
|
|
|
|
|
|
| 13-Dec-06 |
232 |
|
|
|
|
|
|
|
|
|
|
|
|
|
|
|
|
|
|
|
| 14-Dec-06 |
212 |
|
|
|
|
|
|
|
|
|
|
|
|
|
|
|
|
|
|
|
| 15-Dec-06 |
234 |
|
|
|
|
|
|
|
|
|
|
|
|
|
|
|
|
|
|
|
| 16-Dec-06 |
239 |
|
|
|
|
|
|
|
|
|
|
|
|
|
|
|
|
|
|
|
| 17-Dec-06 |
236 |
|
|
|
|
|
|
|
|
|
|
|
|
|
|
|
|
|
|
|
| 18-Dec-06 |
260 |
|
|
|
|
|
|
|
|
|
|
|
|
|
|
|
|
|
|
|
| 19-Dec-06 |
251 |
|
|
|
|
|
|
|
|
|
|
|
|
|
|
|
|
|
|
|
| 20-Dec-06 |
245 |
|
|
|
|
|
|
|
|
|
|
|
|
|
|
|
|
|
|
|
| 21-Dec-06 |
229 |
|
|
|
|
|
|
|
|
|
|
|
|
|
|
|
|
|
|
|
| 22-Dec-06 |
229 |
|
|
|
|
|
|
|
|
|
|
|
|
|
|
|
|
|
|
|
| 23-Dec-06 |
220 |
|
|
|
|
|
|
|
|
|
|
|
|
|
|
|
|
|
|
|
| 24-Dec-06 |
212 |
|
|
|
|
|
|
|
|
|
|
|
|
|
|
|
|
|
|
|
| 25-Dec-06 |
228 |
|
|
|
|
|
|
|
|
|
|
|
|
|
|
|
|
|
|
|
| 26-Dec-06 |
229 |
|
|
|
|
|
|
|
|
|
|
|
|
|
|
|
|
|
|
|
| 27-Dec-06 |
242 |
|
|
|
|
|
|
|
|
|
|
|
|
|
|
|
|
|
|
|
| 28-Dec-06 |
242 |
|
|
|
|
|
|
|
|
|
|
|
|
|
|
|
|
|
|
|
| 29-Dec-06 |
210 |
|
|
|
|
|
|
|
|
|
|
|
|
|
|
|
|
|
|
|
| 30-Dec-06 |
227 |
|
|
|
|
|
|
|
|
|
|
|
|
|
|
|
|
|
|
|
| 31-Dec-06 |
243 |
|
|
|
|
|
|
|
|
|
|
|
|
|
|
|
|
|
|
|
| 1-Jan-07 |
256 |
|
|
|
|
|
|
|
|
|
|
|
|
|
|
|
|
|
|
|
| 2-Jan-07 |
256 |
|
|
|
|
|
|
|
|
|
|
|
|
|
|
|
|
|
|
|
| 3-Jan-07 |
243 |
|
|
|
|
|
|
|
|
|
|
|
|
|
|
|
|
|
|
|
| 4-Jan-07 |
221 |
|
|
|
|
|
|
|
|
|
|
|
|
|
|
|
|
|
|
|
| 5-Jan-07 |
208 |
|
|
|
|
|
|
|
|
|
|
|
|
|
|
|
|
|
|
|
| 6-Jan-07 |
226 |
|
|
|
|
|
|
|
|
|
|
|
|
|
|
|
|
|
|
|
| 7-Jan-07 |
238 |
|
|
|
|
|
|
|
|
|
|
|
|
|
|
|
|
|
|
|
| 8-Jan-07 |
231 |
|
|
|
|
|
|
|
|
|
|
|
|
|
|
|
|
|
|
|
| 9-Jan-07 |
241 |
|
|
|
|
|
|
|
|
|
|
|
|
|
|
|
|
|
|
|
| 10-Jan-07 |
236 |
|
|
|
|
|
|
|
|
|
|
|
|
|
|
|
|
|
|
|
| 11-Jan-07 |
228 |
|
|
|
|
|
|
|
|
|
|
|
|
|
|
|
|
|
|
|
| 12-Jan-07 |
241 |
|
|
|
|
|
|
|
|
|
|
|
|
|
|
|
|
|
|
|
| 13-Jan-07 |
241 |
|
|
|
|
|
|
|
|
|
|
|
|
|
|
|
|
|
|
|
| 14-Jan-07 |
241 |
|
|
|
|
|
|
|
|
|
|
|
|
|
|
|
|
|
|
|
| 15-Jan-07 |
226 |
|
|
|
|
|
|
|
|
|
|
|
|
|
|
|
|
|
|
|
| 16-Jan-07 |
216 |
|
|
|
|
|
|
|
|
|
|
|
|
|
|
|
|
|
|
|
| 17-Jan-07 |
220 |
|
|
|
|
|
|
|
|
|
|
|
|
|
|
|
|
|
|
|
| 18-Jan-07 |
211 |
|
|
|
|
|
|
|
|
|
|
|
|
|
|
|
|
|
|
|
| 19-Jan-07 |
225 |
|
|
|
|
|
|
|
|
|
|
|
|
|
|
|
|
|
|
|
| 20-Jan-07 |
234 |
|
|
|
|
|
|
|
|
|
|
|
|
|
|
|
|
|
|
|
| 21-Jan-07 |
231 |
|
|
|
|
|
|
|
|
|
|
|
|
|
|
|
|
|
|
|
| 22-Jan-07 |
216 |
|
|
|
|
|
|
|
|
|
|
|
|
|
|
|
|
|
|
|
| 23-Jan-07 |
204 |
|
|
|
|
|
|
|
|
|
|
|
|
|
|
|
|
|
|
|
| 24-Jan-07 |
204 |
|
|
|
|
|
|
|
|
|
|
|
|
|
|
|
|
|
|
|
| 25-Jan-07 |
189 |
|
|
|
|
|
|
|
|
|
|
|
|
|
|
|
|
|
|
|
| 26-Jan-07 |
207 |
|
|
|
|
|
|
|
|
|
|
|
|
|
|
|
|
|
|
|
| 27-Jan-07 |
|
|
|
|
|
|
|
|
|
|
|
|
|
|
|
|
|
|
|
|
| 28-Jan-07 |
234 |
|
|
|
|
|
|
|
|
|
|
|
|
|
|
|
|
|
|
|
| 29-Jan-07 |
234 |
|
|
|
|
|
|
|
|
|
|
|
|
|
|
|
|
|
|
|
| 30-Jan-07 |
238 |
|
|
|
|
|
|
|
|
|
|
|
|
|
|
|
|
|
|
|
| 31-Jan-07 |
261 |
|
|
|
|
|
|
|
|
|
|
|
|
|
|
|
|
|
|
|
| 1-Feb-07 |
265 |
|
|
|
|
|
|
|
|
|
|
|
|
|
|
|
|
|
|
|
| 2-Feb-07 |
305 |
|
|
|
|
|
|
|
|
|
|
|
|
|
|
|
|
|
|
|
| 3-Feb-07 |
327 |
|
|
|
|
|
|
|
|
|
|
|
|
|
|
|
|
|
|
|
| 4-Feb-07 |
410 |
|
|
|
|
|
|
|
|
|
|
|
|
|
|
|
|
|
|
|
| 5-Feb-07 |
495 |
|
|
|
|
|
|
|
|
|
|
|
|
|
|
|
|
|
|
|
| 6-Feb-07 |
531 |
|
|
|
|
|
|
|
|
|
|
|
|
|
|
|
|
|
|
|
| 7-Feb-07 |
533 |
|
|
|
|
|
|
|
|
|
|
|
|
|
|
|
|
|
|
|
| 8-Feb-07 |
536 |
|
|
|
|
|
|
|
|
|
|
|
|
|
|
|
|
|
|
|
| 9-Feb-07 |
485 |
|
|
|
|
|
|
|
|
|
|
|
|
|
|
|
|
|
|
|
| 10-Feb-07 |
485 |
|
|
|
|
|
|
|
|
|
|
|
|
|
|
|
|
|
|
|
| 11-Feb-07 |
503 |
|
|
|
|
|
|
|
|
|
|
|
|
|
|
|
|
|
|
|
| 12-Feb-07 |
479 |
|
|
|
|
|
|
|
|
|
|
|
|
|
|
|
|
|
|
|
| 13-Feb-07 |
769 |
|
|
|
|
|
|
|
|
|
|
|
|
|
|
|
|
|
|
|
| 14-Feb-07 |
769 |
|
|
|
|
|
|
|
|
|
|
|
|
|
|
|
|
|
|
|
| 15-Feb-07 |
1090 |
|
|
|
|
|
|
|
|
|
|
|
|
|
|
|
|
|
|
|
| 16-Feb-07 |
1119 |
|
|
|
|
|
|
|
|
|
|
|
|
|
|
|
|
|
|
|
| 17-Feb-07 |
1392 |
|
|
|
|
|
|
|
|
|
|
|
|
|
|
|
|
|
|
|
| 18-Feb-07 |
1522 |
|
|
|
|
|
|
|
|
|
|
|
|
|
|
|
|
|
|
|
| 19-Feb-07 |
1574 |
|
|
|
|
|
|
|
|
|
|
|
|
|
|
|
|
|
|
|
| 20-Feb-07 |
1621 |
|
|
|
|
|
|
|
|
|
|
|
|
|
|
|
|
|
|
|
| 21-Feb-07 |
1600 |
|
|
|
|
|
|
|
|
|
|
|
|
|
|
|
|
|
|
|
| 22-Feb-07 |
1459 |
|
|
|
|
|
|
|
|
|
|
|
|
|
|
|
|
|
|
|
| 23-Feb-07 |
1447 |
|
|
|
|
|
|
|
|
|
|
|
|
|
|
|
|
|
|
|
| 24-Feb-07 |
1599 |
|
|
|
|
|
|
|
|
|
|
|
|
|
|
|
|
|
|
|
| 25-Feb-07 |
1728 |
|
|
|
|
|
|
|
|
|
|
|
|
|
|
|
|
|
|
|
| 26-Feb-07 |
1787 |
|
|
|
|
|
|
|
|
|
|
|
|
|
|
|
|
|
|
|
| 27-Feb-07 |
1437 |
|
|
|
|
|
|
|
|
|
|
|
|
|
|
|
|
|
|
|
| 28-Feb-07 |
1364 |
|
|
|
|
|
|
|
|
|
|
|
|
|
|
|
|
|
|
|
| 1-Mar-07 |
1086 |
|
|
|
|
|
|
|
|
|
|
|
|
|
|
|
|
|
|
|
| 2-Mar-07 |
1086 |
|
|
|
|
|
|
|
|
|
|
|
|
|
|
|
|
|
|
|
| 3-Mar-07 |
1611 |
|
|
|
|
|
|
|
|
|
|
|
|
|
|
|
|
|
|
|
| 4-Mar-07 |
1595 |
|
|
|
|
|
|
|
|
|
|
|
|
|
|
|
|
|
|
|
| 5-Mar-07 |
1686 |
|
|
|
|
|
|
|
|
|
|
|
|
|
|
|
|
|
|
|
| 6-Mar-07 |
1703 |
|
|
|
|
|
|
|
|
|
|
|
|
|
|
|
|
|
|
|
| 7-Mar-07 |
1684 |
|
|
|
|
|
|
|
|
|
|
|
|
|
|
|
|
|
|
|
| 8-Mar-07 |
1671 |
|
|
|
|
|
|
|
|
|
|
|
|
|
|
|
|
|
|
|
| 9-Mar-07 |
1639 |
|
|
|
|
|
|
|
|
|
|
|
|
|
|
|
|
|
|
|
| 10-Mar-07 |
1614 |
|
|
|
|
|
|
|
|
|
|
|
|
|
|
|
|
|
|
|
| 11-Mar-07 |
1624 |
|
|
|
|
|
|
|
|
|
|
|
|
|
|
|
|
|
|
|
| 12-Mar-07 |
1821 |
|
|
|
|
|
|
|
|
|
|
|
|
|
|
|
|
|
|
|
| 13-Mar-07 |
1844 |
|
|
|
|
|
|
|
|
|
|
|
|
|
|
|
|
|
|
|
| 14-Mar-07 |
1909 |
|
|
|
|
|
|
|
|
|
|
|
|
|
|
|
|
|
|
|
| 15-Mar-07 |
1908 |
|
|
|
|
|
|
|
|
|
|
|
|
|
|
|
|
|
|
|
| 16-Mar-07 |
1894 |
|
|
|
|
|
|
|
|
|
|
|
|
|
|
|
|
|
|
|
| 17-Mar-07 |
1823 |
|
|
|
|
|
|
|
|
|
|
|
|
|
|
|
|
|
|
|
| 18-Mar-07 |
1823 |
|
|
|
|
|
|
|
|
|
|
|
|
|
|
|
|
|
|
|
| 19-Mar-07 |
1801 |
|
|
|
|
|
|
|
|
|
|
|
|
|
|
|
|
|
|
|
| 20-Mar-07 |
1740 |
|
|
|
|
|
|
|
|
|
|
|
|
|
|
|
|
|
|
|
| 21-Mar-07 |
1704 |
|
|
|
|
|
|
|
|
|
|
|
|
|
|
|
|
|
|
|
| 22-Mar-07 |
1723 |
|
|
|
|
|
|
|
|
|
|
|
|
|
|
|
|
|
|
|
| 23-Mar-07 |
1683 |
|
|
|
|
|
|
|
|
|
|
|
|
|
|
|
|
|
|
|
| 24-Mar-07 |
1613 |
|
|
|
|
|
|
|
|
|
|
|
|
|
|
|
|
|
|
|
| 25-Mar-07 |
1595 |
|
|
|
|
|
|
|
|
|
|
|
|
|
|
|
|
|
|
|
| 26-Mar-07 |
927 |
|
|
|
|
|
|
|
|
|
|
|
|
|
|
|
|
|
|
|
| 27-Mar-07 |
988 |
|
|
|
|
|
|
|
|
|
|
|
|
|
|
|
|
|
|
|
| 28-Mar-07 |
993 |
|
|
|
|
|
|
|
|
|
|
|
|
|
|
|
|
|
|
|
| 29-Mar-07 |
1133 |
|
|
|
|
|
|
|
|
|
|
|
|
|
|
|
|
|
|
|
| 30-Mar-07 |
1413 |
|
|
|
|
|
|
|
|
|
|
|
|
|
|
|
|
|
|
|
| 31-Mar-07 |
1475 |
|
|
|
|
|
|
|
|
|
|
|
|
|
|
|
|
|
|
|
| 1-Apr-07 |
1524 |
|
|
|
|
|
|
|
|
|
|
|
|
|
|
|
|
|
|
|
| 2-Apr-07 |
1414 |
|
|
|
|
|
|
|
|
|
|
|
|
|
|
|
|
|
|
|
| 3-Apr-07 |
1414 |
|
|
|
|
|
|
|
|
|
|
|
|
|
|
|
|
|
|
|
| 4-Apr-07 |
1310 |
|
|
|
|
|
|
|
|
|
|
|
|
|
|
|
|
|
|
|
| 5-Apr-07 |
1344 |
|
|
|
|
|
|
|
|
|
|
|
|
|
|
|
|
|
|
|
| 6-Apr-07 |
1360 |
|
|
|
|
|
|
|
|
|
|
|
|
|
|
|
|
|
|
|
| 7-Apr-07 |
1387 |
|
|
|
|
|
|
|
|
|
|
|
|
|
|
|
|
|
|
|
| 8-Apr-07 |
1406 |
|
|
|
|
|
|
|
|
|
|
|
|
|
|
|
|
|
|
|
| 9-Apr-07 |
1353 |
|
|
|
|
|
|
|
|
|
|
|
|
|
|
|
|
|
|
|
| 10-Apr-07 |
1359 |
|
|
|
|
|
|
|
|
|
|
|
|
|
|
|
|
|
|
|
| 11-Apr-07 |
1287 |
|
|
|
|
|
|
|
|
|
|
|
|
|
|
|
|
|
|
|
| 12-Apr-07 |
1229 |
|
|
|
|
|
|
|
|
|
|
|
|
|
|
|
|
|
|
|
| 13-Apr-07 |
1348 |
|
|
|
|
|
|
|
|
|
|
|
|
|
|
|
|
|
|
|
| 14-Apr-07 |
1367 |
|
|
|
|
|
|
|
|
|
|
|
|
|
|
|
|
|
|
|
| 15-Apr-07 |
1381 |
|
|
|
|
|
|
|
|
|
|
|
|
|
|
|
|
|
|
|
| 16-Apr-07 |
1432 |
|
|
|
|
|
|
|
|
|
|
|
|
|
|
|
|
|
|
|
| 17-Apr-07 |
1339 |
|
|
|
|
|
|
|
|
|
|
|
|
|
|
|
|
|
|
|
| 18-Apr-07 |
1361 |
|
|
|
|
|
|
|
|
|
|
|
|
|
|
|
|
|
|
|
| 19-Apr-07 |
1361 |
|
|
|
|
|
|
|
|
|
|
|
|
|
|
|
|
|
|
|
| 20-Apr-07 |
1458 |
|
|
|
|
|
|
|
|
|
|
|
|
|
|
|
|
|
|
|
| 21-Apr-07 |
1430 |
|
|
|
|
|
|
|
|
|
|
|
|
|
|
|
|
|
|
|
| 22-Apr-07 |
1410 |
|
|
|
|
|
|
|
|
|
|
|
|
|
|
|
|
|
|
|
| 23-Apr-07 |
1407 |
|
|
|
|
|
|
|
|
|
|
|
|
|
|
|
|
|
|
|
| 24-Apr-07 |
1394 |
|
|
|
|
|
|
|
|
|
|
|
|
|
|
|
|
|
|
|
| 25-Apr-07 |
1352 |
|
|
|
|
|
|
|
|
|
|
|
|
|
|
|
|
|
|
|
| 26-Apr-07 |
1323 |
|
|
|
|
|
|
|
|
|
|
|
|
|
|
|
|
|
|
|
| 27-Apr-07 |
1277 |
|
|
|
|
|
|
|
|
|
|
|
|
|
|
|
|
|
|
|
| 28-Apr-07 |
1209 |
|
|
|
|
|
|
|
|
|
|
|
|
|
|
|
|
|
|
|
| 29-Apr-07 |
1183 |
|
|
|
|
|
|
|
|
|
|
|
|
|
|
|
|
|
|
|
| 30-Apr-07 |
1150 |
|
|
|
|
|
|
|
|
|
|
|
|
|
|
|
|
|
|
|
| 1-May-07 |
1101 |
|
|
|
|
|
|
|
|
|
|
|
|
|
|
|
|
|
|
|
| 2-May-07 |
1099 |
|
|
|
|
|
|
|
|
|
|
|
|
|
|
|
|
|
|
|
| 3-May-07 |
1063 |
|
|
|
|
|
|
|
|
|
|
|
|
|
|
|
|
|
|
|
| 4-May-07 |
1056 |
|
|
|
|
|
|
|
|
|
|
|
|
|
|
|
|
|
|
|
| 5-May-07 |
1056 |
|
|
|
|
|
|
|
|
|
|
|
|
|
|
|
|
|
|
|
| 6-May-07 |
1007 |
|
|
|
|
|
|
|
|
|
|
|
|
|
|
|
|
|
|
|
| 7-May-07 |
987 |
|
|
|
|
|
|
|
|
|
|
|
|
|
|
|
|
|
|
|
| 8-May-07 |
999 |
|
|
|
|
|
|
|
|
|
|
|
|
|
|
|
|
|
|
|
| 9-May-07 |
1008 |
|
|
|
|
|
|
|
|
|
|
|
|
|
|
|
|
|
|
|
| 10-May-07 |
1020 |
|
|
|
|
|
|
|
|
|
|
|
|
|
|
|
|
|
|
|
| 11-May-07 |
990 |
|
|
|
|
|
|
|
|
|
|
|
|
|
|
|
|
|
|
|
| 12-May-07 |
945 |
|
|
|
|
|
|
|
|
|
|
|
|
|
|
|
|
|
|
|
| 13-May-07 |
929 |
|
|
|
|
|
|
|
|
|
|
|
|
|
|
|
|
|
|
|
| 14-May-07 |
878 |
|
|
|
|
|
|
|
|
|
|
|
|
|
|
|
|
|
|
|
| 15-May-07 |
896 |
|
|
|
|
|
|
|
|
|
|
|
|
|
|
|
|
|
|
|
| 16-May-07 |
876 |
|
|
|
|
|
|
|
|
|
|
|
|
|
|
|
|
|
|
|
| 17-May-07 |
834 |
|
|
|
|
|
|
|
|
|
|
|
|
|
|
|
|
|
|
|
| 18-May-07 |
811 |
|
|
|
|
|
|
|
|
|
|
|
|
|
|
|
|
|
|
|
| 19-May-07 |
761 |
|
|
|
|
|
|
|
|
|
|
|
|
|
|
|
|
|
|
|
| 20-May-07 |
756 |
|
|
|
|
|
|
|
|
|
|
|
|
|
|
|
|
|
|
|
| 21-May-07 |
756 |
|
|
|
|
|
|
|
|
|
|
|
|
|
|
|
|
|
|
|
| 22-May-07 |
748 |
|
|
|
|
|
|
|
|
|
|
|
|
|
|
|
|
|
|
|
| 23-May-07 |
730 |
|
|
|
|
|
|
|
|
|
|
|
|
|
|
|
|
|
|
|
| 24-May-07 |
733 |
|
|
|
|
|
|
|
|
|
|
|
|
|
|
|
|
|
|
|
| 25-May-07 |
714 |
|
|
|
|
|
|
|
|
|
|
|
|
|
|
|
|
|
|
|
| 26-May-07 |
720 |
|
|
|
|
|
|
|
|
|
|
|
|
|
|
|
|
|
|
|
| 27-May-07 |
681 |
|
|
|
|
|
|
|
|
|
|
|
|
|
|
|
|
|
|
|
| 28-May-07 |
617 |
|
|
|
|
|
|
|
|
|
|
|
|
|
|
|
|
|
|
|
| 29-May-07 |
616 |
|
|
|
|
|
|
|
|
|
|
|
|
|
|
|
|
|
|
|
| 30-May-07 |
620 |
|
|
|
|
|
|
|
|
|
|
|
|
|
|
|
|
|
|
|
| 31-May-07 |
636 |
|
|
|
|
|
|
|
|
|
|
|
|
|
|
|
|
|
|
|
| 1-Jun-07 |
631 |
|
|
|
|
|
|
|
|
|
|
|
|
|
|
|
|
|
|
|
| 2-Jun-07 |
622 |
|
|
|
|
|
|
|
|
|
|
|
|
|
|
|
|
|
|
|
| 3-Jun-07 |
581 |
|
|
|
|
|
|
|
|
|
|
|
|
|
|
|
|
|
|
|
| 4-Jun-07 |
560 |
|
|
|
|
|
|
|
|
|
|
|
|
|
|
|
|
|
|
|
| 5-Jun-07 |
557 |
|
|
|
|
|
|
|
|
|
|
|
|
|
|
|
|
|
|
|
| 6-Jun-07 |
557 |
|
|
|
|
|
|
|
|
|
|
|
|
|
|
|
|
|
|
|
| 7-Jun-07 |
554 |
|
|
|
|
|
|
|
|
|
|
|
|
|
|
|
|
|
|
|
| 8-Jun-07 |
550 |
|
|
|
|
|
|
|
|
|
|
|
|
|
|
|
|
|
|
|
| 9-Jun-07 |
545 |
|
|
|
|
|
|
|
|
|
|
|
|
|
|
|
|
|
|
|
| 10-Jun-07 |
528 |
|
|
|
|
|
|
|
|
|
|
|
|
|
|
|
|
|
|
|
| 11-Jun-07 |
535 |
|
|
|
|
|
|
|
|
|
|
|
|
|
|
|
|
|
|
|
| 12-Jun-07 |
492 |
|
|
|
|
|
|
|
|
|
|
|
|
|
|
|
|
|
|
|
| 13-Jun-07 |
443 |
|
|
|
|
|
|
|
|
|
|
|
|
|
|
|
|
|
|
|
| 14-Jun-07 |
390 |
|
|
|
|
|
|
|
|
|
|
|
|
|
|
|
|
|
|
|
| 15-Jun-07 |
407 |
|
|
|
|
|
|
|
|
|
|
|
|
|
|
|
|
|
|
|
| 16-Jun-07 |
406 |
|
|
|
|
|
|
|
|
|
|
|
|
|
|
|
|
|
|
|
| 17-Jun-07 |
416 |
|
|
|
|
|
|
|
|
|
|
|
|
|
|
|
|
|
|
|
| 18-Jun-07 |
437 |
|
|
|
|
|
|
|
|
|
|
|
|
|
|
|
|
|
|
|
| 19-Jun-07 |
388 |
|
|
|
|
|
|
|
|
|
|
|
|
|
|
|
|
|
|
|
| 20-Jun-07 |
388 |
|
|
|
|
|
|
|
|
|
|
|
|
|
|
|
|
|
|
|
| 21-Jun-07 |
362 |
|
|
|
|
|
|
|
|
|
|
|
|
|
|
|
|
|
|
|
| 22-Jun-07 |
362 |
|
|
|
|
|
|
|
|
|
|
|
|
|
|
|
|
|
|
|
| 23-Jun-07 |
354 |
|
|
|
|
|
|
|
|
|
|
|
|
|
|
|
|
|
|
|
| 24-Jun-07 |
371 |
|
|
|
|
|
|
|
|
|
|
|
|
|
|
|
|
|
|
|
| 25-Jun-07 |
394 |
|
|
|
|
|
|
|
|
|
|
|
|
|
|
|
|
|
|
|
| 26-Jun-07 |
382 |
|
|
|
|
|
|
|
|
|
|
|
|
|
|
|
|
|
|
|
| 27-Jun-07 |
401 |
|
|
|
|
|
|
|
|
|
|
|
|
|
|
|
|
|
|
|
| 28-Jun-07 |
389 |
|
|
|
|
|
|
|
|
|
|
|
|
|
|
|
|
|
|
|
| 29-Jun-07 |
358 |
|
|
|
|
|
|
|
|
|
|
|
|
|
|
|
|
|
|
|
| 30-Jun-07 |
363 |
|
|
|
|
|
|
|
|
|
|
|
|
|
|
|
|
|
|
|
| 1-Jul-07 |
334 |
|
|
|
|
|
|
|
|
|
|
|
|
|
|
|
|
|
|
|
| 2-Jul-07 |
343 |
|
|
|
|
|
|
|
|
|
|
|
|
|
|
|
|
|
|
|
| 3-Jul-07 |
328 |
|
|
|
|
|
|
|
|
|
|
|
|
|
|
|
|
|
|
|
| 4-Jul-07 |
319 |
|
|
|
|
|
|
|
|
|
|
|
|
|
|
|
|
|
|
|
| 5-Jul-07 |
337 |
|
|
|
|
|
|
|
|
|
|
|
|
|
|
|
|
|
|
|
| 6-Jul-07 |
306 |
|
|
|
|
|
|
|
|
|
|
|
|
|
|
|
|
|
|
|
| 7-Jul-07 |
321 |
|
|
|
|
|
|
|
|
|
|
|
|
|
|
|
|
|
|
|
| 8-Jul-07 |
321 |
|
|
|
|
|
|
|
|
|
|
|
|
|
|
|
|
|
|
|
| 9-Jul-07 |
323 |
|
|
|
|
|
|
|
|
|
|
|
|
|
|
|
|
|
|
|
| 10-Jul-07 |
312 |
|
|
|
|
|
|
|
|
|
|
|
|
|
|
|
|
|
|
|
| 11-Jul-07 |
331 |
|
|
|
|
|
|
|
|
|
|
|
|
|
|
|
|
|
|
|
| 12-Jul-07 |
322 |
|
|
|
|
|
|
|
|
|
|
|
|
|
|
|
|
|
|
|
| 13-Jul-07 |
319 |
|
|
|
|
|
|
|
|
|
|
|
|
|
|
|
|
|
|
|
| 14-Jul-07 |
321 |
|
|
|
|
|
|
|
|
|
|
|
|
|
|
|
|
|
|
|
| 15-Jul-07 |
296 |
|
|
|
|
|
|
|
|
|
|
|
|
|
|
|
|
|
|
|
| 16-Jul-07 |
299 |
|
|
|
|
|
|
|
|
|
|
|
|
|
|
|
|
|
|
|
| 17-Jul-07 |
310 |
|
|
|
|
|
|
|
|
|
|
|
|
|
|
|
|
|
|
|
| 18-Jul-07 |
305 |
|
|
|
|
|
|
|
|
|
|
|
|
|
|
|
|
|
|
|
| 19-Jul-07 |
294 |
|
|
|
|
|
|
|
|
|
|
|
|
|
|
|
|
|
|
|
| 20-Jul-07 |
291 |
|
|
|
|
|
|
|
|
|
|
|
|
|
|
|
|
|
|
|
| 21-Jul-07 |
272 |
|
|
|
|
|
|
|
|
|
|
|
|
|
|
|
|
|
|
|
| 22-Jul-07 |
270 |
|
|
|
|
|
|
|
|
|
|
|
|
|
|
|
|
|
|
|
| 23-Jul-07 |
283 |
|
|
|
|
|
|
|
|
|
|
|
|
|
|
|
|
|
|
|
| 24-Jul-07 |
283 |
|
|
|
|
|
|
|
|
|
|
|
|
|
|
|
|
|
|
|
| 25-Jul-07 |
304 |
|
|
|
|
|
|
|
|
|
|
|
|
|
|
|
|
|
|
|
| 26-Jul-07 |
309 |
|
|
|
|
|
|
|
|
|
|
|
|
|
|
|
|
|
|
|
| 27-Jul-07 |
322 |
|
|
|
|
|
|
|
|
|
|
|
|
|
|
|
|
|
|
|
| 28-Jul-07 |
317 |
|
|
|
|
|
|
|
|
|
|
|
|
|
|
|
|
|
|
|
| 29-Jul-07 |
316 |
|
|
|
|
|
|
|
|
|
|
|
|
|
|
|
|
|
|
|
| 30-Jul-07 |
304 |
|
|
|
|
|
|
|
|
|
|
|
|
|
|
|
|
|
|
|
| 31-Jul-07 |
293 |
|
|
|
|
|
|
|
|
|
|
|
|
|
|
|
|
|
|
|
| 1-Aug-07 |
262 |
|
|
|
|
|
|
|
|
|
|
|
|
|
|
|
|
|
|
|
| 2-Aug-07 |
267 |
|
|
|
|
|
|
|
|
|
|
|
|
|
|
|
|
|
|
|
| 3-Aug-07 |
280 |
|
|
|
|
|
|
|
|
|
|
|
|
|
|
|
|
|
|
|
| 4-Aug-07 |
265 |
|
|
|
|
|
|
|
|
|
|
|
|
|
|
|
|
|
|
|
| 5-Aug-07 |
274 |
|
|
|
|
|
|
|
|
|
|
|
|
|
|
|
|
|
|
|
| 6-Aug-07 |
272 |
|
|
|
|
|
|
|
|
|
|
|
|
|
|
|
|
|
|
|
| 7-Aug-07 |
244 |
|
|
|
|
|
|
|
|
|
|
|
|
|
|
|
|
|
|
|
| 8-Aug-07 |
248 |
|
|
|
|
|
|
|
|
|
|
|
|
|
|
|
|
|
|
|
| 9-Aug-07 |
248 |
|
|
|
|
|
|
|
|
|
|
|
|
|
|
|
|
|
|
|
| 10-Aug-07 |
251 |
|
|
|
|
|
|
|
|
|
|
|
|
|
|
|
|
|
|
|
| 11-Aug-07 |
259 |
|
|
|
|
|
|
|
|
|
|
|
|
|
|
|
|
|
|
|
| 12-Aug-07 |
261 |
|
|
|
|
|
|
|
|
|
|
|
|
|
|
|
|
|
|
|
| 13-Aug-07 |
254 |
|
|
|
|
|
|
|
|
|
|
|
|
|
|
|
|
|
|
|
| 14-Aug-07 |
246 |
|
|
|
|
|
|
|
|
|
|
|
|
|
|
|
|
|
|
|
| 15-Aug-07 |
244 |
|
|
|
|
|
|
|
|
|
|
|
|
|
|
|
|
|
|
|
| 16-Aug-07 |
249 |
|
|
|
|
|
|
|
|
|
|
|
|
|
|
|
|
|
|
|
| 17-Aug-07 |
264 |
|
|
|
|
|
|
|
|
|
|
|
|
|
|
|
|
|
|
|
| 18-Aug-07 |
249 |
|
|
|
|
|
|
|
|
|
|
|
|
|
|
|
|
|
|
|
| 19-Aug-07 |
272 |
|
|
|
|
|
|
|
|
|
|
|
|
|
|
|
|
|
|
|
| 20-Aug-07 |
271 |
|
|
|
|
|
|
|
|
|
|
|
|
|
|
|
|
|
|
|
| 21-Aug-07 |
284 |
|
|
|
|
|
|
|
|
|
|
|
|
|
|
|
|
|
|
|
| 22-Aug-07 |
259 |
|
|
|
|
|
|
|
|
|
|
|
|
|
|
|
|
|
|
|
| 23-Aug-07 |
242 |
|
|
|
|
|
|
|
|
|
|
|
|
|
|
|
|
|
|
|
| 24-Aug-07 |
258 |
|
|
|
|
|
|
|
|
|
|
|
|
|
|
|
|
|
|
|
| 25-Aug-07 |
258 |
|
|
|
|
|
|
|
|
|
|
|
|
|
|
|
|
|
|
|
| 26-Aug-07 |
250 |
|
|
|
|
|
|
|
|
|
|
|
|
|
|
|
|
|
|
|
| 27-Aug-07 |
242 |
|
|
|
|
|
|
|
|
|
|
|
|
|
|
|
|
|
|
|
| 28-Aug-07 |
228 |
|
|
|
|
|
|
|
|
|
|
|
|
|
|
|
|
|
|
|
| 29-Aug-07 |
229 |
|
|
|
|
|
|
|
|
|
|
|
|
|
|
|
|
|
|
|
| 30-Aug-07 |
236 |
|
|
|
|
|
|
|
|
|
|
|
|
|
|
|
|
|
|
|
| 31-Aug-07 |
244 |
|
|
|
|
|
|
|
|
|
|
|
|
|
|
|
|
|
|
|
| 1-Sep-07 |
243 |
|
|
|
|
|
|
|
|
|
|
|
|
|
|
|
|
|
|
|
| 2-Sep-07 |
265 |
|
|
|
|
|
|
|
|
|
|
|
|
|
|
|
|
|
|
|
| 3-Sep-07 |
265 |
|
|
|
|
|
|
|
|
|
|
|
|
|
|
|
|
|
|
|
| 4-Sep-07 |
252 |
|
|
|
|
|
|
|
|
|
|
|
|
|
|
|
|
|
|
|
| 5-Sep-07 |
251 |
|
|
|
|
|
|
|
|
|
|
|
|
|
|
|
|
|
|
|
| 6-Sep-07 |
238 |
|
|
|
|
|
|
|
|
|
|
|
|
|
|
|
|
|
|
|
| 7-Sep-07 |
228 |
|
|
|
|
|
|
|
|
|
|
|
|
|
|
|
|
|
|
|
| 8-Sep-07 |
229 |
|
|
|
|
|
|
|
|
|
|
|
|
|
|
|
|
|
|
|
| 9-Sep-07 |
224 |
|
|
|
|
|
|
|
|
|
|
|
|
|
|
|
|
|
|
|
| 10-Sep-07 |
224 |
|
|
|
|
|
|
|
|
|
|
|
|
|
|
|
|
|
|
|
| 11-Sep-07 |
245 |
|
|
|
|
|
|
|
|
|
|
|
|
|
|
|
|
|
|
|
| 12-Sep-07 |
241 |
|
|
|
|
|
|
|
|
|
|
|
|
|
|
|
|
|
|
|
| 13-Sep-07 |
248 |
|
|
|
|
|
|
|
|
|
|
|
|
|
|
|
|
|
|
|
| 14-Sep-07 |
244 |
|
|
|
|
|
|
|
|
|
|
|
|
|
|
|
|
|
|
|
| 15-Sep-07 |
242 |
|
|
|
|
|
|
|
|
|
|
|
|
|
|
|
|
|
|
|
| 16-Sep-07 |
245 |
|
|
|
|
|
|
|
|
|
|
|
|
|
|
|
|
|
|
|
| 17-Sep-07 |
237 |
|
|
|
|
|
|
|
|
|
|
|
|
|
|
|
|
|
|
|
| 18-Sep-07 |
240 |
|
|
|
|
|
|
|
|
|
|
|
|
|
|
|
|
|
|
|
| 19-Sep-07 |
231 |
|
|
|
|
|
|
|
|
|
|
|
|
|
|
|
|
|
|
|
| 20-Sep-07 |
233 |
|
|
|
|
|
|
|
|
|
|
|
|
|
|
|
|
|
|
|
| 21-Sep-07 |
219 |
|
|
|
|
|
|
|
|
|
|
|
|
|
|
|
|
|
|
|
| 22-Sep-07 |
212 |
|
|
|
|
|
|
|
|
|
|
|
|
|
|
|
|
|
|
|
| 23-Sep-07 |
222 |
|
|
|
|
|
|
|
|
|
|
|
|
|
|
|
|
|
|
|
| 24-Sep-07 |
200 |
|
|
|
|
|
|
|
|
|
|
|
|
|
|
|
|
|
|
|
| 25-Sep-07 |
256 |
|
|
|
|
|
|
|
|
|
|
|
|
|
|
|
|
|
|
|
| 26-Sep-07 |
256 |
|
|
|
|
|
|
|
|
|
|
|
|
|
|
|
|
|
|
|
| 27-Sep-07 |
250 |
|
|
|
|
|
|
|
|
|
|
|
|
|
|
|
|
|
|
|
| 28-Sep-07 |
264 |
|
|
|
|
|
|
|
|
|
|
|
|
|
|
|
|
|
|
|
| 29-Sep-07 |
267 |
|
|
|
|
|
|
|
|
|
|
|
|
|
|
|
|
|
|
|
| 30-Sep-07 |
257 |
|
|
|
|
|
|
|
|
|
|
|
|
|
|
|
|
|
|
|
| 1-Oct-07 |
275 |
|
|
|
|
|
|
|
|
|
|
|
|
|
|
|
|
|
|
|
| 2-Oct-07 |
242 |
|
|
|
|
|
|
|
|
|
|
|
|
|
|
|
|
|
|
|
| 3-Oct-07 |
209 |
|
|
|
|
|
|
|
|
|
|
|
|
|
|
|
|
|
|
|
| 4-Oct-07 |
200 |
|
|
|
|
|
|
|
|
|
|
|
|
|
|
|
|
|
|
|
| 5-Oct-07 |
201 |
|
|
|
|
|
|
|
|
|
|
|
|
|
|
|
|
|
|
|
| 6-Oct-07 |
234 |
|
|
|
|
|
|
|
|
|
|
|
|
|
|
|
|
|
|
|
| 7-Oct-07 |
241 |
|
|
|
|
|
|
|
|
|
|
|
|
|
|
|
|
|
|
|
| 8-Oct-07 |
254 |
|
|
|
|
|
|
|
|
|
|
|
|
|
|
|
|
|
|
|
| 9-Oct-07 |
249 |
|
|
|
|
|
|
|
|
|
|
|
|
|
|
|
|
|
|
|
| 10-Oct-07 |
239 |
|
|
|
|
|
|
|
|
|
|
|
|
|
|
|
|
|
|
|
| 11-Oct-07 |
229 |
|
|
|
|
|
|
|
|
|
|
|
|
|
|
|
|
|
|
|
| 12-Oct-07 |
229 |
|
|
|
|
|
|
|
|
|
|
|
|
|
|
|
|
|
|
|
| 13-Oct-07 |
258 |
|
|
|
|
|
|
|
|
|
|
|
|
|
|
|
|
|
|
|
| 14-Oct-07 |
281 |
|
|
|
|
|
|
|
|
|
|
|
|
|
|
|
|
|
|
|
| 15-Oct-07 |
297 |
|
|
|
|
|
|
|
|
|
|
|
|
|
|
|
|
|
|
|
| 16-Oct-07 |
277 |
|
|
|
|
|
|
|
|
|
|
|
|
|
|
|
|
|
|
|
| 17-Oct-07 |
280 |
|
|
|
|
|
|
|
|
|
|
|
|
|
|
|
|
|
|
|
| 18-Oct-07 |
244 |
|
|
|
|
|
|
|
|
|
|
|
|
|
|
|
|
|
|
|
| 19-Oct-07 |
220 |
|
|
|
|
|
|
|
|
|
|
|
|
|
|
|
|
|
|
|
| 20-Oct-07 |
214 |
|
|
|
|
|
|
|
|
|
|
|
|
|
|
|
|
|
|
|
| 21-Oct-07 |
243 |
|
|
|
|
|
|
|
|
|
|
|
|
|
|
|
|
|
|
|
| 22-Oct-07 |
267 |
|
|
|
|
|
|
|
|
|
|
|
|
|
|
|
|
|
|
|
| 23-Oct-07 |
261 |
|
|
|
|
|
|
|
|
|
|
|
|
|
|
|
|
|
|
|
| 24-Oct-07 |
279 |
|
|
|
|
|
|
|
|
|
|
|
|
|
|
|
|
|
|
|
| 25-Oct-07 |
260 |
|
|
|
|
|
|
|
|
|
|
|
|
|
|
|
|
|
|
|
| 26-Oct-07 |
245 |
|
|
|
|
|
|
|
|
|
|
|
|
|
|
|
|
|
|
|
| 27-Oct-07 |
215 |
|
|
|
|
|
|
|
|
|
|
|
|
|
|
|
|
|
|
|
| 28-Oct-07 |
215 |
|
|
|
|
|
|
|
|
|
|
|
|
|
|
|
|
|
|
|
| 29-Oct-07 |
199 |
|
|
|
|
|
|
|
|
|
|
|
|
|
|
|
|
|
|
|
| 30-Oct-07 |
221 |
|
|
|
|
|
|
|
|
|
|
|
|
|
|
|
|
|
|
|
| 31-Oct-07 |
213 |
|
|
|
|
|
|
|
|
|
|
|
|
|
|
|
|
|
|
|
| 1-Nov-07 |
217 |
|
|
|
|
|
|
|
|
|
|
|
|
|
|
|
|
|
|
|
| 2-Nov-07 |
220 |
|
|
|
|
|
|
|
|
|
|
|
|
|
|
|
|
|
|
|
| 3-Nov-07 |
215 |
|
|
|
|
|
|
|
|
|
|
|
|
|
|
|
|
|
|
|
| 4-Nov-07 |
240 |
|
|
|
|
|
|
|
|
|
|
|
|
|
|
|
|
|
|
|
| 5-Nov-07 |
248 |
|
|
|
|
|
|
|
|
|
|
|
|
|
|
|
|
|
|
|
| 6-Nov-07 |
263 |
|
|
|
|
|
|
|
|
|
|
|
|
|
|
|
|
|
|
|
| 7-Nov-07 |
245 |
|
|
|
|
|
|
|
|
|
|
|
|
|
|
|
|
|
|
|
| 8-Nov-07 |
238 |
|
|
|
|
|
|
|
|
|
|
|
|
|
|
|
|
|
|
|
| 9-Nov-07 |
236 |
|
|
|
|
|
|
|
|
|
|
|
|
|
|
|
|
|
|
|
| 10-Nov-07 |
223 |
|
|
|
|
|
|
|
|
|
|
|
|
|
|
|
|
|
|
|
| 11-Nov-07 |
234 |
|
|
|
|
|
|
|
|
|
|
|
|
|
|
|
|
|
|
|
| 12-Nov-07 |
280 |
|
|
|
|
|
|
|
|
|
|
|
|
|
|
|
|
|
|
|
| 13-Nov-07 |
280 |
|
|
|
|
|
|
|
|
|
|
|
|
|
|
|
|
|
|
|
| 14-Nov-07 |
287 |
|
|
|
|
|
|
|
|
|
|
|
|
|
|
|
|
|
|
|
| 15-Nov-07 |
285 |
|
|
|
|
|
|
|
|
|
|
|
|
|
|
|
|
|
|
|
| 16-Nov-07 |
211 |
|
|
|
|
|
|
|
|
|
|
|
|
|
|
|
|
|
|
|
| 17-Nov-07 |
214 |
|
|
|
|
|
|
|
|
|
|
|
|
|
|
|
|
|
|
|
| 18-Nov-07 |
199 |
|
|
|
|
|
|
|
|
|
|
|
|
|
|
|
|
|
|
|
| 19-Nov-07 |
191 |
|
|
|
|
|
|
|
|
|
|
|
|
|
|
|
|
|
|
|
| 20-Nov-07 |
239 |
|
|
|
|
|
|
|
|
|
|
|
|
|
|
|
|
|
|
|
| 21-Nov-07 |
245 |
|
|
|
|
|
|
|
|
|
|
|
|
|
|
|
|
|
|
|
| 22-Nov-07 |
251 |
|
|
|
|
|
|
|
|
|
|
|
|
|
|
|
|
|
|
|
| 23-Nov-07 |
248 |
|
|
|
|
|
|
|
|
|
|
|
|
|
|
|
|
|
|
|
| 24-Nov-07 |
242 |
|
|
|
|
|
|
|
|
|
|
|
|
|
|
|
|
|
|
|
| 25-Nov-07 |
245 |
|
|
|
|
|
|
|
|
|
|
|
|
|
|
|
|
|
|
|
| 26-Nov-07 |
241 |
|
|
|
|
|
|
|
|
|
|
|
|
|
|
|
|
|
|
|
| 27-Nov-07 |
238 |
|
|
|
|
|
|
|
|
|
|
|
|
|
|
|
|
|
|
|
| 28-Nov-07 |
252 |
|
|
|
|
|
|
|
|
|
|
|
|
|
|
|
|
|
|
|
| 29-Nov-07 |
252 |
|
|
|
|
|
|
|
|
|
|
|
|
|
|
|
|
|
|
|
| 30-Nov-07 |
253 |
|
|
|
|
|
|
|
|
|
|
|
|
|
|
|
|
|
|
|
| 1-Dec-07 |
253 |
|
|
|
|
|
|
|
|
|
|
|
|
|
|
|
|
|
|
|
| 2-Dec-07 |
253 |
|
|
|
|
|
|
|
|
|
|
|
|
|
|
|
|
|
|
|
| 3-Dec-07 |
253 |
|
|
|
|
|
|
|
|
|
|
|
|
|
|
|
|
|
|
|
| 4-Dec-07 |
|
|
|
|
|
|
|
|
|
|
|
|
|
|
|
|
|
|
|
|
| 5-Dec-07 |
|
|
|
|
|
|
|
|
|
|
|
|
|
|
|
|
|
|
|
|
| 6-Dec-07 |
|
|
|
|
|
|
|
|
|
|
|
|
|
|
|
|
|
|
|
|
| 7-Dec-07 |
212 |
|
|
|
|
|
|
|
|
|
|
|
|
|
|
|
|
|
|
|
| 8-Dec-07 |
212 |
|
|
|
|
|
|
|
|
|
|
|
|
|
|
|
|
|
|
|
| 9-Dec-07 |
221 |
|
|
|
|
|
|
|
|
|
|
|
|
|
|
|
|
|
|
|
| 10-Dec-07 |
237 |
|
|
|
|
|
|
|
|
|
|
|
|
|
|
|
|
|
|
|
| 11-Dec-07 |
250 |
|
|
|
|
|
|
|
|
|
|
|
|
|
|
|
|
|
|
|
| 12-Dec-07 |
311 |
|
|
|
|
|
|
|
|
|
|
|
|
|
|
|
|
|
|
|
| 13-Dec-07 |
354 |
|
|
|
|
|
|
|
|
|
|
|
|
|
|
|
|
|
|
|
| 14-Dec-07 |
271 |
|
|
|
|
|
|
|
|
|
|
|
|
|
|
|
|
|
|
|
| 15-Dec-07 |
271 |
|
|
|
|
|
|
|
|
|
|
|
|
|
|
|
|
|
|
|
| 16-Dec-07 |
284 |
|
|
|
|
|
|
|
|
|
|
|
|
|
|
|
|
|
|
|
| 17-Dec-07 |
283 |
|
|
|
|
|
|
|
|
|
|
|
|
|
|
|
|
|
|
|
| 18-Dec-07 |
355 |
|
|
|
|
|
|
|
|
|
|
|
|
|
|
|
|
|
|
|
| 19-Dec-07 |
317 |
|
|
|
|
|
|
|
|
|
|
|
|
|
|
|
|
|
|
|
| 20-Dec-07 |
269 |
|
|
|
|
|
|
|
|
|
|
|
|
|
|
|
|
|
|
|
| 21-Dec-07 |
250 |
|
|
|
|
|
|
|
|
|
|
|
|
|
|
|
|
|
|
|
| 22-Dec-07 |
219 |
|
|
|
|
|
|
|
|
|
|
|
|
|
|
|
|
|
|
|
| 23-Dec-07 |
215 |
|
|
|
|
|
|
|
|
|
|
|
|
|
|
|
|
|
|
|
| 24-Dec-07 |
227 |
|
|
|
|
|
|
|
|
|
|
|
|
|
|
|
|
|
|
|
| 25-Dec-07 |
235 |
|
|
|
|
|
|
|
|
|
|
|
|
|
|
|
|
|
|
|
| 26-Dec-07 |
230 |
|
|
|
|
|
|
|
|
|
|
|
|
|
|
|
|
|
|
|
| 27-Dec-07 |
238 |
|
|
|
|
|
|
|
|
|
|
|
|
|
|
|
|
|
|
|
| 28-Dec-07 |
218 |
|
|
|
|
|
|
|
|
|
|
|
|
|
|
|
|
|
|
|
| 29-Dec-07 |
202 |
|
|
|
|
|
|
|
|
|
|
|
|
|
|
|
|
|
|
|
| 30-Dec-07 |
181 |
|
|
|
|
|
|
|
|
|
|
|
|
|
|
|
|
|
|
|
| 31-Dec-07 |
181 |
|
|
|
|
|
|
|
|
|
|
|
|
|
|
|
|
|
|
|
| 1-Jan-08 |
204 |
|
|
|
|
|
|
|
|
|
|
|
|
|
|
|
|
|
|
|
| 2-Jan-08 |
210 |
|
|
|
|
|
|
|
|
|
|
|
|
|
|
|
|
|
|
|
| 3-Jan-08 |
216 |
|
|
|
|
|
|
|
|
|
|
|
|
|
|
|
|
|
|
|
| 4-Jan-08 |
206 |
|
|
|
|
|
|
|
|
|
|
|
|
|
|
|
|
|
|
|
| 5-Jan-08 |
196 |
|
|
|
|
|
|
|
|
|
|
|
|
|
|
|
|
|
|
|
| 6-Jan-08 |
196 |
|
|
|
|
|
|
|
|
|
|
|
|
|
|
|
|
|
|
|
| 7-Jan-08 |
198 |
|
|
|
|
|
|
|
|
|
|
|
|
|
|
|
|
|
|
|
| 8-Jan-08 |
247 |
|
|
|
|
|
|
|
|
|
|
|
|
|
|
|
|
|
|
|
| 9-Jan-08 |
229 |
|
|
|
|
|
|
|
|
|
|
|
|
|
|
|
|
|
|
|
| 10-Jan-08 |
217 |
|
|
|
|
|
|
|
|
|
|
|
|
|
|
|
|
|
|
|
| 11-Jan-08 |
220 |
|
|
|
|
|
|
|
|
|
|
|
|
|
|
|
|
|
|
|
| 12-Jan-08 |
203 |
|
|
|
|
|
|
|
|
|
|
|
|
|
|
|
|
|
|
|
| 13-Jan-08 |
206 |
|
|
|
|
|
|
|
|
|
|
|
|
|
|
|
|
|
|
|
| 14-Jan-08 |
215 |
|
|
|
|
|
|
|
|
|
|
|
|
|
|
|
|
|
|
|
| 15-Jan-08 |
226 |
|
|
|
|
|
|
|
|
|
|
|
|
|
|
|
|
|
|
|
| 16-Jan-08 |
226 |
|
|
|
|
|
|
|
|
|
|
|
|
|
|
|
|
|
|
|
| 17-Jan-08 |
247 |
|
|
|
|
|
|
|
|
|
|
|
|
|
|
|
|
|
|
|
| 18-Jan-08 |
241 |
|
|
|
|
|
|
|
|
|
|
|
|
|
|
|
|
|
|
|
| 19-Jan-08 |
251 |
|
|
|
|
|
|
|
|
|
|
|
|
|
|
|
|
|
|
|
| 20-Jan-08 |
246 |
|
|
|
|
|
|
|
|
|
|
|
|
|
|
|
|
|
|
|
| 21-Jan-08 |
248 |
|
|
|
|
|
|
|
|
|
|
|
|
|
|
|
|
|
|
|
| 22-Jan-08 |
192 |
|
|
|
|
|
|
|
|
|
|
|
|
|
|
|
|
|
|
|
| 23-Jan-08 |
149 |
|
|
|
|
|
|
|
|
|
|
|
|
|
|
|
|
|
|
|
| 24-Jan-08 |
140 |
|
|
|
|
|
|
|
|
|
|
|
|
|
|
|
|
|
|
|
| 25-Jan-08 |
171 |
|
|
|
|
|
|
|
|
|
|
|
|
|
|
|
|
|
|
|
| 26-Jan-08 |
238 |
|
|
|
|
|
|
|
|
|
|
|
|
|
|
|
|
|
|
|
| 27-Jan-08 |
250 |
|
|
|
|
|
|
|
|
|
|
|
|
|
|
|
|
|
|
|
| 28-Jan-08 |
262 |
|
|
|
|
|
|
|
|
|
|
|
|
|
|
|
|
|
|
|
| 29-Jan-08 |
309 |
|
|
|
|
|
|
|
|
|
|
|
|
|
|
|
|
|
|
|
| 30-Jan-08 |
328 |
|
|
|
|
|
|
|
|
|
|
|
|
|
|
|
|
|
|
|
| 31-Jan-08 |
330 |
|
|
|
|
|
|
|
|
|
|
|
|
|
|
|
|
|
|
|
| 1-Feb-08 |
330 |
|
|
|
|
|
|
|
|
|
|
|
|
|
|
|
|
|
|
|
| 2-Feb-08 |
316 |
|
|
|
|
|
|
|
|
|
|
|
|
|
|
|
|
|
|
|
| 3-Feb-08 |
318 |
|
|
|
|
|
|
|
|
|
|
|
|
|
|
|
|
|
|
|
| 4-Feb-08 |
369 |
|
|
|
|
|
|
|
|
|
|
|
|
|
|
|
|
|
|
|
| 5-Feb-08 |
367 |
|
|
|
|
|
|
|
|
|
|
|
|
|
|
|
|
|
|
|
| 6-Feb-08 |
373 |
|
|
|
|
|
|
|
|
|
|
|
|
|
|
|
|
|
|
|
| 7-Feb-08 |
375 |
|
|
|
|
|
|
|
|
|
|
|
|
|
|
|
|
|
|
|
| 8-Feb-08 |
345 |
|
|
|
|
|
|
|
|
|
|
|
|
|
|
|
|
|
|
|
| 9-Feb-08 |
299 |
|
|
|
|
|
|
|
|
|
|
|
|
|
|
|
|
|
|
|
| 10-Feb-08 |
290 |
|
|
|
|
|
|
|
|
|
|
|
|
|
|
|
|
|
|
|
| 11-Feb-08 |
363 |
|
|
|
|
|
|
|
|
|
|
|
|
|
|
|
|
|
|
|
| 12-Feb-08 |
333 |
|
|
|
|
|
|
|
|
|
|
|
|
|
|
|
|
|
|
|
| 13-Feb-08 |
364 |
|
|
|
|
|
|
|
|
|
|
|
|
|
|
|
|
|
|
|
| 14-Feb-08 |
383 |
|
|
|
|
|
|
|
|
|
|
|
|
|
|
|
|
|
|
|
| 15-Feb-08 |
333 |
|
|
|
|
|
|
|
|
|
|
|
|
|
|
|
|
|
|
|
| 16-Feb-08 |
447 |
|
|
|
|
|
|
|
|
|
|
|
|
|
|
|
|
|
|
|
| 17-Feb-08 |
447 |
|
|
|
|
|
|
|
|
|
|
|
|
|
|
|
|
|
|
|
| 18-Feb-08 |
587 |
|
|
|
|
|
|
|
|
|
|
|
|
|
|
|
|
|
|
|
| 19-Feb-08 |
652 |
|
|
|
|
|
|
|
|
|
|
|
|
|
|
|
|
|
|
|
| 20-Feb-08 |
840 |
|
|
|
|
|
|
|
|
|
|
|
|
|
|
|
|
|
|
|
| 21-Feb-08 |
895 |
|
|
|
|
|
|
|
|
|
|
|
|
|
|
|
|
|
|
|
| 22-Feb-08 |
966 |
|
|
|
|
|
|
|
|
|
|
|
|
|
|
|
|
|
|
|
| 23-Feb-08 |
1076 |
|
|
|
|
|
|
|
|
|
|
|
|
|
|
|
|
|
|
|
| 24-Feb-08 |
1077 |
|
|
|
|
|
|
|
|
|
|
|
|
|
|
|
|
|
|
|
| 25-Feb-08 |
1215 |
|
|
|
|
|
|
|
|
|
|
|
|
|
|
|
|
|
|
|
| 26-Feb-08 |
1169 |
|
|
|
|
|
|
|
|
|
|
|
|
|
|
|
|
|
|
|
| 27-Feb-08 |
1250 |
|
|
|
|
|
|
|
|
|
|
|
|
|
|
|
|
|
|
|
| 28-Feb-08 |
1222 |
|
|
|
|
|
|
|
|
|
|
|
|
|
|
|
|
|
|
|
| 29-Feb-08 |
1186 |
|
|
|
|
|
|
|
|
|
|
|
|
|
|
|
|
|
|
|
| 1-Mar-08 |
1232 |
|
|
|
|
|
|
|
|
|
|
|
|
|
|
|
|
|
|
|
| 2-Mar-08 |
1223 |
|
|
|
|
|
|
|
|
|
|
|
|
|
|
|
|
|
|
|
| 3-Mar-08 |
1227 |
|
|
|
|
|
|
|
|
|
|
|
|
|
|
|
|
|
|
|
| 4-Mar-08 |
1227 |
|
|
|
|
|
|
|
|
|
|
|
|
|
|
|
|
|
|
|
| 5-Mar-08 |
1239 |
|
|
|
|
|
|
|
|
|
|
|
|
|
|
|
|
|
|
|
| 6-Mar-08 |
1156 |
|
|
|
|
|
|
|
|
|
|
|
|
|
|
|
|
|
|
|
| 7-Mar-08 |
1173 |
|
|
|
|
|
|
|
|
|
|
|
|
|
|
|
|
|
|
|
| 8-Mar-08 |
1190 |
|
|
|
|
|
|
|
|
|
|
|
|
|
|
|
|
|
|
|
| 9-Mar-08 |
1147 |
|
|
|
|
|
|
|
|
|
|
|
|
|
|
|
|
|
|
|
| 10-Mar-08 |
1132 |
|
|
|
|
|
|
|
|
|
|
|
|
|
|
|
|
|
|
|
| 11-Mar-08 |
1096 |
|
|
|
|
|
|
|
|
|
|
|
|
|
|
|
|
|
|
|
| 12-Mar-08 |
891 |
|
|
|
|
|
|
|
|
|
|
|
|
|
|
|
|
|
|
|
| 13-Mar-08 |
883 |
|
|
|
|
|
|
|
|
|
|
|
|
|
|
|
|
|
|
|
| 14-Mar-08 |
877 |
|
|
|
|
|
|
|
|
|
|
|
|
|
|
|
|
|
|
|
| 15-Mar-08 |
890 |
|
|
|
|
|
|
|
|
|
|
|
|
|
|
|
|
|
|
|
| 16-Mar-08 |
922 |
|
|
|
|
|
|
|
|
|
|
|
|
|
|
|
|
|
|
|
| 17-Mar-08 |
953 |
|
|
|
|
|
|
|
|
|
|
|
|
|
|
|
|
|
|
|
| 18-Mar-08 |
964 |
|
|
|
|
|
|
|
|
|
|
|
|
|
|
|
|
|
|
|
| 19-Mar-08 |
913 |
|
|
|
|
|
|
|
|
|
|
|
|
|
|
|
|
|
|
|
| 20-Mar-08 |
913 |
|
|
|
|
|
|
|
|
|
|
|
|
|
|
|
|
|
|
|
| 21-Mar-08 |
903 |
|
|
|
|
|
|
|
|
|
|
|
|
|
|
|
|
|
|
|
| 22-Mar-08 |
914 |
|
|
|
|
|
|
|
|
|
|
|
|
|
|
|
|
|
|
|
| 23-Mar-08 |
1000 |
|
|
|
|
|
|
|
|
|
|
|
|
|
|
|
|
|
|
|
| 24-Mar-08 |
955 |
|
|
|
|
|
|
|
|
|
|
|
|
|
|
|
|
|
|
|
| 25-Mar-08 |
942 |
|
|
|
|
|
|
|
|
|
|
|
|
|
|
|
|
|
|
|
| 26-Mar-08 |
960 |
|
|
|
|
|
|
|
|
|
|
|
|
|
|
|
|
|
|
|
| 27-Mar-08 |
907 |
|
|
|
|
|
|
|
|
|
|
|
|
|
|
|
|
|
|
|
| 28-Mar-08 |
981 |
|
|
|
|
|
|
|
|
|
|
|
|
|
|
|
|
|
|
|
| 29-Mar-08 |
975 |
|
|
|
|
|
|
|
|
|
|
|
|
|
|
|
|
|
|
|
| 30-Mar-08 |
1025 |
|
|
|
|
|
|
|
|
|
|
|
|
|
|
|
|
|
|
|
| 31-Mar-08 |
994 |
|
|
|
|
|
|
|
|
|
|
|
|
|
|
|
|
|
|
|
| 1-Apr-08 |
1010 |
|
|
|
|
|
|
|
|
|
|
|
|
|
|
|
|
|
|
|
| 2-Apr-08 |
950 |
|
|
|
|
|
|
|
|
|
|
|
|
|
|
|
|
|
|
|
| 3-Apr-08 |
889 |
|
|
|
|
|
|
|
|
|
|
|
|
|
|
|
|
|
|
|
| 4-Apr-08 |
948 |
|
|
|
|
|
|
|
|
|
|
|
|
|
|
|
|
|
|
|
| 5-Apr-08 |
948 |
|
|
|
|
|
|
|
|
|
|
|
|
|
|
|
|
|
|
|
| 6-Apr-08 |
1020 |
|
|
|
|
|
|
|
|
|
|
|
|
|
|
|
|
|
|
|
| 7-Apr-08 |
1062 |
|
|
|
|
|
|
|
|
|
|
|
|
|
|
|
|
|
|
|
| 8-Apr-08 |
1067 |
|
|
|
|
|
|
|
|
|
|
|
|
|
|
|
|
|
|
|
| 9-Apr-08 |
1069 |
|
|
|
|
|
|
|
|
|
|
|
|
|
|
|
|
|
|
|
| 10-Apr-08 |
1092 |
|
|
|
|
|
|
|
|
|
|
|
|
|
|
|
|
|
|
|
| 11-Apr-08 |
1057 |
|
|
|
|
|
|
|
|
|
|
|
|
|
|
|
|
|
|
|
| 12-Apr-08 |
1061 |
|
|
|
|
|
|
|
|
|
|
|
|
|
|
|
|
|
|
|
| 13-Apr-08 |
1251 |
|
|
|
|
|
|
|
|
|
|
|
|
|
|
|
|
|
|
|
| 14-Apr-08 |
1134 |
|
|
|
|
|
|
|
|
|
|
|
|
|
|
|
|
|
|
|
| 15-Apr-08 |
1214 |
|
|
|
|
|
|
|
|
|
|
|
|
|
|
|
|
|
|
|
| 16-Apr-08 |
1259 |
|
|
|
|
|
|
|
|
|
|
|
|
|
|
|
|
|
|
|
| 17-Apr-08 |
1192 |
|
|
|
|
|
|
|
|
|
|
|
|
|
|
|
|
|
|
|
| 18-Apr-08 |
1328 |
|
|
|
|
|
|
|
|
|
|
|
|
|
|
|
|
|
|
|
| 19-Apr-08 |
1350 |
|
|
|
|
|
|
|
|
|
|
|
|
|
|
|
|
|
|
|
| 20-Apr-08 |
1264 |
|
|
|
|
|
|
|
|
|
|
|
|
|
|
|
|
|
|
|
| 21-Apr-08 |
1264 |
|
|
|
|
|
|
|
|
|
|
|
|
|
|
|
|
|
|
|
| 22-Apr-08 |
1166 |
|
|
|
|
|
|
|
|
|
|
|
|
|
|
|
|
|
|
|
| 23-Apr-08 |
1180 |
|
|
|
|
|
|
|
|
|
|
|
|
|
|
|
|
|
|
|
| 24-Apr-08 |
1190 |
|
|
|
|
|
|
|
|
|
|
|
|
|
|
|
|
|
|
|
| 25-Apr-08 |
1118 |
|
|
|
|
|
|
|
|
|
|
|
|
|
|
|
|
|
|
|
| 26-Apr-08 |
1116 |
|
|
|
|
|
|
|
|
|
|
|
|
|
|
|
|
|
|
|
| 27-Apr-08 |
1034 |
|
|
|
|
|
|
|
|
|
|
|
|
|
|
|
|
|
|
|
| 28-Apr-08 |
933 |
|
|
|
|
|
|
|
|
|
|
|
|
|
|
|
|
|
|
|
| 29-Apr-08 |
972 |
|
|
|
|
|
|
|
|
|
|
|
|
|
|
|
|
|
|
|
| 30-Apr-08 |
858 |
|
|
|
|
|
|
|
|
|
|
|
|
|
|
|
|
|
|
|
| 1-May-08 |
867 |
|
|
|
|
|
|
|
|
|
|
|
|
|
|
|
|
|
|
|
| 2-May-08 |
867 |
|
|
|
|
|
|
|
|
|
|
|
|
|
|
|
|
|
|
|
| 3-May-08 |
797 |
|
|
|
|
|
|
|
|
|
|
|
|
|
|
|
|
|
|
|
| 4-May-08 |
937 |
|
|
|
|
|
|
|
|
|
|
|
|
|
|
|
|
|
|
|
| 5-May-08 |
861 |
|
|
|
|
|
|
|
|
|
|
|
|
|
|
|
|
|
|
|
| 6-May-08 |
871 |
|
|
|
|
|
|
|
|
|
|
|
|
|
|
|
|
|
|
|
| 7-May-08 |
871 |
|
|
|
|
|
|
|
|
|
|
|
|
|
|
|
|
|
|
|
| 8-May-08 |
842 |
|
|
|
|
|
|
|
|
|
|
|
|
|
|
|
|
|
|
|
| 9-May-08 |
848 |
|
|
|
|
|
|
|
|
|
|
|
|
|
|
|
|
|
|
|
| 10-May-08 |
869 |
|
|
|
|
|
|
|
|
|
|
|
|
|
|
|
|
|
|
|
| 11-May-08 |
826 |
|
|
|
|
|
|
|
|
|
|
|
|
|
|
|
|
|
|
|
| 12-May-08 |
834 |
|
|
|
|
|
|
|
|
|
|
|
|
|
|
|
|
|
|
|
| 13-May-08 |
765 |
|
|
|
|
|
|
|
|
|
|
|
|
|
|
|
|
|
|
|
| 14-May-08 |
686 |
|
|
|
|
|
|
|
|
|
|
|
|
|
|
|
|
|
|
|
| 15-May-08 |
681 |
|
|
|
|
|
|
|
|
|
|
|
|
|
|
|
|
|
|
|
| 16-May-08 |
596 |
|
|
|
|
|
|
|
|
|
|
|
|
|
|
|
|
|
|
|
| 17-May-08 |
613 |
|
|
|
|
|
|
|
|
|
|
|
|
|
|
|
|
|
|
|
| 18-May-08 |
596 |
|
|
|
|
|
|
|
|
|
|
|
|
|
|
|
|
|
|
|
| 19-May-08 |
563 |
|
|
|
|
|
|
|
|
|
|
|
|
|
|
|
|
|
|
|
| 20-May-08 |
591 |
|
|
|
|
|
|
|
|
|
|
|
|
|
|
|
|
|
|
|
| 21-May-08 |
528 |
|
|
|
|
|
|
|
|
|
|
|
|
|
|
|
|
|
|
|
| 22-May-08 |
536 |
|
|
|
|
|
|
|
|
|
|
|
|
|
|
|
|
|
|
|
| 23-May-08 |
536 |
|
|
|
|
|
|
|
|
|
|
|
|
|
|
|
|
|
|
|
| 24-May-08 |
580 |
|
|
|
|
|
|
|
|
|
|
|
|
|
|
|
|
|
|
|
| 25-May-08 |
550 |
|
|
|
|
|
|
|
|
|
|
|
|
|
|
|
|
|
|
|
| 26-May-08 |
569 |
|
|
|
|
|
|
|
|
|
|
|
|
|
|
|
|
|
|
|
| 27-May-08 |
527 |
|
|
|
|
|
|
|
|
|
|
|
|
|
|
|
|
|
|
|
| 28-May-08 |
505 |
|
|
|
|
|
|
|
|
|
|
|
|
|
|
|
|
|
|
|
| 29-May-08 |
497 |
|
|
|
|
|
|
|
|
|
|
|
|
|
|
|
|
|
|
|
| 30-May-08 |
437 |
|
|
|
|
|
|
|
|
|
|
|
|
|
|
|
|
|
|
|
| 31-May-08 |
483 |
|
|
|
|
|
|
|
|
|
|
|
|
|
|
|
|
|
|
|
| 1-Jun-08 |
486 |
|
|
|
|
|
|
|
|
|
|
|
|
|
|
|
|
|
|
|
| 2-Jun-08 |
442 |
|
|
|
|
|
|
|
|
|
|
|
|
|
|
|
|
|
|
|
| 3-Jun-08 |
460 |
|
|
|
|
|
|
|
|
|
|
|
|
|
|
|
|
|
|
|
| 4-Jun-08 |
444 |
|
|
|
|
|
|
|
|
|
|
|
|
|
|
|
|
|
|
|
| 5-Jun-08 |
446 |
|
|
|
|
|
|
|
|
|
|
|
|
|
|
|
|
|
|
|
| 6-Jun-08 |
504 |
|
|
|
|
|
|
|
|
|
|
|
|
|
|
|
|
|
|
|
| 7-Jun-08 |
|
|
|
|
|
|
|
|
|
|
|
|
|
|
|
|
|
|
|
|
| 8-Jun-08 |
|
|
|
|
|
|
|
|
|
|
|
|
|
|
|
|
|
|
|
|
| 9-Jun-08 |
401 |
|
|
|
|
|
|
|
|
|
|
|
|
|
|
|
|
|
|
|
| 10-Jun-08 |
361 |
|
|
|
|
|
|
|
|
|
|
|
|
|
|
|
|
|
|
|
| 11-Jun-08 |
375 |
|
|
|
|
|
|
|
|
|
|
|
|
|
|
|
|
|
|
|
| 12-Jun-08 |
375 |
|
|
|
|
|
|
|
|
|
|
|
|
|
|
|
|
|
|
|
| 13-Jun-08 |
366 |
|
|
|
|
|
|
|
|
|
|
|
|
|
|
|
|
|
|
|
| 14-Jun-08 |
384 |
|
|
|
|
|
|
|
|
|
|
|
|
|
|
|
|
|
|
|
| 15-Jun-08 |
374 |
|
|
|
|
|
|
|
|
|
|
|
|
|
|
|
|
|
|
|
| 16-Jun-08 |
383 |
|
|
|
|
|
|
|
|
|
|
|
|
|
|
|
|
|
|
|
| 17-Jun-08 |
408 |
|
|
|
|
|
|
|
|
|
|
|
|
|
|
|
|
|
|
|
| 18-Jun-08 |
389 |
|
|
|
|
|
|
|
|
|
|
|
|
|
|
|
|
|
|
|
| 19-Jun-08 |
387 |
|
|
|
|
|
|
|
|
|
|
|
|
|
|
|
|
|
|
|
| 20-Jun-08 |
386 |
|
|
|
|
|
|
|
|
|
|
|
|
|
|
|
|
|
|
|
| 21-Jun-08 |
361 |
|
|
|
|
|
|
|
|
|
|
|
|
|
|
|
|
|
|
|
| 22-Jun-08 |
363 |
|
|
|
|
|
|
|
|
|
|
|
|
|
|
|
|
|
|
|
| 23-Jun-08 |
316 |
|
|
|
|
|
|
|
|
|
|
|
|
|
|
|
|
|
|
|
| 24-Jun-08 |
316 |
|
|
|
|
|
|
|
|
|
|
|
|
|
|
|
|
|
|
|
| 25-Jun-08 |
305 |
|
|
|
|
|
|
|
|
|
|
|
|
|
|
|
|
|
|
|
| 26-Jun-08 |
306 |
|
|
|
|
|
|
|
|
|
|
|
|
|
|
|
|
|
|
|
| 27-Jun-08 |
333 |
|
|
|
|
|
|
|
|
|
|
|
|
|
|
|
|
|
|
|
| 28-Jun-08 |
333 |
|
|
|
|
|
|
|
|
|
|
|
|
|
|
|
|
|
|
|
| 29-Jun-08 |
334 |
|
|
|
|
|
|
|
|
|
|
|
|
|
|
|
|
|
|
|
| 30-Jun-08 |
335 |
|
|
|
|
|
|
|
|
|
|
|
|
|
|
|
|
|
|
|
| 1-Jul-08 |
324 |
|
|
|
|
|
|
|
|
|
|
|
|
|
|
|
|
|
|
|
| 2-Jul-08 |
305 |
|
|
|
|
|
|
|
|
|
|
|
|
|
|
|
|
|
|
|
| 3-Jul-08 |
312 |
|
|
|
|
|
|
|
|
|
|
|
|
|
|
|
|
|
|
|
| 4-Jul-08 |
309 |
|
|
|
|
|
|
|
|
|
|
|
|
|
|
|
|
|
|
|
| 5-Jul-08 |
297 |
|
|
|
|
|
|
|
|
|
|
|
|
|
|
|
|
|
|
|
| 6-Jul-08 |
297 |
|
|
|
|
|
|
|
|
|
|
|
|
|
|
|
|
|
|
|
| 7-Jul-08 |
277 |
|
|
|
|
|
|
|
|
|
|
|
|
|
|
|
|
|
|
|
| 8-Jul-08 |
263 |
|
|
|
|
|
|
|
|
|
|
|
|
|
|
|
|
|
|
|
| 9-Jul-08 |
274 |
|
|
|
|
|
|
|
|
|
|
|
|
|
|
|
|
|
|
|
| 10-Jul-08 |
274 |
|
|
|
|
|
|
|
|
|
|
|
|
|
|
|
|
|
|
|
| 11-Jul-08 |
271 |
|
|
|
|
|
|
|
|
|
|
|
|
|
|
|
|
|
|
|
| 12-Jul-08 |
271 |
|
|
|
|
|
|
|
|
|
|
|
|
|
|
|
|
|
|
|
| 13-Jul-08 |
274 |
|
|
|
|
|
|
|
|
|
|
|
|
|
|
|
|
|
|
|
| 14-Jul-08 |
273 |
|
|
|
|
|
|
|
|
|
|
|
|
|
|
|
|
|
|
|
| 15-Jul-08 |
278 |
|
|
|
|
|
|
|
|
|
|
|
|
|
|
|
|
|
|
|
| 16-Jul-08 |
271 |
|
|
|
|
|
|
|
|
|
|
|
|
|
|
|
|
|
|
|
| 17-Jul-08 |
263 |
|
|
|
|
|
|
|
|
|
|
|
|
|
|
|
|
|
|
|
| 18-Jul-08 |
264 |
|
|
|
|
|
|
|
|
|
|
|
|
|
|
|
|
|
|
|
| 19-Jul-08 |
257 |
|
|
|
|
|
|
|
|
|
|
|
|
|
|
|
|
|
|
|
| 20-Jul-08 |
276 |
|
|
|
|
|
|
|
|
|
|
|
|
|
|
|
|
|
|
|
| 21-Jul-08 |
267 |
|
|
|
|
|
|
|
|
|
|
|
|
|
|
|
|
|
|
|
| 22-Jul-08 |
266 |
|
|
|
|
|
|
|
|
|
|
|
|
|
|
|
|
|
|
|
| 23-Jul-08 |
258 |
|
|
|
|
|
|
|
|
|
|
|
|
|
|
|
|
|
|
|
| 24-Jul-08 |
230 |
|
|
|
|
|
|
|
|
|
|
|
|
|
|
|
|
|
|
|
| 25-Jul-08 |
230 |
|
|
|
|
|
|
|
|
|
|
|
|
|
|
|
|
|
|
|
| 26-Jul-08 |
230 |
|
|
|
|
|
|
|
|
|
|
|
|
|
|
|
|
|
|
|
| 27-Jul-08 |
277 |
|
|
|
|
|
|
|
|
|
|
|
|
|
|
|
|
|
|
|
| 28-Jul-08 |
271 |
|
|
|
|
|
|
|
|
|
|
|
|
|
|
|
|
|
|
|
| 29-Jul-08 |
287 |
|
|
|
|
|
|
|
|
|
|
|
|
|
|
|
|
|
|
|
| 30-Jul-08 |
275 |
|
|
|
|
|
|
|
|
|
|
|
|
|
|
|
|
|
|
|
| 31-Jul-08 |
263 |
|
|
|
|
|
|
|
|
|
|
|
|
|
|
|
|
|
|
|
| 1-Aug-08 |
272 |
|
|
|
|
|
|
|
|
|
|
|
|
|
|
|
|
|
|
|
| 2-Aug-08 |
263 |
|
|
|
|
|
|
|
|
|
|
|
|
|
|
|
|
|
|
|
| 3-Aug-08 |
242 |
|
|
|
|
|
|
|
|
|
|
|
|
|
|
|
|
|
|
|
| 4-Aug-08 |
242 |
|
|
|
|
|
|
|
|
|
|
|
|
|
|
|
|
|
|
|
| 5-Aug-08 |
229 |
|
|
|
|
|
|
|
|
|
|
|
|
|
|
|
|
|
|
|
| 6-Aug-08 |
241 |
|
|
|
|
|
|
|
|
|
|
|
|
|
|
|
|
|
|
|
| 7-Aug-08 |
256 |
|
|
|
|
|
|
|
|
|
|
|
|
|
|
|
|
|
|
|
| 8-Aug-08 |
268 |
|
|
|
|
|
|
|
|
|
|
|
|
|
|
|
|
|
|
|
| 9-Aug-08 |
279 |
|
|
|
|
|
|
|
|
|
|
|
|
|
|
|
|
|
|
|
| 10-Aug-08 |
265 |
|
|
|
|
|
|
|
|
|
|
|
|
|
|
|
|
|
|
|
| 11-Aug-08 |
265 |
|
|
|
|
|
|
|
|
|
|
|
|
|
|
|
|
|
|
|
| 12-Aug-08 |
260 |
|
|
|
|
|
|
|
|
|
|
|
|
|
|
|
|
|
|
|
| 13-Aug-08 |
265 |
|
|
|
|
|
|
|
|
|
|
|
|
|
|
|
|
|
|
|
| 14-Aug-08 |
284 |
|
|
|
|
|
|
|
|
|
|
|
|
|
|
|
|
|
|
|
| 15-Aug-08 |
275 |
|
|
|
|
|
|
|
|
|
|
|
|
|
|
|
|
|
|
|
| 16-Aug-08 |
278 |
|
|
|
|
|
|
|
|
|
|
|
|
|
|
|
|
|
|
|
| 17-Aug-08 |
259 |
|
|
|
|
|
|
|
|
|
|
|
|
|
|
|
|
|
|
|
| 18-Aug-08 |
233 |
|
|
|
|
|
|
|
|
|
|
|
|
|
|
|
|
|
|
|
| 19-Aug-08 |
208 |
|
|
|
|
|
|
|
|
|
|
|
|
|
|
|
|
|
|
|
| 20-Aug-08 |
230 |
|
|
|
|
|
|
|
|
|
|
|
|
|
|
|
|
|
|
|
| 21-Aug-08 |
250 |
|
|
|
|
|
|
|
|
|
|
|
|
|
|
|
|
|
|
|
| 22-Aug-08 |
247 |
|
|
|
|
|
|
|
|
|
|
|
|
|
|
|
|
|
|
|
| 23-Aug-08 |
263 |
|
|
|
|
|
|
|
|
|
|
|
|
|
|
|
|
|
|
|
| 24-Aug-08 |
240 |
|
|
|
|
|
|
|
|
|
|
|
|
|
|
|
|
|
|
|
| 25-Aug-08 |
221 |
|
|
|
|
|
|
|
|
|
|
|
|
|
|
|
|
|
|
|
| 26-Aug-08 |
221 |
|
|
|
|
|
|
|
|
|
|
|
|
|
|
|
|
|
|
|
| 27-Aug-08 |
221 |
|
|
|
|
|
|
|
|
|
|
|
|
|
|
|
|
|
|
|
| 28-Aug-08 |
245 |
|
|
|
|
|
|
|
|
|
|
|
|
|
|
|
|
|
|
|
| 29-Aug-08 |
251 |
|
|
|
|
|
|
|
|
|
|
|
|
|
|
|
|
|
|
|
| 30-Aug-08 |
238 |
|
|
|
|
|
|
|
|
|
|
|
|
|
|
|
|
|
|
|
| 31-Aug-08 |
237 |
|
|
|
|
|
|
|
|
|
|
|
|
|
|
|
|
|
|
|
| 1-Sep-08 |
234 |
|
|
|
|
|
|
|
|
|
|
|
|
|
|
|
|
|
|
|
| 2-Sep-08 |
227 |
|
|
|
|
|
|
|
|
|
|
|
|
|
|
|
|
|
|
|
| 3-Sep-08 |
239 |
|
|
|
|
|
|
|
|
|
|
|
|
|
|
|
|
|
|
|
| 4-Sep-08 |
240 |
|
|
|
|
|
|
|
|
|
|
|
|
|
|
|
|
|
|
|
| 5-Sep-08 |
236 |
|
|
|
|
|
|
|
|
|
|
|
|
|
|
|
|
|
|
|
| 6-Sep-08 |
255 |
|
|
|
|
|
|
|
|
|
|
|
|
|
|
|
|
|
|
|
| 7-Sep-08 |
249 |
|
|
|
|
|
|
|
|
|
|
|
|
|
|
|
|
|
|
|
| 8-Sep-08 |
255 |
|
|
|
|
|
|
|
|
|
|
|
|
|
|
|
|
|
|
|
| 9-Sep-08 |
257 |
|
|
|
|
|
|
|
|
|
|
|
|
|
|
|
|
|
|
|
| 10-Sep-08 |
243 |
|
|
|
|
|
|
|
|
|
|
|
|
|
|
|
|
|
|
|
| 11-Sep-08 |
245 |
|
|
|
|
|
|
|
|
|
|
|
|
|
|
|
|
|
|
|
| 12-Sep-08 |
245 |
|
|
|
|
|
|
|
|
|
|
|
|
|
|
|
|
|
|
|
| 13-Sep-08 |
242 |
|
|
|
|
|
|
|
|
|
|
|
|
|
|
|
|
|
|
|
| 14-Sep-08 |
248 |
|
|
|
|
|
|
|
|
|
|
|
|
|
|
|
|
|
|
|
| 15-Sep-08 |
264 |
|
|
|
|
|
|
|
|
|
|
|
|
|
|
|
|
|
|
|
| 16-Sep-08 |
248 |
|
|
|
|
|
|
|
|
|
|
|
|
|
|
|
|
|
|
|
| 17-Sep-08 |
249 |
|
|
|
|
|
|
|
|
|
|
|
|
|
|
|
|
|
|
|
| 18-Sep-08 |
240 |
|
|
|
|
|
|
|
|
|
|
|
|
|
|
|
|
|
|
|
| 19-Sep-08 |
217 |
|
|
|
|
|
|
|
|
|
|
|
|
|
|
|
|
|
|
|
| 20-Sep-08 |
243 |
|
|
|
|
|
|
|
|
|
|
|
|
|
|
|
|
|
|
|
| 21-Sep-08 |
233 |
|
|
|
|
|
|
|
|
|
|
|
|
|
|
|
|
|
|
|
| 22-Sep-08 |
258 |
|
|
|
|
|
|
|
|
|
|
|
|
|
|
|
|
|
|
|
| 23-Sep-08 |
255 |
|
|
|
|
|
|
|
|
|
|
|
|
|
|
|
|
|
|
|
| 24-Sep-08 |
256 |
|
|
|
|
|
|
|
|
|
|
|
|
|
|
|
|
|
|
|
| 25-Sep-08 |
260 |
|
|
|
|
|
|
|
|
|
|
|
|
|
|
|
|
|
|
|
| 26-Sep-08 |
245 |
|
|
|
|
|
|
|
|
|
|
|
|
|
|
|
|
|
|
|
| 27-Sep-08 |
258 |
|
|
|
|
|
|
|
|
|
|
|
|
|
|
|
|
|
|
|
| 28-Sep-08 |
258 |
|
|
|
|
|
|
|
|
|
|
|
|
|
|
|
|
|
|
|
| 29-Sep-08 |
268 |
|
|
|
|
|
|
|
|
|
|
|
|
|
|
|
|
|
|
|
| 30-Sep-08 |
265 |
|
|
|
|
|
|
|
|
|
|
|
|
|
|
|
|
|
|
|
| 1-Oct-08 |
281 |
|
|
|
|
|
|
|
|
|
|
|
|
|
|
|
|
|
|
|
| 2-Oct-08 |
269 |
|
|
|
|
|
|
|
|
|
|
|
|
|
|
|
|
|
|
|
| 3-Oct-08 |
271 |
|
|
|
|
|
|
|
|
|
|
|
|
|
|
|
|
|
|
|
| 4-Oct-08 |
283 |
|
|
|
|
|
|
|
|
|
|
|
|
|
|
|
|
|
|
|
| 5-Oct-08 |
264 |
|
|
|
|
|
|
|
|
|
|
|
|
|
|
|
|
|
|
|
| 6-Oct-08 |
274 |
|
|
|
|
|
|
|
|
|
|
|
|
|
|
|
|
|
|
|
| 7-Oct-08 |
281 |
|
|
|
|
|
|
|
|
|
|
|
|
|
|
|
|
|
|
|
| 8-Oct-08 |
282 |
|
|
|
|
|
|
|
|
|
|
|
|
|
|
|
|
|
|
|
| 9-Oct-08 |
286 |
|
|
|
|
|
|
|
|
|
|
|
|
|
|
|
|
|
|
|
| 10-Oct-08 |
297 |
|
|
|
|
|
|
|
|
|
|
|
|
|
|
|
|
|
|
|
| 11-Oct-08 |
276 |
|
|
|
|
|
|
|
|
|
|
|
|
|
|
|
|
|
|
|
| 12-Oct-08 |
264 |
|
|
|
|
|
|
|
|
|
|
|
|
|
|
|
|
|
|
|
| 13-Oct-08 |
240 |
|
|
|
|
|
|
|
|
|
|
|
|
|
|
|
|
|
|
|
| 14-Oct-08 |
240 |
|
|
|
|
|
|
|
|
|
|
|
|
|
|
|
|
|
|
|
| 15-Oct-08 |
269 |
|
|
|
|
|
|
|
|
|
|
|
|
|
|
|
|
|
|
|
| 16-Oct-08 |
267 |
|
|
|
|
|
|
|
|
|
|
|
|
|
|
|
|
|
|
|
| 17-Oct-08 |
293 |
|
|
|
|
|
|
|
|
|
|
|
|
|
|
|
|
|
|
|
| 18-Oct-08 |
278 |
|
|
|
|
|
|
|
|
|
|
|
|
|
|
|
|
|
|
|
| 19-Oct-08 |
274 |
|
|
|
|
|
|
|
|
|
|
|
|
|
|
|
|
|
|
|
| 20-Oct-08 |
246 |
|
|
|
|
|
|
|
|
|
|
|
|
|
|
|
|
|
|
|
| 21-Oct-08 |
207 |
|
|
|
|
|
|
|
|
|
|
|
|
|
|
|
|
|
|
|
| 22-Oct-08 |
205 |
|
|
|
|
|
|
|
|
|
|
|
|
|
|
|
|
|
|
|
| 23-Oct-08 |
195 |
|
|
|
|
|
|
|
|
|
|
|
|
|
|
|
|
|
|
|
| 24-Oct-08 |
232 |
|
|
|
|
|
|
|
|
|
|
|
|
|
|
|
|
|
|
|
| 25-Oct-08 |
244 |
|
|
|
|
|
|
|
|
|
|
|
|
|
|
|
|
|
|
|
| 26-Oct-08 |
248 |
|
|
|
|
|
|
|
|
|
|
|
|
|
|
|
|
|
|
|
| 27-Oct-08 |
283 |
|
|
|
|
|
|
|
|
|
|
|
|
|
|
|
|
|
|
|
| 28-Oct-08 |
278 |
|
|
|
|
|
|
|
|
|
|
|
|
|
|
|
|
|
|
|
| 29-Oct-08 |
260 |
|
|
|
|
|
|
|
|
|
|
|
|
|
|
|
|
|
|
|
| 30-Oct-08 |
260 |
|
|
|
|
|
|
|
|
|
|
|
|
|
|
|
|
|
|
|
| 31-Oct-08 |
257 |
|
|
|
|
|
|
|
|
|
|
|
|
|
|
|
|
|
|
|
| 1-Nov-08 |
261 |
|
|
|
|
|
|
|
|
|
|
|
|
|
|
|
|
|
|
|
| 2-Nov-08 |
247 |
|
|
|
|
|
|
|
|
|
|
|
|
|
|
|
|
|
|
|
| 3-Nov-08 |
242 |
|
|
|
|
|
|
|
|
|
|
|
|
|
|
|
|
|
|
|
| 4-Nov-08 |
234 |
|
|
|
|
|
|
|
|
|
|
|
|
|
|
|
|
|
|
|
| 5-Nov-08 |
212 |
|
|
|
|
|
|
|
|
|
|
|
|
|
|
|
|
|
|
|
| 6-Nov-08 |
217 |
|
|
|
|
|
|
|
|
|
|
|
|
|
|
|
|
|
|
|
| 7-Nov-08 |
204 |
|
|
|
|
|
|
|
|
|
|
|
|
|
|
|
|
|
|
|
| 8-Nov-08 |
165 |
|
|
|
|
|
|
|
|
|
|
|
|
|
|
|
|
|
|
|
| 9-Nov-08 |
140 |
|
|
|
|
|
|
|
|
|
|
|
|
|
|
|
|
|
|
|
| 10-Nov-08 |
174 |
|
|
|
|
|
|
|
|
|
|
|
|
|
|
|
|
|
|
|
| 11-Nov-08 |
165 |
|
|
|
|
|
|
|
|
|
|
|
|
|
|
|
|
|
|
|
| 12-Nov-08 |
238 |
|
|
|
|
|
|
|
|
|
|
|
|
|
|
|
|
|
|
|
| 13-Nov-08 |
301 |
|
|
|
|
|
|
|
|
|
|
|
|
|
|
|
|
|
|
|
| 14-Nov-08 |
307 |
|
|
|
|
|
|
|
|
|
|
|
|
|
|
|
|
|
|
|
| 15-Nov-08 |
307 |
|
|
|
|
|
|
|
|
|
|
|
|
|
|
|
|
|
|
|
| 16-Nov-08 |
178 |
|
|
|
|
|
|
|
|
|
|
|
|
|
|
|
|
|
|
|
| 17-Nov-08 |
198 |
|
|
|
|
|
|
|
|
|
|
|
|
|
|
|
|
|
|
|
| 18-Nov-08 |
182 |
|
|
|
|
|
|
|
|
|
|
|
|
|
|
|
|
|
|
|
| 19-Nov-08 |
211 |
|
|
|
|
|
|
|
|
|
|
|
|
|
|
|
|
|
|
|
| 20-Nov-08 |
266 |
|
|
|
|
|
|
|
|
|
|
|
|
|
|
|
|
|
|
|
| 21-Nov-08 |
274 |
|
|
|
|
|
|
|
|
|
|
|
|
|
|
|
|
|
|
|
| 22-Nov-08 |
283 |
|
|
|
|
|
|
|
|
|
|
|
|
|
|
|
|
|
|
|
| 23-Nov-08 |
269 |
|
|
|
|
|
|
|
|
|
|
|
|
|
|
|
|
|
|
|
| 24-Nov-08 |
272 |
|
|
|
|
|
|
|
|
|
|
|
|
|
|
|
|
|
|
|
| 25-Nov-08 |
255 |
|
|
|
|
|
|
|
|
|
|
|
|
|
|
|
|
|
|
|
| 26-Nov-08 |
255 |
|
|
|
|
|
|
|
|
|
|
|
|
|
|
|
|
|
|
|
| 27-Nov-08 |
249 |
|
|
|
|
|
|
|
|
|
|
|
|
|
|
|
|
|
|
|
| 28-Nov-08 |
230 |
|
|
|
|
|
|
|
|
|
|
|
|
|
|
|
|
|
|
|
| 29-Nov-08 |
239 |
|
|
|
|
|
|
|
|
|
|
|
|
|
|
|
|
|
|
|
| 30-Nov-08 |
236 |
|
|
|
|
|
|
|
|
|
|
|
|
|
|
|
|
|
|
|
| 1-Dec-08 |
236 |
|
|
|
|
|
|
|
|
|
|
|
|
|
|
|
|
|
|
|
| 2-Dec-08 |
268 |
|
|
|
|
|
|
|
|
|
|
|
|
|
|
|
|
|
|
|
| 3-Dec-08 |
277 |
|
|
|
|
|
|
|
|
|
|
|
|
|
|
|
|
|
|
|
| 4-Dec-08 |
259 |
|
|
|
|
|
|
|
|
|
|
|
|
|
|
|
|
|
|
|
| 5-Dec-08 |
256 |
|
|
|
|
|
|
|
|
|
|
|
|
|
|
|
|
|
|
|
| 6-Dec-08 |
246 |
|
|
|
|
|
|
|
|
|
|
|
|
|
|
|
|
|
|
|
| 7-Dec-08 |
238 |
|
|
|
|
|
|
|
|
|
|
|
|
|
|
|
|
|
|
|
| 8-Dec-08 |
259 |
|
|
|
|
|
|
|
|
|
|
|
|
|
|
|
|
|
|
|
| 9-Dec-08 |
256 |
|
|
|
|
|
|
|
|
|
|
|
|
|
|
|
|
|
|
|
| 10-Dec-08 |
239 |
|
|
|
|
|
|
|
|
|
|
|
|
|
|
|
|
|
|
|
| 11-Dec-08 |
214 |
|
|
|
|
|
|
|
|
|
|
|
|
|
|
|
|
|
|
|
| 12-Dec-08 |
207 |
|
|
|
|
|
|
|
|
|
|
|
|
|
|
|
|
|
|
|
| 13-Dec-08 |
204 |
|
|
|
|
|
|
|
|
|
|
|
|
|
|
|
|
|
|
|
| 14-Dec-08 |
194 |
|
|
|
|
|
|
|
|
|
|
|
|
|
|
|
|
|
|
|
| 15-Dec-08 |
184 |
|
|
|
|
|
|
|
|
|
|
|
|
|
|
|
|
|
|
|
| 16-Dec-08 |
223 |
|
|
|
|
|
|
|
|
|
|
|
|
|
|
|
|
|
|
|
| 17-Dec-08 |
223 |
|
|
|
|
|
|
|
|
|
|
|
|
|
|
|
|
|
|
|
| 18-Dec-08 |
225 |
|
|
|
|
|
|
|
|
|
|
|
|
|
|
|
|
|
|
|
| 19-Dec-08 |
238 |
|
|
|
|
|
|
|
|
|
|
|
|
|
|
|
|
|
|
|
| 20-Dec-08 |
238 |
|
|
|
|
|
|
|
|
|
|
|
|
|
|
|
|
|
|
|
| 21-Dec-08 |
228 |
|
|
|
|
|
|
|
|
|
|
|
|
|
|
|
|
|
|
|
| 22-Dec-08 |
221 |
|
|
|
|
|
|
|
|
|
|
|
|
|
|
|
|
|
|
|
| 23-Dec-08 |
200 |
|
|
|
|
|
|
|
|
|
|
|
|
|
|
|
|
|
|
|
| 24-Dec-08 |
201 |
|
|
|
|
|
|
|
|
|
|
|
|
|
|
|
|
|
|
|
| 25-Dec-08 |
136 |
|
|
|
|
|
|
|
|
|
|
|
|
|
|
|
|
|
|
|
| 26-Dec-08 |
147 |
|
|
|
|
|
|
|
|
|
|
|
|
|
|
|
|
|
|
|
| 27-Dec-08 |
145 |
|
|
|
|
|
|
|
|
|
|
|
|
|
|
|
|
|
|
|
| 28-Dec-08 |
176 |
|
|
|
|
|
|
|
|
|
|
|
|
|
|
|
|
|
|
|
| 29-Dec-08 |
214 |
|
|
|
|
|
|
|
|
|
|
|
|
|
|
|
|
|
|
|
| 30-Dec-08 |
216 |
|
|
|
|
|
|
|
|
|
|
|
|
|
|
|
|
|
|
|
| 31-Dec-08 |
239 |
|
|
|
|
|
|
|
|
|
|
|
|
|
|
|
|
|
|
|
| 1-Jan-09 |
234 |
|
|
|
|
|
|
|
|
|
|
|
|
|
|
|
|
|
|
|
| 2-Jan-09 |
234 |
|
|
|
|
|
|
|
|
|
|
|
|
|
|
|
|
|
|
|
| 3-Jan-09 |
273 |
|
|
|
|
|
|
|
|
|
|
|
|
|
|
|
|
|
|
|
| 4-Jan-09 |
259 |
|
|
|
|
|
|
|
|
|
|
|
|
|
|
|
|
|
|
|
| 5-Jan-09 |
232 |
|
|
|
|
|
|
|
|
|
|
|
|
|
|
|
|
|
|
|
| 6-Jan-09 |
222 |
|
|
|
|
|
|
|
|
|
|
|
|
|
|
|
|
|
|
|
| 7-Jan-09 |
200 |
|
|
|
|
|
|
|
|
|
|
|
|
|
|
|
|
|
|
|
| 8-Jan-09 |
210 |
|
|
|
|
|
|
|
|
|
|
|
|
|
|
|
|
|
|
|
| 9-Jan-09 |
225 |
|
|
|
|
|
|
|
|
|
|
|
|
|
|
|
|
|
|
|
| 10-Jan-09 |
212 |
|
|
|
|
|
|
|
|
|
|
|
|
|
|
|
|
|
|
|
| 11-Jan-09 |
207 |
|
|
|
|
|
|
|
|
|
|
|
|
|
|
|
|
|
|
|
| 12-Jan-09 |
193 |
|
|
|
|
|
|
|
|
|
|
|
|
|
|
|
|
|
|
|
| 13-Jan-09 |
206 |
|
|
|
|
|
|
|
|
|
|
|
|
|
|
|
|
|
|
|
| 14-Jan-09 |
225 |
|
|
|
|
|
|
|
|
|
|
|
|
|
|
|
|
|
|
|
| 15-Jan-09 |
213 |
|
|
|
|
|
|
|
|
|
|
|
|
|
|
|
|
|
|
|
| 16-Jan-09 |
204 |
|
|
|
|
|
|
|
|
|
|
|
|
|
|
|
|
|
|
|
| 17-Jan-09 |
194 |
|
|
|
|
|
|
|
|
|
|
|
|
|
|
|
|
|
|
|
| 18-Jan-09 |
194 |
|
|
|
|
|
|
|
|
|
|
|
|
|
|
|
|
|
|
|
| 19-Jan-09 |
170 |
|
|
|
|
|
|
|
|
|
|
|
|
|
|
|
|
|
|
|
| 20-Jan-09 |
196 |
|
|
|
|
|
|
|
|
|
|
|
|
|
|
|
|
|
|
|
| 21-Jan-09 |
225 |
|
|
|
|
|
|
|
|
|
|
|
|
|
|
|
|
|
|
|
| 22-Jan-09 |
220 |
|
|
|
|
|
|
|
|
|
|
|
|
|
|
|
|
|
|
|
| 23-Jan-09 |
252 |
|
|
|
|
|
|
|
|
|
|
|
|
|
|
|
|
|
|
|
| 24-Jan-09 |
255 |
|
|
|
|
|
|
|
|
|
|
|
|
|
|
|
|
|
|
|
| 25-Jan-09 |
229 |
|
|
|
|
|
|
|
|
|
|
|
|
|
|
|
|
|
|
|
| 26-Jan-09 |
230 |
|
|
|
|
|
|
|
|
|
|
|
|
|
|
|
|
|
|
|
| 27-Jan-09 |
230 |
|
|
|
|
|
|
|
|
|
|
|
|
|
|
|
|
|
|
|
| 28-Jan-09 |
356 |
|
|
|
|
|
|
|
|
|
|
|
|
|
|
|
|
|
|
|
| 29-Jan-09 |
325 |
|
|
|
|
|
|
|
|
|
|
|
|
|
|
|
|
|
|
|
| 30-Jan-09 |
386 |
|
|
|
|
|
|
|
|
|
|
|
|
|
|
|
|
|
|
|
| 31-Jan-09 |
363 |
|
|
|
|
|
|
|
|
|
|
|
|
|
|
|
|
|
|
|
| 1-Feb-09 |
290 |
|
|
|
|
|
|
|
|
|
|
|
|
|
|
|
|
|
|
|
| 2-Feb-09 |
321 |
|
|
|
|
|
|
|
|
|
|
|
|
|
|
|
|
|
|
|
| 3-Feb-09 |
321 |
|
|
|
|
|
|
|
|
|
|
|
|
|
|
|
|
|
|
|
| 4-Feb-09 |
331 |
|
|
|
|
|
|
|
|
|
|
|
|
|
|
|
|
|
|
|
| 5-Feb-09 |
324 |
|
|
|
|
|
|
|
|
|
|
|
|
|
|
|
|
|
|
|
| 6-Feb-09 |
335 |
|
|
|
|
|
|
|
|
|
|
|
|
|
|
|
|
|
|
|
| 7-Feb-09 |
318 |
|
|
|
|
|
|
|
|
|
|
|
|
|
|
|
|
|
|
|
| 8-Feb-09 |
311 |
|
|
|
|
|
|
|
|
|
|
|
|
|
|
|
|
|
|
|
| 9-Feb-09 |
333 |
|
|
|
|
|
|
|
|
|
|
|
|
|
|
|
|
|
|
|
| 10-Feb-09 |
320 |
|
|
|
|
|
|
|
|
|
|
|
|
|
|
|
|
|
|
|
| 11-Feb-09 |
348 |
|
|
|
|
|
|
|
|
|
|
|
|
|
|
|
|
|
|
|
| 12-Feb-09 |
332 |
|
|
|
|
|
|
|
|
|
|
|
|
|
|
|
|
|
|
|
| 13-Feb-09 |
357 |
|
|
|
|
|
|
|
|
|
|
|
|
|
|
|
|
|
|
|
| 14-Feb-09 |
328 |
|
|
|
|
|
|
|
|
|
|
|
|
|
|
|
|
|
|
|
| 15-Feb-09 |
339 |
|
|
|
|
|
|
|
|
|
|
|
|
|
|
|
|
|
|
|
| 16-Feb-09 |
322 |
|
|
|
|
|
|
|
|
|
|
|
|
|
|
|
|
|
|
|
| 17-Feb-09 |
275 |
|
|
|
|
|
|
|
|
|
|
|
|
|
|
|
|
|
|
|
| 18-Feb-09 |
325 |
|
|
|
|
|
|
|
|
|
|
|
|
|
|
|
|
|
|
|
| 19-Feb-09 |
325 |
|
|
|
|
|
|
|
|
|
|
|
|
|
|
|
|
|
|
|
| 20-Feb-09 |
419 |
|
|
|
|
|
|
|
|
|
|
|
|
|
|
|
|
|
|
|
| 21-Feb-09 |
418 |
|
|
|
|
|
|
|
|
|
|
|
|
|
|
|
|
|
|
|
| 22-Feb-09 |
489 |
|
|
|
|
|
|
|
|
|
|
|
|
|
|
|
|
|
|
|
| 23-Feb-09 |
473 |
|
|
|
|
|
|
|
|
|
|
|
|
|
|
|
|
|
|
|
| 24-Feb-09 |
469 |
|
|
|
|
|
|
|
|
|
|
|
|
|
|
|
|
|
|
|
| 25-Feb-09 |
472 |
|
|
|
|
|
|
|
|
|
|
|
|
|
|
|
|
|
|
|
| 26-Feb-09 |
424 |
|
|
|
|
|
|
|
|
|
|
|
|
|
|
|
|
|
|
|
| 27-Feb-09 |
455 |
|
|
|
|
|
|
|
|
|
|
|
|
|
|
|
|
|
|
|
| 28-Feb-09 |
467 |
|
|
|
|
|
|
|
|
|
|
|
|
|
|
|
|
|
|
|
| 1-Mar-09 |
601 |
|
|
|
|
|
|
|
|
|
|
|
|
|
|
|
|
|
|
|
| 2-Mar-09 |
650 |
|
|
|
|
|
|
|
|
|
|
|
|
|
|
|
|
|
|
|
| 3-Mar-09 |
732 |
|
|
|
|
|
|
|
|
|
|
|
|
|
|
|
|
|
|
|
| 4-Mar-09 |
762 |
|
|
|
|
|
|
|
|
|
|
|
|
|
|
|
|
|
|
|
| 5-Mar-09 |
800 |
|
|
|
|
|
|
|
|
|
|
|
|
|
|
|
|
|
|
|
| 6-Mar-09 |
896 |
|
|
|
|
|
|
|
|
|
|
|
|
|
|
|
|
|
|
|
| 7-Mar-09 |
896 |
|
|
|
|
|
|
|
|
|
|
|
|
|
|
|
|
|
|
|
| 8-Mar-09 |
963 |
|
|
|
|
|
|
|
|
|
|
|
|
|
|
|
|
|
|
|
| 9-Mar-09 |
1024 |
|
|
|
|
|
|
|
|
|
|
|
|
|
|
|
|
|
|
|
| 10-Mar-09 |
1062 |
|
|
|
|
|
|
|
|
|
|
|
|
|
|
|
|
|
|
|
| 11-Mar-09 |
1087 |
|
|
|
|
|
|
|
|
|
|
|
|
|
|
|
|
|
|
|
| 12-Mar-09 |
1122 |
|
|
|
|
|
|
|
|
|
|
|
|
|
|
|
|
|
|
|
| 13-Mar-09 |
1215 |
|
|
|
|
|
|
|
|
|
|
|
|
|
|
|
|
|
|
|
| 14-Mar-09 |
1288 |
|
|
|
|
|
|
|
|
|
|
|
|
|
|
|
|
|
|
|
| 15-Mar-09 |
1492 |
|
|
|
|
|
|
|
|
|
|
|
|
|
|
|
|
|
|
|
| 16-Mar-09 |
1487 |
|
|
|
|
|
|
|
|
|
|
|
|
|
|
|
|
|
|
|
| 17-Mar-09 |
1588 |
|
|
|
|
|
|
|
|
|
|
|
|
|
|
|
|
|
|
|
| 18-Mar-09 |
1585 |
|
|
|
|
|
|
|
|
|
|
|
|
|
|
|
|
|
|
|
| 19-Mar-09 |
1593 |
|
|
|
|
|
|
|
|
|
|
|
|
|
|
|
|
|
|
|
| 20-Mar-09 |
1644 |
|
|
|
|
|
|
|
|
|
|
|
|
|
|
|
|
|
|
|
| 21-Mar-09 |
1660 |
|
|
|
|
|
|
|
|
|
|
|
|
|
|
|
|
|
|
|
| 22-Mar-09 |
1790 |
|
|
|
|
|
|
|
|
|
|
|
|
|
|
|
|
|
|
|
| 23-Mar-09 |
1790 |
|
|
|
|
|
|
|
|
|
|
|
|
|
|
|
|
|
|
|
| 24-Mar-09 |
1874 |
|
|
|
|
|
|
|
|
|
|
|
|
|
|
|
|
|
|
|
| 25-Mar-09 |
1805 |
|
|
|
|
|
|
|
|
|
|
|
|
|
|
|
|
|
|
|
| 26-Mar-09 |
|
|
|
|
|
|
|
|
|
|
|
|
|
|
|
|
|
|
|
|
| 27-Mar-09 |
1815 |
|
|
|
|
|
|
|
|
|
|
|
|
|
|
|
|
|
|
|
| 28-Mar-09 |
1774 |
|
|
|
|
|
|
|
|
|
|
|
|
|
|
|
|
|
|
|
| 29-Mar-09 |
1738 |
|
|
|
|
|
|
|
|
|
|
|
|
|
|
|
|
|
|
|
| 30-Mar-09 |
1744 |
|
|
|
|
|
|
|
|
|
|
|
|
|
|
|
|
|
|
|
| 31-Mar-09 |
1735 |
|
|
|
|
|
|
|
|
|
|
|
|
|
|
|
|
|
|
|
| 1-Apr-09 |
1640 |
|
|
|
|
|
|
|
|
|
|
|
|
|
|
|
|
|
|
|
| 2-Apr-09 |
1681 |
|
|
|
|
|
|
|
|
|
|
|
|
|
|
|
|
|
|
|
| 3-Apr-09 |
1701 |
|
|
|
|
|
|
|
|
|
|
|
|
|
|
|
|
|
|
|
| 4-Apr-09 |
1661 |
|
|
|
|
|
|
|
|
|
|
|
|
|
|
|
|
|
|
|
| 5-Apr-09 |
1797 |
|
|
|
|
|
|
|
|
|
|
|
|
|
|
|
|
|
|
|
| 6-Apr-09 |
1806 |
|
|
|
|
|
|
|
|
|
|
|
|
|
|
|
|
|
|
|
| 7-Apr-09 |
1747 |
|
|
|
|
|
|
|
|
|
|
|
|
|
|
|
|
|
|
|
| 8-Apr-09 |
1747 |
|
|
|
|
|
|
|
|
|
|
|
|
|
|
|
|
|
|
|
| 9-Apr-09 |
1754 |
|
|
|
|
|
|
|
|
|
|
|
|
|
|
|
|
|
|
|
| 10-Apr-09 |
1734 |
|
|
|
|
|
|
|
|
|
|
|
|
|
|
|
|
|
|
|
| 11-Apr-09 |
1734 |
|
|
|
|
|
|
|
|
|
|
|
|
|
|
|
|
|
|
|
| 12-Apr-09 |
1698 |
|
|
|
|
|
|
|
|
|
|
|
|
|
|
|
|
|
|
|
| 13-Apr-09 |
1671 |
|
|
|
|
|
|
|
|
|
|
|
|
|
|
|
|
|
|
|
| 14-Apr-09 |
1623 |
|
|
|
|
|
|
|
|
|
|
|
|
|
|
|
|
|
|
|
| 15-Apr-09 |
1618 |
|
|
|
|
|
|
|
|
|
|
|
|
|
|
|
|
|
|
|
| 16-Apr-09 |
1720 |
|
|
|
|
|
|
|
|
|
|
|
|
|
|
|
|
|
|
|
| 17-Apr-09 |
1680 |
|
|
|
|
|
|
|
|
|
|
|
|
|
|
|
|
|
|
|
| 18-Apr-09 |
1679 |
|
|
|
|
|
|
|
|
|
|
|
|
|
|
|
|
|
|
|
| 19-Apr-09 |
1662 |
|
|
|
|
|
|
|
|
|
|
|
|
|
|
|
|
|
|
|
| 20-Apr-09 |
1629 |
|
|
|
|
|
|
|
|
|
|
|
|
|
|
|
|
|
|
|
| 21-Apr-09 |
1675 |
|
|
|
|
|
|
|
|
|
|
|
|
|
|
|
|
|
|
|
| 22-Apr-09 |
1694 |
|
|
|
|
|
|
|
|
|
|
|
|
|
|
|
|
|
|
|
| 23-Apr-09 |
1656 |
|
|
|
|
|
|
|
|
|
|
|
|
|
|
|
|
|
|
|
| 24-Apr-09 |
1656 |
|
|
|
|
|
|
|
|
|
|
|
|
|
|
|
|
|
|
|
| 25-Apr-09 |
1547 |
|
|
|
|
|
|
|
|
|
|
|
|
|
|
|
|
|
|
|
| 26-Apr-09 |
1482 |
|
|
|
|
|
|
|
|
|
|
|
|
|
|
|
|
|
|
|
| 27-Apr-09 |
1464 |
|
|
|
|
|
|
|
|
|
|
|
|
|
|
|
|
|
|
|
| 28-Apr-09 |
1474 |
|
|
|
|
|
|
|
|
|
|
|
|
|
|
|
|
|
|
|
| 29-Apr-09 |
1453 |
|
|
|
|
|
|
|
|
|
|
|
|
|
|
|
|
|
|
|
| 30-Apr-09 |
1450 |
|
|
|
|
|
|
|
|
|
|
|
|
|
|
|
|
|
|
|
| 1-May-09 |
1424 |
|
|
|
|
|
|
|
|
|
|
|
|
|
|
|
|
|
|
|
| 2-May-09 |
1362 |
|
|
|
|
|
|
|
|
|
|
|
|
|
|
|
|
|
|
|
| 3-May-09 |
1247 |
|
|
|
|
|
|
|
|
|
|
|
|
|
|
|
|
|
|
|
| 4-May-09 |
1224 |
|
|
|
|
|
|
|
|
|
|
|
|
|
|
|
|
|
|
|
| 5-May-09 |
1253 |
|
|
|
|
|
|
|
|
|
|
|
|
|
|
|
|
|
|
|
| 6-May-09 |
1211 |
|
|
|
|
|
|
|
|
|
|
|
|
|
|
|
|
|
|
|
| 7-May-09 |
1279 |
|
|
|
|
|
|
|
|
|
|
|
|
|
|
|
|
|
|
|
| 8-May-09 |
1281 |
|
|
|
|
|
|
|
|
|
|
|
|
|
|
|
|
|
|
|
| 9-May-09 |
1104 |
|
|
|
|
|
|
|
|
|
|
|
|
|
|
|
|
|
|
|
| 10-May-09 |
1104 |
|
|
|
|
|
|
|
|
|
|
|
|
|
|
|
|
|
|
|
| 11-May-09 |
996 |
|
|
|
|
|
|
|
|
|
|
|
|
|
|
|
|
|
|
|
| 12-May-09 |
970 |
|
|
|
|
|
|
|
|
|
|
|
|
|
|
|
|
|
|
|
| 13-May-09 |
1009 |
|
|
|
|
|
|
|
|
|
|
|
|
|
|
|
|
|
|
|
| 14-May-09 |
1001 |
|
|
|
|
|
|
|
|
|
|
|
|
|
|
|
|
|
|
|
| 15-May-09 |
998 |
|
|
|
|
|
|
|
|
|
|
|
|
|
|
|
|
|
|
|
| 16-May-09 |
929 |
|
|
|
|
|
|
|
|
|
|
|
|
|
|
|
|
|
|
|
| 17-May-09 |
848 |
|
|
|
|
|
|
|
|
|
|
|
|
|
|
|
|
|
|
|
| 18-May-09 |
781 |
|
|
|
|
|
|
|
|
|
|
|
|
|
|
|
|
|
|
|
| 19-May-09 |
737 |
|
|
|
|
|
|
|
|
|
|
|
|
|
|
|
|
|
|
|
| 20-May-09 |
739 |
|
|
|
|
|
|
|
|
|
|
|
|
|
|
|
|
|
|
|
| 21-May-09 |
712 |
|
|
|
|
|
|
|
|
|
|
|
|
|
|
|
|
|
|
|
| 22-May-09 |
669 |
|
|
|
|
|
|
|
|
|
|
|
|
|
|
|
|
|
|
|
| 23-May-09 |
669 |
|
|
|
|
|
|
|
|
|
|
|
|
|
|
|
|
|
|
|
| 24-May-09 |
641 |
|
|
|
|
|
|
|
|
|
|
|
|
|
|
|
|
|
|
|
| 25-May-09 |
619 |
|
|
|
|
|
|
|
|
|
|
|
|
|
|
|
|
|
|
|
| 26-May-09 |
619 |
|
|
|
|
|
|
|
|
|
|
|
|
|
|
|
|
|
|
|
| 27-May-09 |
576 |
|
|
|
|
|
|
|
|
|
|
|
|
|
|
|
|
|
|
|
| 28-May-09 |
546 |
|
|
|
|
|
|
|
|
|
|
|
|
|
|
|
|
|
|
|
| 29-May-09 |
547 |
|
|
|
|
|
|
|
|
|
|
|
|
|
|
|
|
|
|
|
| 30-May-09 |
546 |
|
|
|
|
|
|
|
|
|
|
|
|
|
|
|
|
|
|
|
| 31-May-09 |
540 |
|
|
|
|
|
|
|
|
|
|
|
|
|
|
|
|
|
|
|
| 1-Jun-09 |
542 |
|
|
|
|
|
|
|
|
|
|
|
|
|
|
|
|
|
|
|
| 2-Jun-09 |
517 |
|
|
|
|
|
|
|
|
|
|
|
|
|
|
|
|
|
|
|
| 3-Jun-09 |
497 |
|
|
|
|
|
|
|
|
|
|
|
|
|
|
|
|
|
|
|
| 4-Jun-09 |
490 |
|
|
|
|
|
|
|
|
|
|
|
|
|
|
|
|
|
|
|
| 5-Jun-09 |
511 |
|
|
|
|
|
|
|
|
|
|
|
|
|
|
|
|
|
|
|
| 6-Jun-09 |
501 |
|
|
|
|
|
|
|
|
|
|
|
|
|
|
|
|
|
|
|
| 7-Jun-09 |
500 |
|
|
|
|
|
|
|
|
|
|
|
|
|
|
|
|
|
|
|
| 8-Jun-09 |
477 |
|
|
|
|
|
|
|
|
|
|
|
|
|
|
|
|
|
|
|
| 9-Jun-09 |
437 |
|
|
|
|
|
|
|
|
|
|
|
|
|
|
|
|
|
|
|
| 10-Jun-09 |
457 |
|
|
|
|
|
|
|
|
|
|
|
|
|
|
|
|
|
|
|
| 11-Jun-09 |
457 |
|
|
|
|
|
|
|
|
|
|
|
|
|
|
|
|
|
|
|
| 12-Jun-09 |
487 |
|
|
|
|
|
|
|
|
|
|
|
|
|
|
|
|
|
|
|
| 13-Jun-09 |
480 |
|
|
|
|
|
|
|
|
|
|
|
|
|
|
|
|
|
|
|
| 14-Jun-09 |
478 |
|
|
|
|
|
|
|
|
|
|
|
|
|
|
|
|
|
|
|
| 15-Jun-09 |
466 |
|
|
|
|
|
|
|
|
|
|
|
|
|
|
|
|
|
|
|
| 16-Jun-09 |
467 |
|
|
|
|
|
|
|
|
|
|
|
|
|
|
|
|
|
|
|
| 17-Jun-09 |
455 |
|
|
|
|
|
|
|
|
|
|
|
|
|
|
|
|
|
|
|
| 18-Jun-09 |
429 |
|
|
|
|
|
|
|
|
|
|
|
|
|
|
|
|
|
|
|
| 19-Jun-09 |
449 |
|
|
|
|
|
|
|
|
|
|
|
|
|
|
|
|
|
|
|
| 20-Jun-09 |
439 |
|
|
|
|
|
|
|
|
|
|
|
|
|
|
|
|
|
|
|
| 21-Jun-09 |
429 |
|
|
|
|
|
|
|
|
|
|
|
|
|
|
|
|
|
|
|
| 22-Jun-09 |
414 |
|
|
|
|
|
|
|
|
|
|
|
|
|
|
|
|
|
|
|
| 23-Jun-09 |
396 |
|
|
|
|
|
|
|
|
|
|
|
|
|
|
|
|
|
|
|
| 24-Jun-09 |
382 |
|
|
|
|
|
|
|
|
|
|
|
|
|
|
|
|
|
|
|
| 25-Jun-09 |
373 |
|
|
|
|
|
|
|
|
|
|
|
|
|
|
|
|
|
|
|
| 26-Jun-09 |
353 |
|
|
|
|
|
|
|
|
|
|
|
|
|
|
|
|
|
|
|
| 27-Jun-09 |
353 |
|
|
|
|
|
|
|
|
|
|
|
|
|
|
|
|
|
|
|
| 28-Jun-09 |
354 |
|
|
|
|
|
|
|
|
|
|
|
|
|
|
|
|
|
|
|
| 29-Jun-09 |
355 |
|
|
|
|
|
|
|
|
|
|
|
|
|
|
|
|
|
|
|
| 30-Jun-09 |
335 |
|
|
|
|
|
|
|
|
|
|
|
|
|
|
|
|
|
|
|
| 1-Jul-09 |
329 |
|
|
|
|
|
|
|
|
|
|
|
|
|
|
|
|
|
|
|
| 2-Jul-09 |
312 |
|
|
|
|
|
|
|
|
|
|
|
|
|
|
|
|
|
|
|
| 3-Jul-09 |
298 |
|
|
|
|
|
|
|
|
|
|
|
|
|
|
|
|
|
|
|
| 4-Jul-09 |
312 |
|
|
|
|
|
|
|
|
|
|
|
|
|
|
|
|
|
|
|
| 5-Jul-09 |
337 |
|
|
|
|
|
|
|
|
|
|
|
|
|
|
|
|
|
|
|
| 6-Jul-09 |
344 |
|
|
|
|
|
|
|
|
|
|
|
|
|
|
|
|
|
|
|
| 7-Jul-09 |
318 |
|
|
|
|
|
|
|
|
|
|
|
|
|
|
|
|
|
|
|
| 8-Jul-09 |
303 |
|
|
|
|
|
|
|
|
|
|
|
|
|
|
|
|
|
|
|
| 9-Jul-09 |
285 |
|
|
|
|
|
|
|
|
|
|
|
|
|
|
|
|
|
|
|
| 10-Jul-09 |
266 |
|
|
|
|
|
|
|
|
|
|
|
|
|
|
|
|
|
|
|
| 11-Jul-09 |
281 |
|
|
|
|
|
|
|
|
|
|
|
|
|
|
|
|
|
|
|
| 12-Jul-09 |
302 |
|
|
|
|
|
|
|
|
|
|
|
|
|
|
|
|
|
|
|
| 13-Jul-09 |
302 |
|
|
|
|
|
|
|
|
|
|
|
|
|
|
|
|
|
|
|
| 14-Jul-09 |
311 |
|
|
|
|
|
|
|
|
|
|
|
|
|
|
|
|
|
|
|
| 15-Jul-09 |
305 |
|
|
|
|
|
|
|
|
|
|
|
|
|
|
|
|
|
|
|
| 16-Jul-09 |
318 |
|
|
|
|
|
|
|
|
|
|
|
|
|
|
|
|
|
|
|
| 17-Jul-09 |
310 |
|
|
|
|
|
|
|
|
|
|
|
|
|
|
|
|
|
|
|
| 18-Jul-09 |
306 |
|
|
|
|
|
|
|
|
|
|
|
|
|
|
|
|
|
|
|
| 19-Jul-09 |
295 |
|
|
|
|
|
|
|
|
|
|
|
|
|
|
|
|
|
|
|
| 20-Jul-09 |
272 |
|
|
|
|
|
|
|
|
|
|
|
|
|
|
|
|
|
|
|
| 21-Jul-09 |
284 |
|
|
|
|
|
|
|
|
|
|
|
|
|
|
|
|
|
|
|
| 22-Jul-09 |
281 |
|
|
|
|
|
|
|
|
|
|
|
|
|
|
|
|
|
|
|
| 23-Jul-09 |
292 |
|
|
|
|
|
|
|
|
|
|
|
|
|
|
|
|
|
|
|
| 24-Jul-09 |
285 |
|
|
|
|
|
|
|
|
|
|
|
|
|
|
|
|
|
|
|
| 25-Jul-09 |
274 |
|
|
|
|
|
|
|
|
|
|
|
|
|
|
|
|
|
|
|
| 26-Jul-09 |
271 |
|
|
|
|
|
|
|
|
|
|
|
|
|
|
|
|
|
|
|
| 27-Jul-09 |
271 |
|
|
|
|
|
|
|
|
|
|
|
|
|
|
|
|
|
|
|
| 28-Jul-09 |
283 |
|
|
|
|
|
|
|
|
|
|
|
|
|
|
|
|
|
|
|
| 29-Jul-09 |
283 |
|
|
|
|
|
|
|
|
|
|
|
|
|
|
|
|
|
|
|
| 30-Jul-09 |
293 |
|
|
|
|
|
|
|
|
|
|
|
|
|
|
|
|
|
|
|
| 31-Jul-09 |
297 |
|
|
|
|
|
|
|
|
|
|
|
|
|
|
|
|
|
|
|
| 1-Aug-09 |
311 |
|
|
|
|
|
|
|
|
|
|
|
|
|
|
|
|
|
|
|
| 2-Aug-09 |
295 |
|
|
|
|
|
|
|
|
|
|
|
|
|
|
|
|
|
|
|
| 3-Aug-09 |
296 |
|
|
|
|
|
|
|
|
|
|
|
|
|
|
|
|
|
|
|
| 4-Aug-09 |
286 |
|
|
|
|
|
|
|
|
|
|
|
|
|
|
|
|
|
|
|
| 5-Aug-09 |
261 |
|
|
|
|
|
|
|
|
|
|
|
|
|
|
|
|
|
|
|
| 6-Aug-09 |
270 |
|
|
|
|
|
|
|
|
|
|
|
|
|
|
|
|
|
|
|
| 7-Aug-09 |
280 |
|
|
|
|
|
|
|
|
|
|
|
|
|
|
|
|
|
|
|
| 8-Aug-09 |
292 |
|
|
|
|
|
|
|
|
|
|
|
|
|
|
|
|
|
|
|
| 9-Aug-09 |
281 |
|
|
|
|
|
|
|
|
|
|
|
|
|
|
|
|
|
|
|
| 10-Aug-09 |
285 |
|
|
|
|
|
|
|
|
|
|
|
|
|
|
|
|
|
|
|
| 11-Aug-09 |
261 |
|
|
|
|
|
|
|
|
|
|
|
|
|
|
|
|
|
|
|
| 12-Aug-09 |
237 |
|
|
|
|
|
|
|
|
|
|
|
|
|
|
|
|
|
|
|
| 13-Aug-09 |
255 |
|
|
|
|
|
|
|
|
|
|
|
|
|
|
|
|
|
|
|
| 14-Aug-09 |
255 |
|
|
|
|
|
|
|
|
|
|
|
|
|
|
|
|
|
|
|
| 15-Aug-09 |
252 |
|
|
|
|
|
|
|
|
|
|
|
|
|
|
|
|
|
|
|
| 16-Aug-09 |
259 |
|
|
|
|
|
|
|
|
|
|
|
|
|
|
|
|
|
|
|
| 17-Aug-09 |
262 |
|
|
|
|
|
|
|
|
|
|
|
|
|
|
|
|
|
|
|
| 18-Aug-09 |
261 |
|
|
|
|
|
|
|
|
|
|
|
|
|
|
|
|
|
|
|
| 19-Aug-09 |
274 |
|
|
|
|
|
|
|
|
|
|
|
|
|
|
|
|
|
|
|
| 20-Aug-09 |
273 |
|
|
|
|
|
|
|
|
|
|
|
|
|
|
|
|
|
|
|
| 21-Aug-09 |
263 |
|
|
|
|
|
|
|
|
|
|
|
|
|
|
|
|
|
|
|
| 22-Aug-09 |
264 |
|
|
|
|
|
|
|
|
|
|
|
|
|
|
|
|
|
|
|
| 23-Aug-09 |
263 |
|
|
|
|
|
|
|
|
|
|
|
|
|
|
|
|
|
|
|
| 24-Aug-09 |
257 |
|
|
|
|
|
|
|
|
|
|
|
|
|
|
|
|
|
|
|
| 25-Aug-09 |
244 |
|
|
|
|
|
|
|
|
|
|
|
|
|
|
|
|
|
|
|
| 26-Aug-09 |
240 |
|
|
|
|
|
|
|
|
|
|
|
|
|
|
|
|
|
|
|
| 27-Aug-09 |
242 |
|
|
|
|
|
|
|
|
|
|
|
|
|
|
|
|
|
|
|
| 28-Aug-09 |
238 |
|
|
|
|
|
|
|
|
|
|
|
|
|
|
|
|
|
|
|
| 29-Aug-09 |
259 |
|
|
|
|
|
|
|
|
|
|
|
|
|
|
|
|
|
|
|
| 30-Aug-09 |
259 |
|
|
|
|
|
|
|
|
|
|
|
|
|
|
|
|
|
|
|
| 31-Aug-09 |
257 |
|
|
|
|
|
|
|
|
|
|
|
|
|
|
|
|
|
|
|
| 1-Sep-09 |
260 |
|
|
|
|
|
|
|
|
|
|
|
|
|
|
|
|
|
|
|
| 2-Sep-09 |
272 |
|
|
|
|
|
|
|
|
|
|
|
|
|
|
|
|
|
|
|
| 3-Sep-09 |
270 |
|
|
|
|
|
|
|
|
|
|
|
|
|
|
|
|
|
|
|
| 4-Sep-09 |
271 |
|
|
|
|
|
|
|
|
|
|
|
|
|
|
|
|
|
|
|
| 5-Sep-09 |
268 |
|
|
|
|
|
|
|
|
|
|
|
|
|
|
|
|
|
|
|
| 6-Sep-09 |
259 |
|
|
|
|
|
|
|
|
|
|
|
|
|
|
|
|
|
|
|
| 7-Sep-09 |
252 |
|
|
|
|
|
|
|
|
|
|
|
|
|
|
|
|
|
|
|
| 8-Sep-09 |
264 |
|
|
|
|
|
|
|
|
|
|
|
|
|
|
|
|
|
|
|
| 9-Sep-09 |
272 |
|
|
|
|
|
|
|
|
|
|
|
|
|
|
|
|
|
|
|
| 10-Sep-09 |
272 |
|
|
|
|
|
|
|
|
|
|
|
|
|
|
|
|
|
|
|
| 11-Sep-09 |
284 |
|
|
|
|
|
|
|
|
|
|
|
|
|
|
|
|
|
|
|
| 12-Sep-09 |
253 |
|
|
|
|
|
|
|
|
|
|
|
|
|
|
|
|
|
|
|
| 13-Sep-09 |
228 |
|
|
|
|
|
|
|
|
|
|
|
|
|
|
|
|
|
|
|
| 14-Sep-09 |
245 |
|
|
|
|
|
|
|
|
|
|
|
|
|
|
|
|
|
|
|
| 15-Sep-09 |
245 |
|
|
|
|
|
|
|
|
|
|
|
|
|
|
|
|
|
|
|
| 16-Sep-09 |
274 |
|
|
|
|
|
|
|
|
|
|
|
|
|
|
|
|
|
|
|
| 17-Sep-09 |
258 |
|
|
|
|
|
|
|
|
|
|
|
|
|
|
|
|
|
|
|
| 18-Sep-09 |
271 |
|
|
|
|
|
|
|
|
|
|
|
|
|
|
|
|
|
|
|
| 19-Sep-09 |
249 |
|
|
|
|
|
|
|
|
|
|
|
|
|
|
|
|
|
|
|
| 20-Sep-09 |
237 |
|
|
|
|
|
|
|
|
|
|
|
|
|
|
|
|
|
|
|
| 21-Sep-09 |
250 |
|
|
|
|
|
|
|
|
|
|
|
|
|
|
|
|
|
|
|
| 22-Sep-09 |
226 |
|
|
|
|
|
|
|
|
|
|
|
|
|
|
|
|
|
|
|
| 23-Sep-09 |
219 |
|
|
|
|
|
|
|
|
|
|
|
|
|
|
|
|
|
|
|
| 24-Sep-09 |
235 |
|
|
|
|
|
|
|
|
|
|
|
|
|
|
|
|
|
|
|
| 25-Sep-09 |
203 |
|
|
|
|
|
|
|
|
|
|
|
|
|
|
|
|
|
|
|
| 26-Sep-09 |
214 |
|
|
|
|
|
|
|
|
|
|
|
|
|
|
|
|
|
|
|
| 27-Sep-09 |
228 |
|
|
|
|
|
|
|
|
|
|
|
|
|
|
|
|
|
|
|
| 28-Sep-09 |
210 |
|
|
|
|
|
|
|
|
|
|
|
|
|
|
|
|
|
|
|
| 29-Sep-09 |
230 |
|
|
|
|
|
|
|
|
|
|
|
|
|
|
|
|
|
|
|
| 30-Sep-09 |
211 |
|
|
|
|
|
|
|
|
|
|
|
|
|
|
|
|
|
|
|
| 1-Oct-09 |
211 |
|
|
|
|
|
|
|
|
|
|
|
|
|
|
|
|
|
|
|
| 2-Oct-09 |
280 |
|
|
|
|
|
|
|
|
|
|
|
|
|
|
|
|
|
|
|
| 3-Oct-09 |
241 |
|
|
|
|
|
|
|
|
|
|
|
|
|
|
|
|
|
|
|
| 4-Oct-09 |
265 |
|
|
|
|
|
|
|
|
|
|
|
|
|
|
|
|
|
|
|
| 5-Oct-09 |
250 |
|
|
|
|
|
|
|
|
|
|
|
|
|
|
|
|
|
|
|
| 6-Oct-09 |
220 |
|
|
|
|
|
|
|
|
|
|
|
|
|
|
|
|
|
|
|
| 7-Oct-09 |
248 |
|
|
|
|
|
|
|
|
|
|
|
|
|
|
|
|
|
|
|
| 8-Oct-09 |
230 |
|
|
|
|
|
|
|
|
|
|
|
|
|
|
|
|
|
|
|
| 9-Oct-09 |
251 |
|
|
|
|
|
|
|
|
|
|
|
|
|
|
|
|
|
|
|
| 10-Oct-09 |
258 |
|
|
|
|
|
|
|
|
|
|
|
|
|
|
|
|
|
|
|
| 11-Oct-09 |
155 |
|
|
|
|
|
|
|
|
|
|
|
|
|
|
|
|
|
|
|
| 12-Oct-09 |
181 |
|
|
|
|
|
|
|
|
|
|
|
|
|
|
|
|
|
|
|
| 13-Oct-09 |
151 |
|
|
|
|
|
|
|
|
|
|
|
|
|
|
|
|
|
|
|
| 14-Oct-09 |
162 |
|
|
|
|
|
|
|
|
|
|
|
|
|
|
|
|
|
|
|
| 15-Oct-09 |
247 |
|
|
|
|
|
|
|
|
|
|
|
|
|
|
|
|
|
|
|
| 16-Oct-09 |
251 |
|
|
|
|
|
|
|
|
|
|
|
|
|
|
|
|
|
|
|
| 17-Oct-09 |
251 |
|
|
|
|
|
|
|
|
|
|
|
|
|
|
|
|
|
|
|
| 18-Oct-09 |
266 |
|
|
|
|
|
|
|
|
|
|
|
|
|
|
|
|
|
|
|
| 19-Oct-09 |
260 |
|
|
|
|
|
|
|
|
|
|
|
|
|
|
|
|
|
|
|
| 20-Oct-09 |
254 |
|
|
|
|
|
|
|
|
|
|
|
|
|
|
|
|
|
|
|
| 21-Oct-09 |
252 |
|
|
|
|
|
|
|
|
|
|
|
|
|
|
|
|
|
|
|
| 22-Oct-09 |
248 |
|
|
|
|
|
|
|
|
|
|
|
|
|
|
|
|
|
|
|
| 23-Oct-09 |
258 |
|
|
|
|
|
|
|
|
|
|
|
|
|
|
|
|
|
|
|
| 24-Oct-09 |
263 |
|
|
|
|
|
|
|
|
|
|
|
|
|
|
|
|
|
|
|
| 25-Oct-09 |
291 |
|
|
|
|
|
|
|
|
|
|
|
|
|
|
|
|
|
|
|
| 26-Oct-09 |
287 |
|
|
|
|
|
|
|
|
|
|
|
|
|
|
|
|
|
|
|
| 27-Oct-09 |
297 |
|
|
|
|
|
|
|
|
|
|
|
|
|
|
|
|
|
|
|
| 28-Oct-09 |
287 |
|
|
|
|
|
|
|
|
|
|
|
|
|
|
|
|
|
|
|
| 29-Oct-09 |
281 |
|
|
|
|
|
|
|
|
|
|
|
|
|
|
|
|
|
|
|
| 30-Oct-09 |
272 |
|
|
|
|
|
|
|
|
|
|
|
|
|
|
|
|
|
|
|
| 31-Oct-09 |
254 |
|
|
|
|
|
|
|
|
|
|
|
|
|
|
|
|
|
|
|
| 1-Nov-09 |
268 |
|
|
|
|
|
|
|
|
|
|
|
|
|
|
|
|
|
|
|
| 2-Nov-09 |
268 |
|
|
|
|
|
|
|
|
|
|
|
|
|
|
|
|
|
|
|
| 3-Nov-09 |
278 |
|
|
|
|
|
|
|
|
|
|
|
|
|
|
|
|
|
|
|
| 4-Nov-09 |
268 |
|
|
|
|
|
|
|
|
|
|
|
|
|
|
|
|
|
|
|
| 5-Nov-09 |
253 |
|
|
|
|
|
|
|
|
|
|
|
|
|
|
|
|
|
|
|
| 6-Nov-09 |
245 |
|
|
|
|
|
|
|
|
|
|
|
|
|
|
|
|
|
|
|
| 7-Nov-09 |
238 |
|
|
|
|
|
|
|
|
|
|
|
|
|
|
|
|
|
|
|
| 8-Nov-09 |
232 |
|
|
|
|
|
|
|
|
|
|
|
|
|
|
|
|
|
|
|
| 9-Nov-09 |
227 |
|
|
|
|
|
|
|
|
|
|
|
|
|
|
|
|
|
|
|
| 10-Nov-09 |
274 |
|
|
|
|
|
|
|
|
|
|
|
|
|
|
|
|
|
|
|
| 11-Nov-09 |
283 |
|
|
|
|
|
|
|
|
|
|
|
|
|
|
|
|
|
|
|
| 12-Nov-09 |
295 |
|
|
|
|
|
|
|
|
|
|
|
|
|
|
|
|
|
|
|
| 13-Nov-09 |
277 |
|
|
|
|
|
|
|
|
|
|
|
|
|
|
|
|
|
|
|
| 14-Nov-09 |
263 |
|
|
|
|
|
|
|
|
|
|
|
|
|
|
|
|
|
|
|
| 15-Nov-09 |
217 |
|
|
|
|
|
|
|
|
|
|
|
|
|
|
|
|
|
|
|
| 16-Nov-09 |
193 |
|
|
|
|
|
|
|
|
|
|
|
|
|
|
|
|
|
|
|
| 17-Nov-09 |
173 |
|
|
|
|
|
|
|
|
|
|
|
|
|
|
|
|
|
|
|
| 18-Nov-09 |
173 |
|
|
|
|
|
|
|
|
|
|
|
|
|
|
|
|
|
|
|
| 19-Nov-09 |
206 |
|
|
|
|
|
|
|
|
|
|
|
|
|
|
|
|
|
|
|
| 20-Nov-09 |
198 |
|
|
|
|
|
|
|
|
|
|
|
|
|
|
|
|
|
|
|
| 21-Nov-09 |
225 |
|
|
|
|
|
|
|
|
|
|
|
|
|
|
|
|
|
|
|
| 22-Nov-09 |
233 |
|
|
|
|
|
|
|
|
|
|
|
|
|
|
|
|
|
|
|
| 23-Nov-09 |
233 |
|
|
|
|
|
|
|
|
|
|
|
|
|
|
|
|
|
|
|
| 24-Nov-09 |
274 |
|
|
|
|
|
|
|
|
|
|
|
|
|
|
|
|
|
|
|
| 25-Nov-09 |
279 |
|
|
|
|
|
|
|
|
|
|
|
|
|
|
|
|
|
|
|
| 26-Nov-09 |
284 |
|
|
|
|
|
|
|
|
|
|
|
|
|
|
|
|
|
|
|
| 27-Nov-09 |
291 |
|
|
|
|
|
|
|
|
|
|
|
|
|
|
|
|
|
|
|
| 28-Nov-09 |
278 |
|
|
|
|
|
|
|
|
|
|
|
|
|
|
|
|
|
|
|
| 29-Nov-09 |
265 |
|
|
|
|
|
|
|
|
|
|
|
|
|
|
|
|
|
|
|
| 30-Nov-09 |
265 |
|
|
|
|
|
|
|
|
|
|
|
|
|
|
|
|
|
|
|
| 1-Dec-09 |
224 |
|
|
|
|
|
|
|
|
|
|
|
|
|
|
|
|
|
|
|
| 2-Dec-09 |
208 |
|
|
|
|
|
|
|
|
|
|
|
|
|
|
|
|
|
|
|
| 3-Dec-09 |
242 |
|
|
|
|
|
|
|
|
|
|
|
|
|
|
|
|
|
|
|
| 4-Dec-09 |
242 |
|
|
|
|
|
|
|
|
|
|
|
|
|
|
|
|
|
|
|
| 5-Dec-09 |
250 |
|
|
|
|
|
|
|
|
|
|
|
|
|
|
|
|
|
|
|
| 6-Dec-09 |
230 |
|
|
|
|
|
|
|
|
|
|
|
|
|
|
|
|
|
|
|
| 7-Dec-09 |
214 |
|
|
|
|
|
|
|
|
|
|
|
|
|
|
|
|
|
|
|
| 8-Dec-09 |
217 |
|
|
|
|
|
|
|
|
|
|
|
|
|
|
|
|
|
|
|
| 9-Dec-09 |
226 |
|
|
|
|
|
|
|
|
|
|
|
|
|
|
|
|
|
|
|
| 10-Dec-09 |
290 |
|
|
|
|
|
|
|
|
|
|
|
|
|
|
|
|
|
|
|
| 11-Dec-09 |
304 |
|
|
|
|
|
|
|
|
|
|
|
|
|
|
|
|
|
|
|
| 12-Dec-09 |
328 |
|
|
|
|
|
|
|
|
|
|
|
|
|
|
|
|
|
|
|
| 13-Dec-09 |
315 |
|
|
|
|
|
|
|
|
|
|
|
|
|
|
|
|
|
|
|
| 14-Dec-09 |
270 |
|
|
|
|
|
|
|
|
|
|
|
|
|
|
|
|
|
|
|
| 15-Dec-09 |
262 |
|
|
|
|
|
|
|
|
|
|
|
|
|
|
|
|
|
|
|
| 16-Dec-09 |
258 |
|
|
|
|
|
|
|
|
|
|
|
|
|
|
|
|
|
|
|
| 17-Dec-09 |
239 |
|
|
|
|
|
|
|
|
|
|
|
|
|
|
|
|
|
|
|
| 18-Dec-09 |
233 |
|
|
|
|
|
|
|
|
|
|
|
|
|
|
|
|
|
|
|
| 19-Dec-09 |
231 |
|
|
|
|
|
|
|
|
|
|
|
|
|
|
|
|
|
|
|
| 20-Dec-09 |
231 |
|
|
|
|
|
|
|
|
|
|
|
|
|
|
|
|
|
|
|
| 21-Dec-09 |
231 |
|
|
|
|
|
|
|
|
|
|
|
|
|
|
|
|
|
|
|
| 22-Dec-09 |
222 |
|
|
|
|
|
|
|
|
|
|
|
|
|
|
|
|
|
|
|
| 23-Dec-09 |
231 |
|
|
|
|
|
|
|
|
|
|
|
|
|
|
|
|
|
|
|
| 24-Dec-09 |
230 |
|
|
|
|
|
|
|
|
|
|
|
|
|
|
|
|
|
|
|
| 25-Dec-09 |
231 |
|
|
|
|
|
|
|
|
|
|
|
|
|
|
|
|
|
|
|
| 26-Dec-09 |
244 |
|
|
|
|
|
|
|
|
|
|
|
|
|
|
|
|
|
|
|
| 27-Dec-09 |
235 |
|
|
|
|
|
|
|
|
|
|
|
|
|
|
|
|
|
|
|
| 28-Dec-09 |
216 |
|
|
|
|
|
|
|
|
|
|
|
|
|
|
|
|
|
|
|
| 29-Dec-09 |
209 |
|
|
|
|
|
|
|
|
|
|
|
|
|
|
|
|
|
|
|
| 30-Dec-09 |
220 |
|
|
|
|
|
|
|
|
|
|
|
|
|
|
|
|
|
|
|
| 31-Dec-09 |
212 |
|
|
|
|
|
|
|
|
|
|
|
|
|
|
|
|
|
|
|
| 1-Jan-10 |
221 |
|
|
|
|
|
|
|
|
|
|
|
|
|
|
|
|
|
|
|
| 2-Jan-10 |
194 |
|
|
|
|
|
|
|
|
|
|
|
|
|
|
|
|
|
|
|
| 3-Jan-10 |
167 |
|
|
|
|
|
|
|
|
|
|
|
|
|
|
|
|
|
|
|
| 4-Jan-10 |
175 |
|
|
|
|
|
|
|
|
|
|
|
|
|
|
|
|
|
|
|
| 5-Jan-10 |
175 |
|
|
|
|
|
|
|
|
|
|
|
|
|
|
|
|
|
|
|
| 6-Jan-10 |
244 |
|
|
|
|
|
|
|
|
|
|
|
|
|
|
|
|
|
|
|
| 7-Jan-10 |
259 |
|
|
|
|
|
|
|
|
|
|
|
|
|
|
|
|
|
|
|
| 8-Jan-10 |
287 |
|
|
|
|
|
|
|
|
|
|
|
|
|
|
|
|
|
|
|
| 9-Jan-10 |
278 |
|
|
|
|
|
|
|
|
|
|
|
|
|
|
|
|
|
|
|
| 10-Jan-10 |
279 |
|
|
|
|
|
|
|
|
|
|
|
|
|
|
|
|
|
|
|
| 11-Jan-10 |
264 |
|
|
|
|
|
|
|
|
|
|
|
|
|
|
|
|
|
|
|
| 12-Jan-10 |
246 |
|
|
|
|
|
|
|
|
|
|
|
|
|
|
|
|
|
|
|
| 13-Jan-10 |
253 |
|
|
|
|
|
|
|
|
|
|
|
|
|
|
|
|
|
|
|
| 14-Jan-10 |
250 |
|
|
|
|
|
|
|
|
|
|
|
|
|
|
|
|
|
|
|
| 15-Jan-10 |
260 |
|
|
|
|
|
|
|
|
|
|
|
|
|
|
|
|
|
|
|
| 16-Jan-10 |
251 |
|
|
|
|
|
|
|
|
|
|
|
|
|
|
|
|
|
|
|
| 17-Jan-10 |
248 |
|
|
|
|
|
|
|
|
|
|
|
|
|
|
|
|
|
|
|
| 18-Jan-10 |
241 |
|
|
|
|
|
|
|
|
|
|
|
|
|
|
|
|
|
|
|
| 19-Jan-10 |
227 |
|
|
|
|
|
|
|
|
|
|
|
|
|
|
|
|
|
|
|
| 20-Jan-10 |
236 |
|
|
|
|
|
|
|
|
|
|
|
|
|
|
|
|
|
|
|
| 21-Jan-10 |
236 |
|
|
|
|
|
|
|
|
|
|
|
|
|
|
|
|
|
|
|
| 22-Jan-10 |
260 |
|
|
|
|
|
|
|
|
|
|
|
|
|
|
|
|
|
|
|
| 23-Jan-10 |
235 |
|
|
|
|
|
|
|
|
|
|
|
|
|
|
|
|
|
|
|
| 24-Jan-10 |
244 |
|
|
|
|
|
|
|
|
|
|
|
|
|
|
|
|
|
|
|
| 25-Jan-10 |
240 |
|
|
|
|
|
|
|
|
|
|
|
|
|
|
|
|
|
|
|
| 26-Jan-10 |
227 |
|
|
|
|
|
|
|
|
|
|
|
|
|
|
|
|
|
|
|
| 27-Jan-10 |
237 |
|
|
|
|
|
|
|
|
|
|
|
|
|
|
|
|
|
|
|
| 28-Jan-10 |
221 |
|
|
|
|
|
|
|
|
|
|
|
|
|
|
|
|
|
|
|
| 29-Jan-10 |
200 |
|
|
|
|
|
|
|
|
|
|
|
|
|
|
|
|
|
|
|
| 30-Jan-10 |
203 |
|
|
|
|
|
|
|
|
|
|
|
|
|
|
|
|
|
|
|
| 31-Jan-10 |
254 |
|
|
|
|
|
|
|
|
|
|
|
|
|
|
|
|
|
|
|
| 1-Feb-10 |
263 |
|
|
|
|
|
|
|
|
|
|
|
|
|
|
|
|
|
|
|
| 2-Feb-10 |
293 |
|
|
|
|
|
|
|
|
|
|
|
|
|
|
|
|
|
|
|
| 3-Feb-10 |
302 |
|
|
|
|
|
|
|
|
|
|
|
|
|
|
|
|
|
|
|
| 4-Feb-10 |
289 |
|
|
|
|
|
|
|
|
|
|
|
|
|
|
|
|
|
|
|
| 5-Feb-10 |
318 |
|
|
|
|
|
|
|
|
|
|
|
|
|
|
|
|
|
|
|
| 6-Feb-10 |
318 |
|
|
|
|
|
|
|
|
|
|
|
|
|
|
|
|
|
|
|
| 7-Feb-10 |
309 |
|
|
|
|
|
|
|
|
|
|
|
|
|
|
|
|
|
|
|
| 8-Feb-10 |
318 |
|
|
|
|
|
|
|
|
|
|
|
|
|
|
|
|
|
|
|
| 9-Feb-10 |
295 |
|
|
|
|
|
|
|
|
|
|
|
|
|
|
|
|
|
|
|
| 10-Feb-10 |
305 |
|
|
|
|
|
|
|
|
|
|
|
|
|
|
|
|
|
|
|
| 11-Feb-10 |
306 |
|
|
|
|
|
|
|
|
|
|
|
|
|
|
|
|
|
|
|
| 12-Feb-10 |
311 |
|
|
|
|
|
|
|
|
|
|
|
|
|
|
|
|
|
|
|
| 13-Feb-10 |
342 |
|
|
|
|
|
|
|
|
|
|
|
|
|
|
|
|
|
|
|
| 14-Feb-10 |
382 |
|
|
|
|
|
|
|
|
|
|
|
|
|
|
|
|
|
|
|
| 15-Feb-10 |
366 |
|
|
|
|
|
|
|
|
|
|
|
|
|
|
|
|
|
|
|
| 16-Feb-10 |
417 |
|
|
|
|
|
|
|
|
|
|
|
|
|
|
|
|
|
|
|
| 17-Feb-10 |
424 |
|
|
|
|
|
|
|
|
|
|
|
|
|
|
|
|
|
|
|
| 18-Feb-10 |
440 |
|
|
|
|
|
|
|
|
|
|
|
|
|
|
|
|
|
|
|
| 19-Feb-10 |
419 |
|
|
|
|
|
|
|
|
|
|
|
|
|
|
|
|
|
|
|
| 20-Feb-10 |
413 |
|
|
|
|
|
|
|
|
|
|
|
|
|
|
|
|
|
|
|
| 21-Feb-10 |
433 |
|
|
|
|
|
|
|
|
|
|
|
|
|
|
|
|
|
|
|
| 22-Feb-10 |
433 |
|
|
|
|
|
|
|
|
|
|
|
|
|
|
|
|
|
|
|
| 23-Feb-10 |
497 |
|
|
|
|
|
|
|
|
|
|
|
|
|
|
|
|
|
|
|
| 24-Feb-10 |
462 |
|
|
|
|
|
|
|
|
|
|
|
|
|
|
|
|
|
|
|
| 25-Feb-10 |
523 |
|
|
|
|
|
|
|
|
|
|
|
|
|
|
|
|
|
|
|
| 26-Feb-10 |
500 |
|
|
|
|
|
|
|
|
|
|
|
|
|
|
|
|
|
|
|
| 27-Feb-10 |
490 |
|
|
|
|
|
|
|
|
|
|
|
|
|
|
|
|
|
|
|
| 28-Feb-10 |
588 |
|
|
|
|
|
|
|
|
|
|
|
|
|
|
|
|
|
|
|
| 1-Mar-10 |
558 |
|
|
|
|
|
|
|
|
|
|
|
|
|
|
|
|
|
|
|
| 2-Mar-10 |
682 |
|
|
|
|
|
|
|
|
|
|
|
|
|
|
|
|
|
|
|
| 3-Mar-10 |
615 |
|
|
|
|
|
|
|
|
|
|
|
|
|
|
|
|
|
|
|
| 4-Mar-10 |
645 |
|
|
|
|
|
|
|
|
|
|
|
|
|
|
|
|
|
|
|
| 5-Mar-10 |
573 |
|
|
|
|
|
|
|
|
|
|
|
|
|
|
|
|
|
|
|
| 6-Mar-10 |
540 |
|
|
|
|
|
|
|
|
|
|
|
|
|
|
|
|
|
|
|
| 7-Mar-10 |
732 |
|
|
|
|
|
|
|
|
|
|
|
|
|
|
|
|
|
|
|
| 8-Mar-10 |
713 |
|
|
|
|
|
|
|
|
|
|
|
|
|
|
|
|
|
|
|
| 9-Mar-10 |
1244 |
|
|
|
|
|
|
|
|
|
|
|
|
|
|
|
|
|
|
|
| 10-Mar-10 |
1244 |
|
|
|
|
|
|
|
|
|
|
|
|
|
|
|
|
|
|
|
| 11-Mar-10 |
1561 |
|
|
|
|
|
|
|
|
|
|
|
|
|
|
|
|
|
|
|
| 12-Mar-10 |
1584 |
|
|
|
|
|
|
|
|
|
|
|
|
|
|
|
|
|
|
|
| 13-Mar-10 |
1730 |
|
|
|
|
|
|
|
|
|
|
|
|
|
|
|
|
|
|
|
| 14-Mar-10 |
1687 |
|
|
|
|
|
|
|
|
|
|
|
|
|
|
|
|
|
|
|
| 15-Mar-10 |
1680 |
|
|
|
|
|
|
|
|
|
|
|
|
|
|
|
|
|
|
|
| 16-Mar-10 |
1603 |
|
|
|
|
|
|
|
|
|
|
|
|
|
|
|
|
|
|
|
| 17-Mar-10 |
1478 |
|
|
|
|
|
|
|
|
|
|
|
|
|
|
|
|
|
|
|
| 18-Mar-10 |
1473 |
|
|
|
|
|
|
|
|
|
|
|
|
|
|
|
|
|
|
|
| 19-Mar-10 |
1466 |
|
|
|
|
|
|
|
|
|
|
|
|
|
|
|
|
|
|
|
| 20-Mar-10 |
1539 |
|
|
|
|
|
|
|
|
|
|
|
|
|
|
|
|
|
|
|
| 21-Mar-10 |
1612 |
|
|
|
|
|
|
|
|
|
|
|
|
|
|
|
|
|
|
|
| 22-Mar-10 |
1633 |
|
|
|
|
|
|
|
|
|
|
|
|
|
|
|
|
|
|
|
| 23-Mar-10 |
1661 |
|
|
|
|
|
|
|
|
|
|
|
|
|
|
|
|
|
|
|
| 24-Mar-10 |
1680 |
|
|
|
|
|
|
|
|
|
|
|
|
|
|
|
|
|
|
|
| 25-Mar-10 |
1552 |
|
|
|
|
|
|
|
|
|
|
|
|
|
|
|
|
|
|
|
| 26-Mar-10 |
1552 |
|
|
|
|
|
|
|
|
|
|
|
|
|
|
|
|
|
|
|
| 27-Mar-10 |
1618 |
|
|
|
|
|
|
|
|
|
|
|
|
|
|
|
|
|
|
|
| 28-Mar-10 |
1666 |
|
|
|
|
|
|
|
|
|
|
|
|
|
|
|
|
|
|
|
| 29-Mar-10 |
1691 |
|
|
|
|
|
|
|
|
|
|
|
|
|
|
|
|
|
|
|
| 30-Mar-10 |
1728 |
|
|
|
|
|
|
|
|
|
|
|
|
|
|
|
|
|
|
|
| 31-Mar-10 |
1746 |
|
|
|
|
|
|
|
|
|
|
|
|
|
|
|
|
|
|
|
| 1-Apr-10 |
1724 |
|
|
|
|
|
|
|
|
|
|
|
|
|
|
|
|
|
|
|
| 2-Apr-10 |
1765 |
|
|
|
|
|
|
|
|
|
|
|
|
|
|
|
|
|
|
|
| 3-Apr-10 |
1669 |
|
|
|
|
|
|
|
|
|
|
|
|
|
|
|
|
|
|
|
| 4-Apr-10 |
1645 |
|
|
|
|
|
|
|
|
|
|
|
|
|
|
|
|
|
|
|
| 5-Apr-10 |
1649 |
|
|
|
|
|
|
|
|
|
|
|
|
|
|
|
|
|
|
|
| 6-Apr-10 |
1676 |
|
|
|
|
|
|
|
|
|
|
|
|
|
|
|
|
|
|
|
| 7-Apr-10 |
1686 |
|
|
|
|
|
|
|
|
|
|
|
|
|
|
|
|
|
|
|
| 8-Apr-10 |
1450 |
|
|
|
|
|
|
|
|
|
|
|
|
|
|
|
|
|
|
|
| 9-Apr-10 |
1324 |
|
|
|
|
|
|
|
|
|
|
|
|
|
|
|
|
|
|
|
| 10-Apr-10 |
1229 |
|
|
|
|
|
|
|
|
|
|
|
|
|
|
|
|
|
|
|
| 11-Apr-10 |
1229 |
|
|
|
|
|
|
|
|
|
|
|
|
|
|
|
|
|
|
|
| 12-Apr-10 |
1517 |
|
|
|
|
|
|
|
|
|
|
|
|
|
|
|
|
|
|
|
| 13-Apr-10 |
1588 |
|
|
|
|
|
|
|
|
|
|
|
|
|
|
|
|
|
|
|
| 14-Apr-10 |
1653 |
|
|
|
|
|
|
|
|
|
|
|
|
|
|
|
|
|
|
|
| 15-Apr-10 |
1577 |
|
|
|
|
|
|
|
|
|
|
|
|
|
|
|
|
|
|
|
| 16-Apr-10 |
1607 |
|
|
|
|
|
|
|
|
|
|
|
|
|
|
|
|
|
|
|
| 17-Apr-10 |
1583 |
|
|
|
|
|
|
|
|
|
|
|
|
|
|
|
|
|
|
|
| 18-Apr-10 |
1504 |
|
|
|
|
|
|
|
|
|
|
|
|
|
|
|
|
|
|
|
| 19-Apr-10 |
1615 |
|
|
|
|
|
|
|
|
|
|
|
|
|
|
|
|
|
|
|
| 20-Apr-10 |
1575 |
|
|
|
|
|
|
|
|
|
|
|
|
|
|
|
|
|
|
|
| 21-Apr-10 |
1610 |
|
|
|
|
|
|
|
|
|
|
|
|
|
|
|
|
|
|
|
| 22-Apr-10 |
1489 |
|
|
|
|
|
|
|
|
|
|
|
|
|
|
|
|
|
|
|
| 23-Apr-10 |
1460 |
|
|
|
|
|
|
|
|
|
|
|
|
|
|
|
|
|
|
|
| 24-Apr-10 |
1569 |
|
|
|
|
|
|
|
|
|
|
|
|
|
|
|
|
|
|
|
| 25-Apr-10 |
1469 |
|
|
|
|
|
|
|
|
|
|
|
|
|
|
|
|
|
|
|
| 26-Apr-10 |
1651 |
|
|
|
|
|
|
|
|
|
|
|
|
|
|
|
|
|
|
|
| 27-Apr-10 |
1651 |
|
|
|
|
|
|
|
|
|
|
|
|
|
|
|
|
|
|
|
| 28-Apr-10 |
1425 |
|
|
|
|
|
|
|
|
|
|
|
|
|
|
|
|
|
|
|
| 29-Apr-10 |
1527 |
|
|
|
|
|
|
|
|
|
|
|
|
|
|
|
|
|
|
|
| 30-Apr-10 |
1661 |
|
|
|
|
|
|
|
|
|
|
|
|
|
|
|
|
|
|
|
| 1-May-10 |
1693 |
|
|
|
|
|
|
|
|
|
|
|
|
|
|
|
|
|
|
|
| 2-May-10 |
1800 |
|
|
|
|
|
|
|
|
|
|
|
|
|
|
|
|
|
|
|
| 3-May-10 |
1770 |
|
|
|
|
|
|
|
|
|
|
|
|
|
|
|
|
|
|
|
| 4-May-10 |
1712 |
|
|
|
|
|
|
|
|
|
|
|
|
|
|
|
|
|
|
|
| 5-May-10 |
1767 |
|
|
|
|
|
|
|
|
|
|
|
|
|
|
|
|
|
|
|
| 6-May-10 |
1651 |
|
|
|
|
|
|
|
|
|
|
|
|
|
|
|
|
|
|
|
| 7-May-10 |
1699 |
|
|
|
|
|
|
|
|
|
|
|
|
|
|
|
|
|
|
|
| 8-May-10 |
1694 |
|
|
|
|
|
|
|
|
|
|
|
|
|
|
|
|
|
|
|
| 9-May-10 |
1626 |
|
|
|
|
|
|
|
|
|
|
|
|
|
|
|
|
|
|
|
| 10-May-10 |
1678 |
|
|
|
|
|
|
|
|
|
|
|
|
|
|
|
|
|
|
|
| 11-May-10 |
1631 |
|
|
|
|
|
|
|
|
|
|
|
|
|
|
|
|
|
|
|
| 12-May-10 |
1481 |
|
|
|
|
|
|
|
|
|
|
|
|
|
|
|
|
|
|
|
| 13-May-10 |
1481 |
|
|
|
|
|
|
|
|
|
|
|
|
|
|
|
|
|
|
|
| 14-May-10 |
1500 |
|
|
|
|
|
|
|
|
|
|
|
|
|
|
|
|
|
|
|
| 15-May-10 |
1549 |
|
|
|
|
|
|
|
|
|
|
|
|
|
|
|
|
|
|
|
| 16-May-10 |
1573 |
|
|
|
|
|
|
|
|
|
|
|
|
|
|
|
|
|
|
|
| 17-May-10 |
1530 |
|
|
|
|
|
|
|
|
|
|
|
|
|
|
|
|
|
|
|
| 18-May-10 |
1501 |
|
|
|
|
|
|
|
|
|
|
|
|
|
|
|
|
|
|
|
| 19-May-10 |
1486 |
|
|
|
|
|
|
|
|
|
|
|
|
|
|
|
|
|
|
|
| 20-May-10 |
1502 |
|
|
|
|
|
|
|
|
|
|
|
|
|
|
|
|
|
|
|
| 21-May-10 |
1461 |
|
|
|
|
|
|
|
|
|
|
|
|
|
|
|
|
|
|
|
| 22-May-10 |
1289 |
|
|
|
|
|
|
|
|
|
|
|
|
|
|
|
|
|
|
|
| 23-May-10 |
1202 |
|
|
|
|
|
|
|
|
|
|
|
|
|
|
|
|
|
|
|
| 24-May-10 |
1241 |
|
|
|
|
|
|
|
|
|
|
|
|
|
|
|
|
|
|
|
| 25-May-10 |
1212 |
|
|
|
|
|
|
|
|
|
|
|
|
|
|
|
|
|
|
|
| 26-May-10 |
1365 |
|
|
|
|
|
|
|
|
|
|
|
|
|
|
|
|
|
|
|
| 27-May-10 |
1378 |
|
|
|
|
|
|
|
|
|
|
|
|
|
|
|
|
|
|
|
| 28-May-10 |
1355 |
|
|
|
|
|
|
|
|
|
|
|
|
|
|
|
|
|
|
|
| 29-May-10 |
1355 |
|
|
|
|
|
|
|
|
|
|
|
|
|
|
|
|
|
|
|
| 30-May-10 |
1194 |
|
|
|
|
|
|
|
|
|
|
|
|
|
|
|
|
|
|
|
| 31-May-10 |
1139 |
|
|
|
|
|
|
|
|
|
|
|
|
|
|
|
|
|
|
|
| 1-Jun-10 |
1055 |
|
|
|
|
|
|
|
|
|
|
|
|
|
|
|
|
|
|
|
| 2-Jun-10 |
1010 |
|
|
|
|
|
|
|
|
|
|
|
|
|
|
|
|
|
|
|
| 3-Jun-10 |
988 |
|
|
|
|
|
|
|
|
|
|
|
|
|
|
|
|
|
|
|
| 4-Jun-10 |
929 |
|
|
|
|
|
|
|
|
|
|
|
|
|
|
|
|
|
|
|
| 5-Jun-10 |
873 |
|
|
|
|
|
|
|
|
|
|
|
|
|
|
|
|
|
|
|
| 6-Jun-10 |
847 |
|
|
|
|
|
|
|
|
|
|
|
|
|
|
|
|
|
|
|
| 7-Jun-10 |
777 |
|
|
|
|
|
|
|
|
|
|
|
|
|
|
|
|
|
|
|
| 8-Jun-10 |
752 |
|
|
|
|
|
|
|
|
|
|
|
|
|
|
|
|
|
|
|
| 9-Jun-10 |
751 |
|
|
|
|
|
|
|
|
|
|
|
|
|
|
|
|
|
|
|
| 10-Jun-10 |
722 |
|
|
|
|
|
|
|
|
|
|
|
|
|
|
|
|
|
|
|
| 11-Jun-10 |
729 |
|
|
|
|
|
|
|
|
|
|
|
|
|
|
|
|
|
|
|
| 12-Jun-10 |
699 |
|
|
|
|
|
|
|
|
|
|
|
|
|
|
|
|
|
|
|
| 13-Jun-10 |
678 |
|
|
|
|
|
|
|
|
|
|
|
|
|
|
|
|
|
|
|
| 14-Jun-10 |
678 |
|
|
|
|
|
|
|
|
|
|
|
|
|
|
|
|
|
|
|
| 15-Jun-10 |
715 |
|
|
|
|
|
|
|
|
|
|
|
|
|
|
|
|
|
|
|
| 16-Jun-10 |
649 |
|
|
|
|
|
|
|
|
|
|
|
|
|
|
|
|
|
|
|
| 17-Jun-10 |
606 |
|
|
|
|
|
|
|
|
|
|
|
|
|
|
|
|
|
|
|
| 18-Jun-10 |
597 |
|
|
|
|
|
|
|
|
|
|
|
|
|
|
|
|
|
|
|
| 19-Jun-10 |
557 |
|
|
|
|
|
|
|
|
|
|
|
|
|
|
|
|
|
|
|
| 20-Jun-10 |
573 |
|
|
|
|
|
|
|
|
|
|
|
|
|
|
|
|
|
|
|
| 21-Jun-10 |
573 |
|
|
|
|
|
|
|
|
|
|
|
|
|
|
|
|
|
|
|
| 22-Jun-10 |
585 |
|
|
|
|
|
|
|
|
|
|
|
|
|
|
|
|
|
|
|
| 23-Jun-10 |
524 |
|
|
|
|
|
|
|
|
|
|
|
|
|
|
|
|
|
|
|
| 24-Jun-10 |
499 |
|
|
|
|
|
|
|
|
|
|
|
|
|
|
|
|
|
|
|
| 25-Jun-10 |
506 |
|
|
|
|
|
|
|
|
|
|
|
|
|
|
|
|
|
|
|
| 26-Jun-10 |
477 |
|
|
|
|
|
|
|
|
|
|
|
|
|
|
|
|
|
|
|
| 27-Jun-10 |
494 |
|
|
|
|
|
|
|
|
|
|
|
|
|
|
|
|
|
|
|
| 28-Jun-10 |
490 |
|
|
|
|
|
|
|
|
|
|
|
|
|
|
|
|
|
|
|
| 29-Jun-10 |
485 |
|
|
|
|
|
|
|
|
|
|
|
|
|
|
|
|
|
|
|
| 30-Jun-10 |
485 |
|
|
|
|
|
|
|
|
|
|
|
|
|
|
|
|
|
|
|
| 1-Jul-10 |
505 |
|
|
|
|
|
|
|
|
|
|
|
|
|
|
|
|
|
|
|
| 2-Jul-10 |
486 |
|
|
|
|
|
|
|
|
|
|
|
|
|
|
|
|
|
|
|
| 3-Jul-10 |
505 |
|
|
|
|
|
|
|
|
|
|
|
|
|
|
|
|
|
|
|
| 4-Jul-10 |
488 |
|
|
|
|
|
|
|
|
|
|
|
|
|
|
|
|
|
|
|
| 5-Jul-10 |
486 |
|
|
|
|
|
|
|
|
|
|
|
|
|
|
|
|
|
|
|
| 6-Jul-10 |
467 |
|
|
|
|
|
|
|
|
|
|
|
|
|
|
|
|
|
|
|
| 7-Jul-10 |
415 |
|
|
|
|
|
|
|
|
|
|
|
|
|
|
|
|
|
|
|
| 8-Jul-10 |
417 |
|
|
|
|
|
|
|
|
|
|
|
|
|
|
|
|
|
|
|
| 9-Jul-10 |
415 |
|
|
|
|
|
|
|
|
|
|
|
|
|
|
|
|
|
|
|
| 10-Jul-10 |
441 |
|
|
|
|
|
|
|
|
|
|
|
|
|
|
|
|
|
|
|
| 11-Jul-10 |
430 |
|
|
|
|
|
|
|
|
|
|
|
|
|
|
|
|
|
|
|
| 12-Jul-10 |
427 |
|
|
|
|
|
|
|
|
|
|
|
|
|
|
|
|
|
|
|
| 13-Jul-10 |
411 |
|
|
|
|
|
|
|
|
|
|
|
|
|
|
|
|
|
|
|
| 14-Jul-10 |
380 |
|
|
|
|
|
|
|
|
|
|
|
|
|
|
|
|
|
|
|
| 15-Jul-10 |
385 |
|
|
|
|
|
|
|
|
|
|
|
|
|
|
|
|
|
|
|
| 16-Jul-10 |
385 |
|
|
|
|
|
|
|
|
|
|
|
|
|
|
|
|
|
|
|
| 17-Jul-10 |
418 |
|
|
|
|
|
|
|
|
|
|
|
|
|
|
|
|
|
|
|
| 18-Jul-10 |
395 |
|
|
|
|
|
|
|
|
|
|
|
|
|
|
|
|
|
|
|
| 19-Jul-10 |
407 |
|
|
|
|
|
|
|
|
|
|
|
|
|
|
|
|
|
|
|
| 20-Jul-10 |
387 |
|
|
|
|
|
|
|
|
|
|
|
|
|
|
|
|
|
|
|
| 21-Jul-10 |
373 |
|
|
|
|
|
|
|
|
|
|
|
|
|
|
|
|
|
|
|
| 22-Jul-10 |
384 |
|
|
|
|
|
|
|
|
|
|
|
|
|
|
|
|
|
|
|
| 23-Jul-10 |
351 |
|
|
|
|
|
|
|
|
|
|
|
|
|
|
|
|
|
|
|
| 24-Jul-10 |
357 |
|
|
|
|
|
|
|
|
|
|
|
|
|
|
|
|
|
|
|
| 25-Jul-10 |
343 |
|
|
|
|
|
|
|
|
|
|
|
|
|
|
|
|
|
|
|
| 26-Jul-10 |
344 |
|
|
|
|
|
|
|
|
|
|
|
|
|
|
|
|
|
|
|
| 27-Jul-10 |
344 |
|
|
|
|
|
|
|
|
|
|
|
|
|
|
|
|
|
|
|
| 28-Jul-10 |
347 |
|
|
|
|
|
|
|
|
|
|
|
|
|
|
|
|
|
|
|
| 29-Jul-10 |
348 |
|
|
|
|
|
|
|
|
|
|
|
|
|
|
|
|
|
|
|
| 30-Jul-10 |
331 |
|
|
|
|
|
|
|
|
|
|
|
|
|
|
|
|
|
|
|
| 31-Jul-10 |
312 |
|
|
|
|
|
|
|
|
|
|
|
|
|
|
|
|
|
|
|
| 1-Aug-10 |
312 |
|
|
|
|
|
|
|
|
|
|
|
|
|
|
|
|
|
|
|
| 2-Aug-10 |
318 |
|
|
|
|
|
|
|
|
|
|
|
|
|
|
|
|
|
|
|
| 3-Aug-10 |
335 |
|
|
|
|
|
|
|
|
|
|
|
|
|
|
|
|
|
|
|
| 4-Aug-10 |
366 |
|
|
|
|
|
|
|
|
|
|
|
|
|
|
|
|
|
|
|
| 5-Aug-10 |
363 |
|
|
|
|
|
|
|
|
|
|
|
|
|
|
|
|
|
|
|
| 6-Aug-10 |
374 |
|
|
|
|
|
|
|
|
|
|
|
|
|
|
|
|
|
|
|
| 7-Aug-10 |
358 |
|
|
|
|
|
|
|
|
|
|
|
|
|
|
|
|
|
|
|
| 8-Aug-10 |
338 |
|
|
|
|
|
|
|
|
|
|
|
|
|
|
|
|
|
|
|
| 9-Aug-10 |
330 |
|
|
|
|
|
|
|
|
|
|
|
|
|
|
|
|
|
|
|
| 10-Aug-10 |
317 |
|
|
|
|
|
|
|
|
|
|
|
|
|
|
|
|
|
|
|
| 11-Aug-10 |
314 |
|
|
|
|
|
|
|
|
|
|
|
|
|
|
|
|
|
|
|
| 12-Aug-10 |
307 |
|
|
|
|
|
|
|
|
|
|
|
|
|
|
|
|
|
|
|
| 13-Aug-10 |
298 |
|
|
|
|
|
|
|
|
|
|
|
|
|
|
|
|
|
|
|
| 14-Aug-10 |
303 |
|
|
|
|
|
|
|
|
|
|
|
|
|
|
|
|
|
|
|
| 15-Aug-10 |
297 |
|
|
|
|
|
|
|
|
|
|
|
|
|
|
|
|
|
|
|
| 16-Aug-10 |
308 |
|
|
|
|
|
|
|
|
|
|
|
|
|
|
|
|
|
|
|
| 17-Aug-10 |
308 |
|
|
|
|
|
|
|
|
|
|
|
|
|
|
|
|
|
|
|
| 18-Aug-10 |
308 |
|
|
|
|
|
|
|
|
|
|
|
|
|
|
|
|
|
|
|
| 19-Aug-10 |
315 |
|
|
|
|
|
|
|
|
|
|
|
|
|
|
|
|
|
|
|
| 20-Aug-10 |
316 |
|
|
|
|
|
|
|
|
|
|
|
|
|
|
|
|
|
|
|
| 21-Aug-10 |
310 |
|
|
|
|
|
|
|
|
|
|
|
|
|
|
|
|
|
|
|
| 22-Aug-10 |
312 |
|
|
|
|
|
|
|
|
|
|
|
|
|
|
|
|
|
|
|
| 23-Aug-10 |
289 |
|
|
|
|
|
|
|
|
|
|
|
|
|
|
|
|
|
|
|
| 24-Aug-10 |
277 |
|
|
|
|
|
|
|
|
|
|
|
|
|
|
|
|
|
|
|
| 25-Aug-10 |
266 |
|
|
|
|
|
|
|
|
|
|
|
|
|
|
|
|
|
|
|
| 26-Aug-10 |
280 |
|
|
|
|
|
|
|
|
|
|
|
|
|
|
|
|
|
|
|
| 27-Aug-10 |
290 |
|
|
|
|
|
|
|
|
|
|
|
|
|
|
|
|
|
|
|
| 28-Aug-10 |
291 |
|
|
|
|
|
|
|
|
|
|
|
|
|
|
|
|
|
|
|
| 29-Aug-10 |
297 |
|
|
|
|
|
|
|
|
|
|
|
|
|
|
|
|
|
|
|
| 30-Aug-10 |
284 |
|
|
|
|
|
|
|
|
|
|
|
|
|
|
|
|
|
|
|
| 31-Aug-10 |
281 |
|
|
|
|
|
|
|
|
|
|
|
|
|
|
|
|
|
|
|
| 1-Sep-10 |
264 |
|
|
|
|
|
|
|
|
|
|
|
|
|
|
|
|
|
|
|
| 2-Sep-10 |
264 |
|
|
|
|
|
|
|
|
|
|
|
|
|
|
|
|
|
|
|
| 3-Sep-10 |
289 |
|
|
|
|
|
|
|
|
|
|
|
|
|
|
|
|
|
|
|
| 4-Sep-10 |
286 |
|
|
|
|
|
|
|
|
|
|
|
|
|
|
|
|
|
|
|
| 5-Sep-10 |
309 |
|
|
|
|
|
|
|
|
|
|
|
|
|
|
|
|
|
|
|
| 6-Sep-10 |
294 |
|
|
|
|
|
|
|
|
|
|
|
|
|
|
|
|
|
|
|
| 7-Sep-10 |
285 |
|
|
|
|
|
|
|
|
|
|
|
|
|
|
|
|
|
|
|
| 8-Sep-10 |
292 |
|
|
|
|
|
|
|
|
|
|
|
|
|
|
|
|
|
|
|
| 9-Sep-10 |
277 |
|
|
|
|
|
|
|
|
|
|
|
|
|
|
|
|
|
|
|
| 10-Sep-10 |
279 |
|
|
|
|
|
|
|
|
|
|
|
|
|
|
|
|
|
|
|
| 11-Sep-10 |
272 |
|
|
|
|
|
|
|
|
|
|
|
|
|
|
|
|
|
|
|
| 12-Sep-10 |
242 |
|
|
|
|
|
|
|
|
|
|
|
|
|
|
|
|
|
|
|
| 13-Sep-10 |
252 |
|
|
|
|
|
|
|
|
|
|
|
|
|
|
|
|
|
|
|
| 14-Sep-10 |
250 |
|
|
|
|
|
|
|
|
|
|
|
|
|
|
|
|
|
|
|
| 15-Sep-10 |
254 |
|
|
|
|
|
|
|
|
|
|
|
|
|
|
|
|
|
|
|
| 16-Sep-10 |
274 |
|
|
|
|
|
|
|
|
|
|
|
|
|
|
|
|
|
|
|
| 17-Sep-10 |
278 |
|
|
|
|
|
|
|
|
|
|
|
|
|
|
|
|
|
|
|
| 18-Sep-10 |
278 |
|
|
|
|
|
|
|
|
|
|
|
|
|
|
|
|
|
|
|
| 19-Sep-10 |
308 |
|
|
|
|
|
|
|
|
|
|
|
|
|
|
|
|
|
|
|
| 20-Sep-10 |
313 |
|
|
|
|
|
|
|
|
|
|
|
|
|
|
|
|
|
|
|
| 21-Sep-10 |
321 |
|
|
|
|
|
|
|
|
|
|
|
|
|
|
|
|
|
|
|
| 22-Sep-10 |
315 |
|
|
|
|
|
|
|
|
|
|
|
|
|
|
|
|
|
|
|
| 23-Sep-10 |
312 |
|
|
|
|
|
|
|
|
|
|
|
|
|
|
|
|
|
|
|
| 24-Sep-10 |
295 |
|
|
|
|
|
|
|
|
|
|
|
|
|
|
|
|
|
|
|
| 25-Sep-10 |
287 |
|
|
|
|
|
|
|
|
|
|
|
|
|
|
|
|
|
|
|
| 26-Sep-10 |
270 |
|
|
|
|
|
|
|
|
|
|
|
|
|
|
|
|
|
|
|
| 27-Sep-10 |
267 |
|
|
|
|
|
|
|
|
|
|
|
|
|
|
|
|
|
|
|
| 28-Sep-10 |
280 |
|
|
|
|
|
|
|
|
|
|
|
|
|
|
|
|
|
|
|
| 29-Sep-10 |
274 |
|
|
|
|
|
|
|
|
|
|
|
|
|
|
|
|
|
|
|
| 30-Sep-10 |
277 |
|
|
|
|
|
|
|
|
|
|
|
|
|
|
|
|
|
|
|
| 1-Oct-10 |
282 |
|
|
|
|
|
|
|
|
|
|
|
|
|
|
|
|
|
|
|
| 2-Oct-10 |
267 |
|
|
|
|
|
|
|
|
|
|
|
|
|
|
|
|
|
|
|
| 3-Oct-10 |
285 |
|
|
|
|
|
|
|
|
|
|
|
|
|
|
|
|
|
|
|
| 4-Oct-10 |
285 |
|
|
|
|
|
|
|
|
|
|
|
|
|
|
|
|
|
|
|
| 5-Oct-10 |
307 |
|
|
|
|
|
|
|
|
|
|
|
|
|
|
|
|
|
|
|
| 6-Oct-10 |
306 |
|
|
|
|
|
|
|
|
|
|
|
|
|
|
|
|
|
|
|
| 7-Oct-10 |
313 |
|
|
|
|
|
|
|
|
|
|
|
|
|
|
|
|
|
|
|
| 8-Oct-10 |
292 |
|
|
|
|
|
|
|
|
|
|
|
|
|
|
|
|
|
|
|
| 9-Oct-10 |
283 |
|
|
|
|
|
|
|
|
|
|
|
|
|
|
|
|
|
|
|
| 10-Oct-10 |
267 |
|
|
|
|
|
|
|
|
|
|
|
|
|
|
|
|
|
|
|
| 11-Oct-10 |
242 |
|
|
|
|
|
|
|
|
|
|
|
|
|
|
|
|
|
|
|
| 12-Oct-10 |
244 |
|
|
|
|
|
|
|
|
|
|
|
|
|
|
|
|
|
|
|
| 13-Oct-10 |
257 |
|
|
|
|
|
|
|
|
|
|
|
|
|
|
|
|
|
|
|
| 14-Oct-10 |
247 |
|
|
|
|
|
|
|
|
|
|
|
|
|
|
|
|
|
|
|
| 15-Oct-10 |
260 |
|
|
|
|
|
|
|
|
|
|
|
|
|
|
|
|
|
|
|
| 16-Oct-10 |
269 |
|
|
|
|
|
|
|
|
|
|
|
|
|
|
|
|
|
|
|
| 17-Oct-10 |
268 |
|
|
|
|
|
|
|
|
|
|
|
|
|
|
|
|
|
|
|
| 18-Oct-10 |
290 |
|
|
|
|
|
|
|
|
|
|
|
|
|
|
|
|
|
|
|
| 19-Oct-10 |
285 |
|
|
|
|
|
|
|
|
|
|
|
|
|
|
|
|
|
|
|
| 20-Oct-10 |
285 |
|
|
|
|
|
|
|
|
|
|
|
|
|
|
|
|
|
|
|
| 21-Oct-10 |
288 |
|
|
|
|
|
|
|
|
|
|
|
|
|
|
|
|
|
|
|
| 22-Oct-10 |
288 |
|
|
|
|
|
|
|
|
|
|
|
|
|
|
|
|
|
|
|
| 23-Oct-10 |
|
|
|
|
|
|
|
|
|
|
|
|
|
|
|
|
|
|
|
|
| 24-Oct-10 |
245 |
|
|
|
|
|
|
|
|
|
|
|
|
|
|
|
|
|
|
|
| 25-Oct-10 |
245 |
|
|
|
|
|
|
|
|
|
|
|
|
|
|
|
|
|
|
|
| 26-Oct-10 |
244 |
|
|
|
|
|
|
|
|
|
|
|
|
|
|
|
|
|
|
|
| 27-Oct-10 |
244 |
|
|
|
|
|
|
|
|
|
|
|
|
|
|
|
|
|
|
|
| 28-Oct-10 |
257 |
|
|
|
|
|
|
|
|
|
|
|
|
|
|
|
|
|
|
|
| 29-Oct-10 |
257 |
|
|
|
|
|
|
|
|
|
|
|
|
|
|
|
|
|
|
|
| 30-Oct-10 |
198 |
|
|
|
|
|
|
|
|
|
|
|
|
|
|
|
|
|
|
|
| 31-Oct-10 |
210 |
|
|
|
|
|
|
|
|
|
|
|
|
|
|
|
|
|
|
|
| 1-Nov-10 |
183 |
|
|
|
|
|
|
|
|
|
|
|
|
|
|
|
|
|
|
|
| 2-Nov-10 |
189 |
|
|
|
|
|
|
|
|
|
|
|
|
|
|
|
|
|
|
|
| 3-Nov-10 |
200 |
|
|
|
|
|
|
|
|
|
|
|
|
|
|
|
|
|
|
|
| 4-Nov-10 |
215 |
|
|
|
|
|
|
|
|
|
|
|
|
|
|
|
|
|
|
|
| 5-Nov-10 |
215 |
|
|
|
|
|
|
|
|
|
|
|
|
|
|
|
|
|
|
|
| 6-Nov-10 |
226 |
|
|
|
|
|
|
|
|
|
|
|
|
|
|
|
|
|
|
|
| 7-Nov-10 |
241 |
|
|
|
|
|
|
|
|
|
|
|
|
|
|
|
|
|
|
|
| 8-Nov-10 |
219 |
|
|
|
|
|
|
|
|
|
|
|
|
|
|
|
|
|
|
|
| 9-Nov-10 |
280 |
|
|
|
|
|
|
|
|
|
|
|
|
|
|
|
|
|
|
|
| 10-Nov-10 |
304 |
|
|
|
|
|
|
|
|
|
|
|
|
|
|
|
|
|
|
|
| 11-Nov-10 |
307 |
|
|
|
|
|
|
|
|
|
|
|
|
|
|
|
|
|
|
|
| 12-Nov-10 |
307 |
|
|
|
|
|
|
|
|
|
|
|
|
|
|
|
|
|
|
|
| 13-Nov-10 |
203 |
|
|
|
|
|
|
|
|
|
|
|
|
|
|
|
|
|
|
|
| 14-Nov-10 |
203 |
|
|
|
|
|
|
|
|
|
|
|
|
|
|
|
|
|
|
|
| 15-Nov-10 |
255 |
|
|
|
|
|
|
|
|
|
|
|
|
|
|
|
|
|
|
|
| 16-Nov-10 |
280 |
|
|
|
|
|
|
|
|
|
|
|
|
|
|
|
|
|
|
|
| 17-Nov-10 |
329 |
|
|
|
|
|
|
|
|
|
|
|
|
|
|
|
|
|
|
|
| 18-Nov-10 |
309 |
|
|
|
|
|
|
|
|
|
|
|
|
|
|
|
|
|
|
|
| 19-Nov-10 |
301 |
|
|
|
|
|
|
|
|
|
|
|
|
|
|
|
|
|
|
|
| 20-Nov-10 |
227 |
|
|
|
|
|
|
|
|
|
|
|
|
|
|
|
|
|
|
|
| 21-Nov-10 |
227 |
|
|
|
|
|
|
|
|
|
|
|
|
|
|
|
|
|
|
|
| 22-Nov-10 |
243 |
|
|
|
|
|
|
|
|
|
|
|
|
|
|
|
|
|
|
|
| 23-Nov-10 |
251 |
|
|
|
|
|
|
|
|
|
|
|
|
|
|
|
|
|
|
|
| 24-Nov-10 |
284 |
|
|
|
|
|
|
|
|
|
|
|
|
|
|
|
|
|
|
|
| 25-Nov-10 |
266 |
|
|
|
|
|
|
|
|
|
|
|
|
|
|
|
|
|
|
|
| 26-Nov-10 |
250 |
|
|
|
|
|
|
|
|
|
|
|
|
|
|
|
|
|
|
|
| 27-Nov-10 |
243 |
|
|
|
|
|
|
|
|
|
|
|
|
|
|
|
|
|
|
|
| 28-Nov-10 |
243 |
|
|
|
|
|
|
|
|
|
|
|
|
|
|
|
|
|
|
|
| 29-Nov-10 |
205 |
|
|
|
|
|
|
|
|
|
|
|
|
|
|
|
|
|
|
|
| 30-Nov-10 |
205 |
|
|
|
|
|
|
|
|
|
|
|
|
|
|
|
|
|
|
|
| 1-Dec-10 |
198 |
|
|
|
|
|
|
|
|
|
|
|
|
|
|
|
|
|
|
|
| 2-Dec-10 |
222 |
|
|
|
|
|
|
|
|
|
|
|
|
|
|
|
|
|
|
|
| 3-Dec-10 |
254 |
|
|
|
|
|
|
|
|
|
|
|
|
|
|
|
|
|
|
|
| 4-Dec-10 |
216 |
|
|
|
|
|
|
|
|
|
|
|
|
|
|
|
|
|
|
|
| 5-Dec-10 |
207 |
|
|
|
|
|
|
|
|
|
|
|
|
|
|
|
|
|
|
|
| 6-Dec-10 |
201 |
|
|
|
|
|
|
|
|
|
|
|
|
|
|
|
|
|
|
|
| 7-Dec-10 |
201 |
|
|
|
|
|
|
|
|
|
|
|
|
|
|
|
|
|
|
|
| 8-Dec-10 |
231 |
|
|
|
|
|
|
|
|
|
|
|
|
|
|
|
|
|
|
|
| 9-Dec-10 |
232 |
|
|
|
|
|
|
|
|
|
|
|
|
|
|
|
|
|
|
|
| 10-Dec-10 |
219 |
|
|
|
|
|
|
|
|
|
|
|
|
|
|
|
|
|
|
|
| 11-Dec-10 |
229 |
|
|
|
|
|
|
|
|
|
|
|
|
|
|
|
|
|
|
|
| 12-Dec-10 |
241 |
|
|
|
|
|
|
|
|
|
|
|
|
|
|
|
|
|
|
|
| 13-Dec-10 |
241 |
|
|
|
|
|
|
|
|
|
|
|
|
|
|
|
|
|
|
|
| 14-Dec-10 |
241 |
|
|
|
|
|
|
|
|
|
|
|
|
|
|
|
|
|
|
|
| 15-Dec-10 |
271 |
|
|
|
|
|
|
|
|
|
|
|
|
|
|
|
|
|
|
|
| 16-Dec-10 |
271 |
|
|
|
|
|
|
|
|
|
|
|
|
|
|
|
|
|
|
|
| 17-Dec-10 |
280 |
|
|
|
|
|
|
|
|
|
|
|
|
|
|
|
|
|
|
|
| 18-Dec-10 |
272 |
|
|
|
|
|
|
|
|
|
|
|
|
|
|
|
|
|
|
|
| 19-Dec-10 |
253 |
|
|
|
|
|
|
|
|
|
|
|
|
|
|
|
|
|
|
|
| 20-Dec-10 |
248 |
|
|
|
|
|
|
|
|
|
|
|
|
|
|
|
|
|
|
|
| 21-Dec-10 |
247 |
|
|
|
|
|
|
|
|
|
|
|
|
|
|
|
|
|
|
|
| 22-Dec-10 |
249 |
|
|
|
|
|
|
|
|
|
|
|
|
|
|
|
|
|
|
|
| 23-Dec-10 |
249 |
|
|
|
|
|
|
|
|
|
|
|
|
|
|
|
|
|
|
|
| 24-Dec-10 |
263 |
|
|
|
|
|
|
|
|
|
|
|
|
|
|
|
|
|
|
|
| 25-Dec-10 |
241 |
|
|
|
|
|
|
|
|
|
|
|
|
|
|
|
|
|
|
|
| 26-Dec-10 |
233 |
|
|
|
|
|
|
|
|
|
|
|
|
|
|
|
|
|
|
|
| 27-Dec-10 |
221 |
|
|
|
|
|
|
|
|
|
|
|
|
|
|
|
|
|
|
|
| 28-Dec-10 |
199 |
|
|
|
|
|
|
|
|
|
|
|
|
|
|
|
|
|
|
|
| 29-Dec-10 |
223 |
|
|
|
|
|
|
|
|
|
|
|
|
|
|
|
|
|
|
|
| 30-Dec-10 |
223 |
|
|
|
|
|
|
|
|
|
|
|
|
|
|
|
|
|
|
|
| 31-Dec-10 |
249 |
|
|
|
|
|
|
|
|
|
|
|
|
|
|
|
|
|
|
|
|
|
|
|
|
|
|
|
|
|
|
|
|
|
|
|
|
|
|
|
|