| Site ID: |
|
|
709 |
|
|
|
|
Lat. |
47.2696 |
|
France |
|
|
0 |
|
|
|
|
|
| River: |
|
|
Cher |
|
|
|
|
Long. |
1.7011 |
|
|
|
|
|
|
|
|
|
|
| Site name: |
|
0 |
|
|
|
Contributing
area: |
8817 |
km2 |
Ratio to Comparison
Station: |
0.31 |
|
|
|
|
|
| Latest measurement: |
2-Sep-11 |
|
|
|
Mean annual
runoff: |
507 |
mm |
(2003-2009) |
|
|
|
|
|
|
|
| Hydrologic status: |
|
2 |
Normal flow |
Total runoff
this year (2010): |
563.6 |
mm |
|
|
|
|
|
|
|
|
|
| Latest M/C ratio: |
|
0.98 |
|
|
|
Seven day
total: |
13.9 |
mm |
|
|
|
|
|
|
|
|
|
| Estimated current discharge: |
143 |
m3/sec |
|
Percent of
mean 7-day total: |
146.0 |
% |
(today's value compared to
mean for same period, 2003-2009) |
|
|
|
|
|
|
|
|
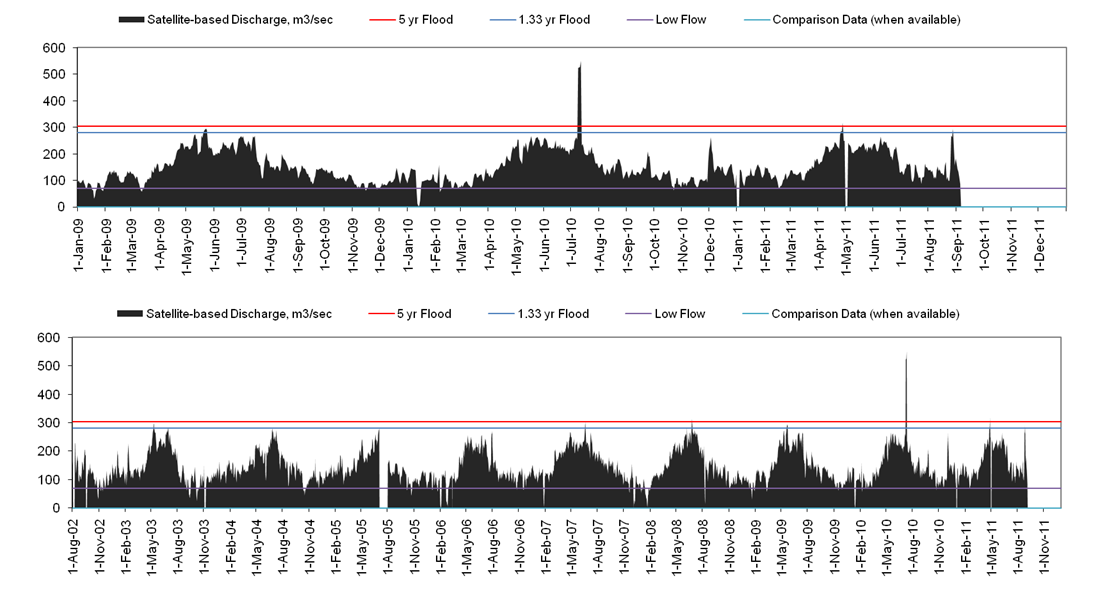
5 yr
recurrence flood: |
304 |
m3/sec |
(from Log Pearson III analysis) |
|
|
|
|
|
|
| Status Codes: 1 = Low
flow or ice, 2 = Normal flow, 3 = Flood, 4 = Major Flood |
|
302 |
m3/sec |
(from Gumbel Extreme Value analysis) |
|
|
|
|
|
| Comparison Station Information: |
Boluo
(2186950) |
|
|
|
|
|
Contributing
Area: |
|
sq mi |
28239 |
sq km |
|
|
|
| (Data from this gaging station are used for the calibration to
discharge, with an adjustment for different contributing areas) |
|
|
|
|
|
|
|
|
|
|
|
|
|
|
|
|
|
|
|
|
|
|
|
|
|
|
|
|
| Notes: |
|
Final calibration to
discharge has not
yet been accomplished. |
|
|
|
|
|
|
|
|
|
|
|
|
|
|
|
|
|
|
|
|
|
|
|
|
|
|
|
|
|
|
|
|
| Discharge and runoff, based on satellite remote sensing (NASA
AMSR-E data) |
|
|
|
|
|
|
|
|
|
|
|
|
| (For U.S, sites, nearby ground station discharge may also be
shown) |
|
|
|
|
|
|
|
|
|
|
|
|
|
|
|
|
|
|
|
|
|
|
|
|
|
|
|
|
|
|
|
|
|
|
|
|
|
|
|
|
|
|
|
|
|
|
|
|
|
|
|
|
|
|
|
|
|
|
|
|
|
|
|
|
|
|
|
|
|
|
|
|
|
|
|
|
|
|
|
|
|
|
|
|
|
|
|
|
|
|
|
|
|
|
|
|
|
|
|
|
|
|
|
|
|
|
|
|
|
|
|
|
|
|
|
|
|
|
|
|
|
|
|
|
|
|
|
|
|
|
|
|
|
|
|
|
|
|
|
|
|
|
|
|
|
|
|
|
|
|
|
|
|
|
|
|
|
|
|
|
|
|
|
|
|
|
|
|
|
|
|
|
|
|
|
|
|
|
|
|
|
|
|
|
|
|
|
|
|
|
|
|
|
|
|
|
|
|
|
|
|
|
|
|
|
|
|
|
|
|
|
|
|
|
|
|
|
|
|
|
|
|
|
|
|
|
|
|
|
|
|
|
|
|
|
|
|
|
|
|
|
|
|
|
|
|
|
|
|
|
|
|
|
|
|
|
|
|
|
|
|
|
|
|
|
|
|
|
|
|
|
|
|
|
|
|
|
|
|
|
|
|
|
|
|
|
|
|
|
|
|
|
|
|
|
|
|
|
|
|
|
|
|
|
|
|
|
|
|
|
|
|
|
|
|
|
|
|
|
|
|
|
|
|
|
|
|
|
|
|
|
|
|
|
|
|
|
|
|
|
|
|
|
|
|
|
|
|
|
|
|
|
|
|
|
|
|
|
|
|
|
|
|
|
|
|
|
|
|
|
|
|
|
|
|
|
|
|
|
|
|
|
|
|
|
|
|
|
|
|
|
|
|
|
|
|
|
|
|
|
|
|
|
|
|
|
|
|
|
|
|
|
|
|
|
|
|
|
|
|
|
|
|
|
|
|
|
|
|
|
|
|
|
|
|
|
|
|
|
|
|
|
|
|
|
|
|
|
|
|
|
|
|
|
|
|
|
|
|
|
|
|
|
|
|
|
|
|
|
|
|
|
|
|
|
|
|
|
|
|
|
|
|
|
|
|
|
|
|
|
|
|
|
|
|
|
|
|
|
|
|
|
|
|
|
|
|
|
|
|
|
|
|
|
|
|
|
|
|
|
|
|
|
|
|
|
|
|
|
|
|
|
|
|
|
|
|
|
|
|
|
|
|
|
|
|
|
|
|
|
|
|
|
|
|
|
|
|
|
|
|
|
|
|
|
|
|
|
|
|
|
|
|
|
|
|
|
|
|
|
|
|
|
|
|
|
|
|
|
|
|
|
|
|
|
|
|
|
|
|
|
|
|
|
|
|
|
|
|
|
|
|
|
|
|
|
|
|
|
|
|
|
|
|
|
|
|
|
|
|
|
|
|
|
|
|
|
|
|
|
|
|
|
|
|
|
|
|
|
|
|
|
|
|
|
|
|
|
|
|
|
|
|
|
|
|
|
|
|
|
|
|
|
|
|
|
|
|
|
|
|
|
|
|
|
|
|
|
|
|
|
|
|
|
|
|
|
|
|
|
|
|
|
|
|
|
|
|
|
|
|
|
|
| Annual |
|
|
|
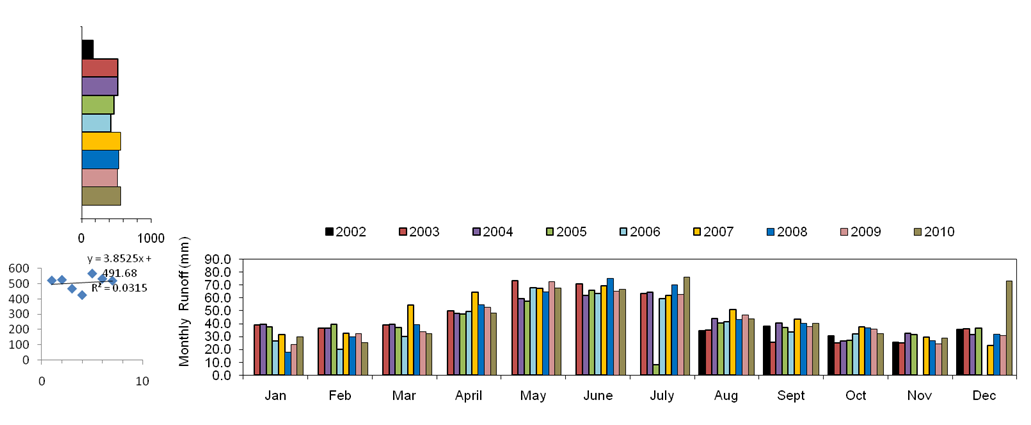
Monthly Total Runoff (mm),
computed from above satellite-based discharge data |
|
|
|
|
|
|
|
|
|
|
|
|
|
|
|
|
|
|
|
|
|
|
|
|
|
|
|
| (mm) |
|
|
|
Jan |
Feb |
Mar |
April |
May |
June |
July |
Aug |
Sept |
Oct |
Nov |
Dec |
|
|
|
|
| 164 |
|
|
2002 |
no data |
no data |
no data |
no data |
no data |
no data |
no data |
34.8 |
37.8 |
30.3 |
25.6 |
35.4 |
|
|
|
|
| 520 |
|
|
2003 |
39.1 |
36.5 |
39.2 |
50.2 |
73.2 |
71.0 |
63.4 |
35.2 |
25.7 |
25.3 |
25.0 |
36.2 |
|
|
|
|
| 524 |
|
|
2004 |
39.5 |
36.6 |
39.7 |
47.9 |
59.3 |
62.1 |
64.3 |
44.2 |
40.5 |
26.4 |
32.4 |
31.7 |
|
|
|
|
| 466 |
|
|
2005 |
37.6 |
39.4 |
37.2 |
47.6 |
57.4 |
65.8 |
8.1 |
40.6 |
37.2 |
26.8 |
31.7 |
36.7 |
|
|
|
|
| 424 |
|
|
2006 |
26.7 |
19.9 |
29.8 |
49.7 |
67.8 |
63.4 |
59.5 |
41.6 |
33.6 |
31.9 |
0.0 |
0.0 |
|
|
|
|
| 566 |
|
|
2007 |
31.6 |
32.4 |
54.7 |
64.2 |
67.3 |
69.3 |
62.1 |
51.0 |
43.4 |
37.4 |
29.5 |
22.9 |
|
|
|
|
| 531 |
|
|
2008 |
17.9 |
29.9 |
39.1 |
54.9 |
64.6 |
75.1 |
70.2 |
43.4 |
40.5 |
36.9 |
26.6 |
32.0 |
|
|
|
|
| 518 |
|
|
2009 |
23.9 |
32.2 |
33.6 |
52.9 |
72.8 |
65.4 |
62.9 |
46.9 |
37.6 |
35.7 |
24.1 |
30.6 |
|
|
|
|
| 564 |
|
|
2010 |
29.6 |
25.2 |
32.3 |
48.0 |
67.8 |
66.5 |
76.2 |
43.5 |
40.1 |
32.3 |
28.7 |
73.4 |
|
|
|
|
|
|
|
|
|
|
|
|
|
|
|
|
|
|
|
|
|
|
|
|
|
|
|
|
|
|
|
|
|
|
|
|
|
|
|
|
|
|
|
|
|
|
|
|
|
|
|
|
|
|
|
|
|
|
|
|
|
|
|
|
|
|
|
|
|
|
|
|
|
|
|
|
|
|
|
|
|
|
|
|
|
|
|
|
|
|
|
|
|
|
|
|
|
|
|
|
|
|
|
|
|
|
|
|
|
|
|
|
|
|
|
|
|
|
|
|
|
|
|
|
|
|
|
|
|
|
|
|
|
|
|
|
|
|
|
|
|
|
|
|
|
|
|
|
|
|
|
|
|
|
|
|
|
|
|
|
|
|
|
|
|
|
|
|
|
|
|
|
|
|
|
|
|
|
|
|
|
|
|
|
|
|
|
|
|
|
|
|
|
|
|
|
|
|
|
|
|
|
|
|
|
|
|
|
|
|
|
|
|
|
|
|
|
|
|
|
|
|
|
|
|
|
|
|
|
|
|
|
|
|
|
|
|
|
|
|
|
|
|
|
|
|
|
|
|
|
|
|
|
|
|
|
|
|
|
|
|
|
|
|
|
Mean Annual Runoff (mm): |
507 |
|
Standard Deviation: |
6.4 |
|
|
|
|
|
|
|
|
|
|
|
|
Trend in Annual Runoff
(slope): |
-73 |
|
|
|
|
|
|
|
|
|
|
|
|
|
|
|
|
|
|
|
|
|
|
|
|
|
|
|
|
|
|
|
|
|
|
|
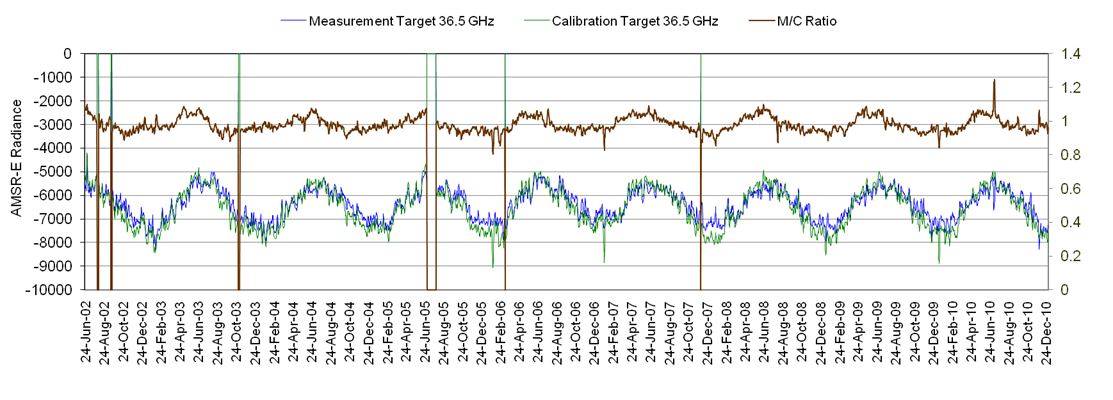
| Discharge is estimated via a rating equation directly from
the remote sensing data (M/C ratio) shown below. |
|
|
|
|
|
|
|
|
|
|
|
|
|
|
|
|
|
|
|
|
|
|
|
|
|
|
|
|
|
|
|
|
|
|
|
|
|
|
|
|
|
|
|
|
|
|
|
|
|
|
|
|
|
|
|
|
|
|
|
|
|
|
|
|
|
|
|
|
|
|
|
|
|
|
|
|
|
|
|
|
|
|
|
|
|
|
|
|
|
|
|
|
|
|
|
|
|
|
|
|
|
|
|
|
|
|
|
|
|
|
|
|
|
|
|
|
|
|
|
|
|
|
|
|
|
|
|
|
|
|
|
|
|
|
|
|
|
|
|
|
|
|
|
|
|
|
|
|
|
|
|
|
|
|
|
|
|
|
|
|
|
|
|
|
|
|
|
|
|
|
|
|
|
|
|
|
|
|
|
|
|
|
|
|
|
|
|
|
|
|
|
|
|
|
|
|
|
|
|
|
|
|
|
|
|
|
|
|
|
|
|
|
|
|
|
|
|
|
|
|
|
|
|
|
|
|
|
|
|
|
|
|
|
|
|
|
|
|
|
|
|
|
|
|
|
|
|
|
|
|
|
|
|
|
|
|
|
|
|
|
|
|
|
|
|
|
|
|
|
|
|
|
|
|
|
|
|
|
|
|
|
|
|
|
|
|
|
|
|
|
|
|
|
|
|
|
|
|
|
|
|
|
|
|
|
|
|
|
|
|
|
|
|
|
|
|
|
|
|
|
|
|
|
|
|
|
|
|
|
|
|
|
|
|
|
|
|
|
|
|
|
|
|
|
|
|
|
|
|
|
|
|
|
|
|
|
|
|
|
|
|
|
|
|
|
|
|
|
|
|
|
|
|
|
|
|
|
|
|
|
|
|
|
|
|
|
|
|
|
|
|
|
|
|
|
|
|
|
|
|
|
|
|
|
|
|
|
|
|
|
|
|
|
|
|
|
|
|
|
|
|
|
|
|
|
|
|
|
|
|
|
|
|
|
|
|
|
|
|
|
|
|
|
|
|
|
|
|
|
|
|
|
|
|
|
|
|
|
|
|
|
|
|
|
|
|
|
|
|
|
|
|
Green line records upwelling
microwave emission from within 5 km radius of a calbration land target. |
|
|
|
|
|
|
|
|
Explanation: |
Blue line is emission from
within 5 km radius of the measurement target centered over the river. |
|
|
|
|
|
|
|
|
|
|
|
Brown line is their ratio
(M/C; "HR" in Brakenridge et al 2007; scale on right) and is used
to estimate river discharge via a rating equation. |
|
|
|
|
|
|
|
Rating equations are being
developed and applied on an individual basis using available ground-based
discharge information. |
|
|
|
|
|
|
|
|
|
|
|
|
|
|
|
|
|
|
|
|
|
|
|
|
|
|
|
|
|
|
|
|
|
|
|
|
|
|
|
|
|
|
|
|
|
| GoogleEarth View of Measurement Site |
|
|
|
|
|
|
|
|
|
|
|
|
|
|
|
|
|
|
|
|
|
|
|
|
|
|
|
|
|
|
|
|
|
|
|
|
| Return |
|
|
|
|
|
|
|
|
|
|
|
|
|
|
|
|
|
|
|
|
|
|
|
|
|
|
|
|
|
|
|
|
|
|
|
|
|
|
|
|
|
|
|
|
|
|
|
|
|
|
|
|
|
|
|
|
|
|
|
|
|
|
|
|
|
|
|
|
|
|
|
|
|
|
|
|
|
|
|
|
|
|
|
|
|
|
|
|
|
|
|
|
|
|
|
|
|
|
|
|
|
|
|
|
|
|
|
|
|
|
|
|
|
|
|
|
|
|
|
|
|
|
|
|
|
|
|
|
|
|
|
|
|
|
|
|
|
|
|
|
|
|
|
|
|
|
|
|
|
|
|
|
|
|
|
|
|
|
|
|
|
|
|
|
|
|
|
|
|
|
|
|
|
|
|
|
|
|
|
|
|
|
|
|
|
|
|
|
|
|
|
|
|
|
|
|
|
|
|
|
|
|
|
|
|
|
|
|
|
|
|
|
|
|
|
|
|
|
|
|
|
|
|
|
|
|
|
|
|
|
|
|
|
|
|
|
|
|
|
|
|
|
|
|
|
|
|
|
|
|
|
|
|
|
|
|
|
|
|
|
|
|
|
|
|
|
|
|
|
|
|
|
|
|
|
|
|
|
|
|
|
|
|
|
|
|
|
|
|
|
|
|
|
|
|
|
|
|
|
|
|
|
|
|
|
|
|
|
|
|
|
|
|
|
|
|
|
|
|
|
|
|
|
|
|
|
|
|
|
|
|
|
|
|
|
|
|
|
|
|
|
|
|
|
|
|
|
|
|
|
|
|
|
|
|
|
|
|
|
|
|
|
|
|
|
|
|
|
|
|
|
|
|
|
|
|
|
|
|
|
|
|
|
|
|
|
|
|
|
|
|
|
|
|
|
|
|
|
|
|
|
|
|
|
|
|
|
|
|
|
|
|
|
|
|
|
|
|
|
|
|
|
|
|
|
|
|
|
|
|
|
|
|
|
|
|
|
|
|
|
|
|
|
|
|
|
|
|
|
|
|
|
|
|
|
|
|
|
|
|
|
|
|
|
|
|
|
|
|
|
|
|
|
|
|
|
|
|
|
|
|
|
|
|
|
|
|
|
|
|
|
|
|
|
|
|
|
|
|
|
|
|
|
|
|
|
|
|
|
|
|
|
|
|
|
|
|
|
|
|
|
|
|
|
|
|
|
|
|
|
|
|
|
|
|
|
|
|
|
|
|
|
|
|
|
|
|
|
|
|
|
|
|
|
|
|
|
|
|
|
|
|
|
|
|
|
|
|
|
|
|
|
|
|
|
|
|
|
|
|
|
|
|
|
|
|
|
|
|
|
|
|
|
|
|
|
|
|
|
|
|
|
|
|
|
|
|
|
|
|
|
|
|
|
|
|
|
|
|
| Estimated |
|
|
|
|
|
|
|
|
|
|
|
|
|
|
|
|
|
|
| Disharge |
|
|
|
|
|
|
|
|
|
|
|
|
|
|
|
|
|
|
|
| Data |
|
|
|
|
|
|
|
|
|
|
|
|
|
|
|
|
|
|
|
| Date |
m3/sec |
|
|
|
|
|
|
|
|
|
|
|
|
|
|
|
|
|
|
| 22-Jul-02 |
186 |
|
|
|
|
|
|
|
|
|
|
|
|
|
|
|
|
|
|
| 23-Jul-02 |
186 |
|
|
|
|
|
|
|
|
|
|
|
|
|
|
|
|
|
|
| 24-Jul-02 |
194 |
|
|
|
|
|
|
|
|
|
|
|
|
|
|
|
|
|
|
| 25-Jul-02 |
206 |
|
|
|
|
|
|
|
|
|
|
|
|
|
|
|
|
|
|
| 26-Jul-02 |
219 |
|
|
|
|
|
|
|
|
|
|
|
|
|
|
|
|
|
|
| 27-Jul-02 |
196 |
|
|
|
|
|
|
|
|
|
|
|
|
|
|
|
|
|
|
| 28-Jul-02 |
195 |
|
|
|
|
|
|
|
|
|
|
|
|
|
|
|
|
|
|
| 29-Jul-02 |
189 |
|
|
|
|
|
|
|
|
|
|
|
|
|
|
|
|
|
|
| 30-Jul-02 |
165 |
|
|
|
|
|
|
|
|
|
|
|
|
|
|
|
|
|
|
| 31-Jul-02 |
174 |
|
|
|
|
|
|
|
|
|
|
|
|
|
|
|
|
|
|
| 1-Aug-02 |
162 |
|
|
|
|
|
|
|
|
|
|
|
|
|
|
|
|
|
|
| 2-Aug-02 |
152 |
|
|
|
|
|
|
|
|
|
|
|
|
|
|
|
|
|
|
| 3-Aug-02 |
|
|
|
|
|
|
|
|
|
|
|
|
|
|
|
|
|
|
|
| 4-Aug-02 |
|
|
|
|
|
|
|
|
|
|
|
|
|
|
|
|
|
|
|
| 5-Aug-02 |
|
|
|
|
|
|
|
|
|
|
|
|
|
|
|
|
|
|
|
| 6-Aug-02 |
|
|
|
|
|
|
|
|
|
|
|
|
|
|
|
|
|
|
|
| 7-Aug-02 |
|
|
|
|
|
|
|
|
|
|
|
|
|
|
|
|
|
|
|
| 8-Aug-02 |
|
|
|
|
|
|
|
|
|
|
|
|
|
|
|
|
|
|
|
| 9-Aug-02 |
228 |
|
|
|
|
|
|
|
|
|
|
|
|
|
|
|
|
|
|
| 10-Aug-02 |
228 |
|
|
|
|
|
|
|
|
|
|
|
|
|
|
|
|
|
|
| 11-Aug-02 |
184 |
|
|
|
|
|
|
|
|
|
|
|
|
|
|
|
|
|
|
| 12-Aug-02 |
156 |
|
|
|
|
|
|
|
|
|
|
|
|
|
|
|
|
|
|
| 13-Aug-02 |
121 |
|
|
|
|
|
|
|
|
|
|
|
|
|
|
|
|
|
|
| 14-Aug-02 |
133 |
|
|
|
|
|
|
|
|
|
|
|
|
|
|
|
|
|
|
| 15-Aug-02 |
149 |
|
|
|
|
|
|
|
|
|
|
|
|
|
|
|
|
|
|
| 16-Aug-02 |
165 |
|
|
|
|
|
|
|
|
|
|
|
|
|
|
|
|
|
|
| 17-Aug-02 |
177 |
|
|
|
|
|
|
|
|
|
|
|
|
|
|
|
|
|
|
| 18-Aug-02 |
187 |
|
|
|
|
|
|
|
|
|
|
|
|
|
|
|
|
|
|
| 19-Aug-02 |
167 |
|
|
|
|
|
|
|
|
|
|
|
|
|
|
|
|
|
|
| 20-Aug-02 |
166 |
|
|
|
|
|
|
|
|
|
|
|
|
|
|
|
|
|
|
| 21-Aug-02 |
120 |
|
|
|
|
|
|
|
|
|
|
|
|
|
|
|
|
|
|
| 22-Aug-02 |
95 |
|
|
|
|
|
|
|
|
|
|
|
|
|
|
|
|
|
|
| 23-Aug-02 |
97 |
|
|
|
|
|
|
|
|
|
|
|
|
|
|
|
|
|
|
| 24-Aug-02 |
90 |
|
|
|
|
|
|
|
|
|
|
|
|
|
|
|
|
|
|
| 25-Aug-02 |
114 |
|
|
|
|
|
|
|
|
|
|
|
|
|
|
|
|
|
|
| 26-Aug-02 |
120 |
|
|
|
|
|
|
|
|
|
|
|
|
|
|
|
|
|
|
| 27-Aug-02 |
114 |
|
|
|
|
|
|
|
|
|
|
|
|
|
|
|
|
|
|
| 28-Aug-02 |
110 |
|
|
|
|
|
|
|
|
|
|
|
|
|
|
|
|
|
|
| 29-Aug-02 |
112 |
|
|
|
|
|
|
|
|
|
|
|
|
|
|
|
|
|
|
| 30-Aug-02 |
102 |
|
|
|
|
|
|
|
|
|
|
|
|
|
|
|
|
|
|
| 31-Aug-02 |
100 |
|
|
|
|
|
|
|
|
|
|
|
|
|
|
|
|
|
|
| 1-Sep-02 |
115 |
|
|
|
|
|
|
|
|
|
|
|
|
|
|
|
|
|
|
| 2-Sep-02 |
124 |
|
|
|
|
|
|
|
|
|
|
|
|
|
|
|
|
|
|
| 3-Sep-02 |
153 |
|
|
|
|
|
|
|
|
|
|
|
|
|
|
|
|
|
|
| 4-Sep-02 |
165 |
|
|
|
|
|
|
|
|
|
|
|
|
|
|
|
|
|
|
| 5-Sep-02 |
159 |
|
|
|
|
|
|
|
|
|
|
|
|
|
|
|
|
|
|
| 6-Sep-02 |
152 |
|
|
|
|
|
|
|
|
|
|
|
|
|
|
|
|
|
|
| 7-Sep-02 |
142 |
|
|
|
|
|
|
|
|
|
|
|
|
|
|
|
|
|
|
| 8-Sep-02 |
132 |
|
|
|
|
|
|
|
|
|
|
|
|
|
|
|
|
|
|
| 9-Sep-02 |
137 |
|
|
|
|
|
|
|
|
|
|
|
|
|
|
|
|
|
|
| 10-Sep-02 |
173 |
|
|
|
|
|
|
|
|
|
|
|
|
|
|
|
|
|
|
| 11-Sep-02 |
182 |
|
|
|
|
|
|
|
|
|
|
|
|
|
|
|
|
|
|
| 12-Sep-02 |
204 |
|
|
|
|
|
|
|
|
|
|
|
|
|
|
|
|
|
|
| 13-Sep-02 |
207 |
|
|
|
|
|
|
|
|
|
|
|
|
|
|
|
|
|
|
| 14-Sep-02 |
187 |
|
|
|
|
|
|
|
|
|
|
|
|
|
|
|
|
|
|
| 15-Sep-02 |
187 |
|
|
|
|
|
|
|
|
|
|
|
|
|
|
|
|
|
|
| 16-Sep-02 |
183 |
|
|
|
|
|
|
|
|
|
|
|
|
|
|
|
|
|
|
| 17-Sep-02 |
|
|
|
|
|
|
|
|
|
|
|
|
|
|
|
|
|
|
|
| 18-Sep-02 |
|
|
|
|
|
|
|
|
|
|
|
|
|
|
|
|
|
|
|
| 19-Sep-02 |
|
|
|
|
|
|
|
|
|
|
|
|
|
|
|
|
|
|
|
| 20-Sep-02 |
|
|
|
|
|
|
|
|
|
|
|
|
|
|
|
|
|
|
|
| 21-Sep-02 |
87 |
|
|
|
|
|
|
|
|
|
|
|
|
|
|
|
|
|
|
| 22-Sep-02 |
110 |
|
|
|
|
|
|
|
|
|
|
|
|
|
|
|
|
|
|
| 23-Sep-02 |
120 |
|
|
|
|
|
|
|
|
|
|
|
|
|
|
|
|
|
|
| 24-Sep-02 |
122 |
|
|
|
|
|
|
|
|
|
|
|
|
|
|
|
|
|
|
| 25-Sep-02 |
140 |
|
|
|
|
|
|
|
|
|
|
|
|
|
|
|
|
|
|
| 26-Sep-02 |
135 |
|
|
|
|
|
|
|
|
|
|
|
|
|
|
|
|
|
|
| 27-Sep-02 |
133 |
|
|
|
|
|
|
|
|
|
|
|
|
|
|
|
|
|
|
| 28-Sep-02 |
135 |
|
|
|
|
|
|
|
|
|
|
|
|
|
|
|
|
|
|
| 29-Sep-02 |
116 |
|
|
|
|
|
|
|
|
|
|
|
|
|
|
|
|
|
|
| 30-Sep-02 |
159 |
|
|
|
|
|
|
|
|
|
|
|
|
|
|
|
|
|
|
| 1-Oct-02 |
138 |
|
|
|
|
|
|
|
|
|
|
|
|
|
|
|
|
|
|
| 2-Oct-02 |
141 |
|
|
|
|
|
|
|
|
|
|
|
|
|
|
|
|
|
|
| 3-Oct-02 |
132 |
|
|
|
|
|
|
|
|
|
|
|
|
|
|
|
|
|
|
| 4-Oct-02 |
121 |
|
|
|
|
|
|
|
|
|
|
|
|
|
|
|
|
|
|
| 5-Oct-02 |
125 |
|
|
|
|
|
|
|
|
|
|
|
|
|
|
|
|
|
|
| 6-Oct-02 |
118 |
|
|
|
|
|
|
|
|
|
|
|
|
|
|
|
|
|
|
| 7-Oct-02 |
124 |
|
|
|
|
|
|
|
|
|
|
|
|
|
|
|
|
|
|
| 8-Oct-02 |
127 |
|
|
|
|
|
|
|
|
|
|
|
|
|
|
|
|
|
|
| 9-Oct-02 |
127 |
|
|
|
|
|
|
|
|
|
|
|
|
|
|
|
|
|
|
| 10-Oct-02 |
135 |
|
|
|
|
|
|
|
|
|
|
|
|
|
|
|
|
|
|
| 11-Oct-02 |
126 |
|
|
|
|
|
|
|
|
|
|
|
|
|
|
|
|
|
|
| 12-Oct-02 |
123 |
|
|
|
|
|
|
|
|
|
|
|
|
|
|
|
|
|
|
| 13-Oct-02 |
119 |
|
|
|
|
|
|
|
|
|
|
|
|
|
|
|
|
|
|
| 14-Oct-02 |
103 |
|
|
|
|
|
|
|
|
|
|
|
|
|
|
|
|
|
|
| 15-Oct-02 |
103 |
|
|
|
|
|
|
|
|
|
|
|
|
|
|
|
|
|
|
| 16-Oct-02 |
99 |
|
|
|
|
|
|
|
|
|
|
|
|
|
|
|
|
|
|
| 17-Oct-02 |
100 |
|
|
|
|
|
|
|
|
|
|
|
|
|
|
|
|
|
|
| 18-Oct-02 |
75 |
|
|
|
|
|
|
|
|
|
|
|
|
|
|
|
|
|
|
| 19-Oct-02 |
87 |
|
|
|
|
|
|
|
|
|
|
|
|
|
|
|
|
|
|
| 20-Oct-02 |
81 |
|
|
|
|
|
|
|
|
|
|
|
|
|
|
|
|
|
|
| 21-Oct-02 |
89 |
|
|
|
|
|
|
|
|
|
|
|
|
|
|
|
|
|
|
| 22-Oct-02 |
112 |
|
|
|
|
|
|
|
|
|
|
|
|
|
|
|
|
|
|
| 23-Oct-02 |
93 |
|
|
|
|
|
|
|
|
|
|
|
|
|
|
|
|
|
|
| 24-Oct-02 |
99 |
|
|
|
|
|
|
|
|
|
|
|
|
|
|
|
|
|
|
| 25-Oct-02 |
79 |
|
|
|
|
|
|
|
|
|
|
|
|
|
|
|
|
|
|
| 26-Oct-02 |
78 |
|
|
|
|
|
|
|
|
|
|
|
|
|
|
|
|
|
|
| 27-Oct-02 |
56 |
|
|
|
|
|
|
|
|
|
|
|
|
|
|
|
|
|
|
| 28-Oct-02 |
42 |
|
|
|
|
|
|
|
|
|
|
|
|
|
|
|
|
|
|
| 29-Oct-02 |
36 |
|
|
|
|
|
|
|
|
|
|
|
|
|
|
|
|
|
|
| 30-Oct-02 |
31 |
|
|
|
|
|
|
|
|
|
|
|
|
|
|
|
|
|
|
| 31-Oct-02 |
73 |
|
|
|
|
|
|
|
|
|
|
|
|
|
|
|
|
|
|
| 1-Nov-02 |
82 |
|
|
|
|
|
|
|
|
|
|
|
|
|
|
|
|
|
|
| 2-Nov-02 |
89 |
|
|
|
|
|
|
|
|
|
|
|
|
|
|
|
|
|
|
| 3-Nov-02 |
100 |
|
|
|
|
|
|
|
|
|
|
|
|
|
|
|
|
|
|
| 4-Nov-02 |
103 |
|
|
|
|
|
|
|
|
|
|
|
|
|
|
|
|
|
|
| 5-Nov-02 |
87 |
|
|
|
|
|
|
|
|
|
|
|
|
|
|
|
|
|
|
| 6-Nov-02 |
77 |
|
|
|
|
|
|
|
|
|
|
|
|
|
|
|
|
|
|
| 7-Nov-02 |
62 |
|
|
|
|
|
|
|
|
|
|
|
|
|
|
|
|
|
|
| 8-Nov-02 |
60 |
|
|
|
|
|
|
|
|
|
|
|
|
|
|
|
|
|
|
| 9-Nov-02 |
75 |
|
|
|
|
|
|
|
|
|
|
|
|
|
|
|
|
|
|
| 10-Nov-02 |
75 |
|
|
|
|
|
|
|
|
|
|
|
|
|
|
|
|
|
|
| 11-Nov-02 |
91 |
|
|
|
|
|
|
|
|
|
|
|
|
|
|
|
|
|
|
| 12-Nov-02 |
64 |
|
|
|
|
|
|
|
|
|
|
|
|
|
|
|
|
|
|
| 13-Nov-02 |
69 |
|
|
|
|
|
|
|
|
|
|
|
|
|
|
|
|
|
|
| 14-Nov-02 |
66 |
|
|
|
|
|
|
|
|
|
|
|
|
|
|
|
|
|
|
| 15-Nov-02 |
59 |
|
|
|
|
|
|
|
|
|
|
|
|
|
|
|
|
|
|
| 16-Nov-02 |
102 |
|
|
|
|
|
|
|
|
|
|
|
|
|
|
|
|
|
|
| 17-Nov-02 |
109 |
|
|
|
|
|
|
|
|
|
|
|
|
|
|
|
|
|
|
| 18-Nov-02 |
99 |
|
|
|
|
|
|
|
|
|
|
|
|
|
|
|
|
|
|
| 19-Nov-02 |
96 |
|
|
|
|
|
|
|
|
|
|
|
|
|
|
|
|
|
|
| 20-Nov-02 |
89 |
|
|
|
|
|
|
|
|
|
|
|
|
|
|
|
|
|
|
| 21-Nov-02 |
75 |
|
|
|
|
|
|
|
|
|
|
|
|
|
|
|
|
|
|
| 22-Nov-02 |
69 |
|
|
|
|
|
|
|
|
|
|
|
|
|
|
|
|
|
|
| 23-Nov-02 |
82 |
|
|
|
|
|
|
|
|
|
|
|
|
|
|
|
|
|
|
| 24-Nov-02 |
72 |
|
|
|
|
|
|
|
|
|
|
|
|
|
|
|
|
|
|
| 25-Nov-02 |
91 |
|
|
|
|
|
|
|
|
|
|
|
|
|
|
|
|
|
|
| 26-Nov-02 |
110 |
|
|
|
|
|
|
|
|
|
|
|
|
|
|
|
|
|
|
| 27-Nov-02 |
115 |
|
|
|
|
|
|
|
|
|
|
|
|
|
|
|
|
|
|
| 28-Nov-02 |
132 |
|
|
|
|
|
|
|
|
|
|
|
|
|
|
|
|
|
|
| 29-Nov-02 |
107 |
|
|
|
|
|
|
|
|
|
|
|
|
|
|
|
|
|
|
| 30-Nov-02 |
100 |
|
|
|
|
|
|
|
|
|
|
|
|
|
|
|
|
|
|
| 1-Dec-02 |
80 |
|
|
|
|
|
|
|
|
|
|
|
|
|
|
|
|
|
|
| 2-Dec-02 |
80 |
|
|
|
|
|
|
|
|
|
|
|
|
|
|
|
|
|
|
| 3-Dec-02 |
80 |
|
|
|
|
|
|
|
|
|
|
|
|
|
|
|
|
|
|
| 4-Dec-02 |
83 |
|
|
|
|
|
|
|
|
|
|
|
|
|
|
|
|
|
|
| 5-Dec-02 |
97 |
|
|
|
|
|
|
|
|
|
|
|
|
|
|
|
|
|
|
| 6-Dec-02 |
98 |
|
|
|
|
|
|
|
|
|
|
|
|
|
|
|
|
|
|
| 7-Dec-02 |
114 |
|
|
|
|
|
|
|
|
|
|
|
|
|
|
|
|
|
|
| 8-Dec-02 |
123 |
|
|
|
|
|
|
|
|
|
|
|
|
|
|
|
|
|
|
| 9-Dec-02 |
115 |
|
|
|
|
|
|
|
|
|
|
|
|
|
|
|
|
|
|
| 10-Dec-02 |
115 |
|
|
|
|
|
|
|
|
|
|
|
|
|
|
|
|
|
|
| 11-Dec-02 |
132 |
|
|
|
|
|
|
|
|
|
|
|
|
|
|
|
|
|
|
| 12-Dec-02 |
109 |
|
|
|
|
|
|
|
|
|
|
|
|
|
|
|
|
|
|
| 13-Dec-02 |
100 |
|
|
|
|
|
|
|
|
|
|
|
|
|
|
|
|
|
|
| 14-Dec-02 |
101 |
|
|
|
|
|
|
|
|
|
|
|
|
|
|
|
|
|
|
| 15-Dec-02 |
84 |
|
|
|
|
|
|
|
|
|
|
|
|
|
|
|
|
|
|
| 16-Dec-02 |
99 |
|
|
|
|
|
|
|
|
|
|
|
|
|
|
|
|
|
|
| 17-Dec-02 |
136 |
|
|
|
|
|
|
|
|
|
|
|
|
|
|
|
|
|
|
| 18-Dec-02 |
157 |
|
|
|
|
|
|
|
|
|
|
|
|
|
|
|
|
|
|
| 19-Dec-02 |
137 |
|
|
|
|
|
|
|
|
|
|
|
|
|
|
|
|
|
|
| 20-Dec-02 |
144 |
|
|
|
|
|
|
|
|
|
|
|
|
|
|
|
|
|
|
| 21-Dec-02 |
123 |
|
|
|
|
|
|
|
|
|
|
|
|
|
|
|
|
|
|
| 22-Dec-02 |
112 |
|
|
|
|
|
|
|
|
|
|
|
|
|
|
|
|
|
|
| 23-Dec-02 |
132 |
|
|
|
|
|
|
|
|
|
|
|
|
|
|
|
|
|
|
| 24-Dec-02 |
115 |
|
|
|
|
|
|
|
|
|
|
|
|
|
|
|
|
|
|
| 25-Dec-02 |
125 |
|
|
|
|
|
|
|
|
|
|
|
|
|
|
|
|
|
|
| 26-Dec-02 |
142 |
|
|
|
|
|
|
|
|
|
|
|
|
|
|
|
|
|
|
| 27-Dec-02 |
135 |
|
|
|
|
|
|
|
|
|
|
|
|
|
|
|
|
|
|
| 28-Dec-02 |
148 |
|
|
|
|
|
|
|
|
|
|
|
|
|
|
|
|
|
|
| 29-Dec-02 |
147 |
|
|
|
|
|
|
|
|
|
|
|
|
|
|
|
|
|
|
| 30-Dec-02 |
123 |
|
|
|
|
|
|
|
|
|
|
|
|
|
|
|
|
|
|
| 31-Dec-02 |
119 |
|
|
|
|
|
|
|
|
|
|
|
|
|
|
|
|
|
|
| 1-Jan-03 |
107 |
|
|
|
|
|
|
|
|
|
|
|
|
|
|
|
|
|
|
| 2-Jan-03 |
105 |
|
|
|
|
|
|
|
|
|
|
|
|
|
|
|
|
|
|
| 3-Jan-03 |
168 |
|
|
|
|
|
|
|
|
|
|
|
|
|
|
|
|
|
|
| 4-Jan-03 |
205 |
|
|
|
|
|
|
|
|
|
|
|
|
|
|
|
|
|
|
| 5-Jan-03 |
184 |
|
|
|
|
|
|
|
|
|
|
|
|
|
|
|
|
|
|
| 6-Jan-03 |
191 |
|
|
|
|
|
|
|
|
|
|
|
|
|
|
|
|
|
|
| 7-Jan-03 |
152 |
|
|
|
|
|
|
|
|
|
|
|
|
|
|
|
|
|
|
| 8-Jan-03 |
141 |
|
|
|
|
|
|
|
|
|
|
|
|
|
|
|
|
|
|
| 9-Jan-03 |
141 |
|
|
|
|
|
|
|
|
|
|
|
|
|
|
|
|
|
|
| 10-Jan-03 |
127 |
|
|
|
|
|
|
|
|
|
|
|
|
|
|
|
|
|
|
| 11-Jan-03 |
123 |
|
|
|
|
|
|
|
|
|
|
|
|
|
|
|
|
|
|
| 12-Jan-03 |
117 |
|
|
|
|
|
|
|
|
|
|
|
|
|
|
|
|
|
|
| 13-Jan-03 |
107 |
|
|
|
|
|
|
|
|
|
|
|
|
|
|
|
|
|
|
| 14-Jan-03 |
108 |
|
|
|
|
|
|
|
|
|
|
|
|
|
|
|
|
|
|
| 15-Jan-03 |
111 |
|
|
|
|
|
|
|
|
|
|
|
|
|
|
|
|
|
|
| 16-Jan-03 |
107 |
|
|
|
|
|
|
|
|
|
|
|
|
|
|
|
|
|
|
| 17-Jan-03 |
114 |
|
|
|
|
|
|
|
|
|
|
|
|
|
|
|
|
|
|
| 18-Jan-03 |
119 |
|
|
|
|
|
|
|
|
|
|
|
|
|
|
|
|
|
|
| 19-Jan-03 |
121 |
|
|
|
|
|
|
|
|
|
|
|
|
|
|
|
|
|
|
| 20-Jan-03 |
117 |
|
|
|
|
|
|
|
|
|
|
|
|
|
|
|
|
|
|
| 21-Jan-03 |
120 |
|
|
|
|
|
|
|
|
|
|
|
|
|
|
|
|
|
|
| 22-Jan-03 |
129 |
|
|
|
|
|
|
|
|
|
|
|
|
|
|
|
|
|
|
| 23-Jan-03 |
130 |
|
|
|
|
|
|
|
|
|
|
|
|
|
|
|
|
|
|
| 24-Jan-03 |
148 |
|
|
|
|
|
|
|
|
|
|
|
|
|
|
|
|
|
|
| 25-Jan-03 |
139 |
|
|
|
|
|
|
|
|
|
|
|
|
|
|
|
|
|
|
| 26-Jan-03 |
133 |
|
|
|
|
|
|
|
|
|
|
|
|
|
|
|
|
|
|
| 27-Jan-03 |
125 |
|
|
|
|
|
|
|
|
|
|
|
|
|
|
|
|
|
|
| 28-Jan-03 |
114 |
|
|
|
|
|
|
|
|
|
|
|
|
|
|
|
|
|
|
| 29-Jan-03 |
102 |
|
|
|
|
|
|
|
|
|
|
|
|
|
|
|
|
|
|
| 30-Jan-03 |
85 |
|
|
|
|
|
|
|
|
|
|
|
|
|
|
|
|
|
|
| 31-Jan-03 |
100 |
|
|
|
|
|
|
|
|
|
|
|
|
|
|
|
|
|
|
| 1-Feb-03 |
106 |
|
|
|
|
|
|
|
|
|
|
|
|
|
|
|
|
|
|
| 2-Feb-03 |
122 |
|
|
|
|
|
|
|
|
|
|
|
|
|
|
|
|
|
|
| 3-Feb-03 |
122 |
|
|
|
|
|
|
|
|
|
|
|
|
|
|
|
|
|
|
| 4-Feb-03 |
113 |
|
|
|
|
|
|
|
|
|
|
|
|
|
|
|
|
|
|
| 5-Feb-03 |
79 |
|
|
|
|
|
|
|
|
|
|
|
|
|
|
|
|
|
|
| 6-Feb-03 |
100 |
|
|
|
|
|
|
|
|
|
|
|
|
|
|
|
|
|
|
| 7-Feb-03 |
129 |
|
|
|
|
|
|
|
|
|
|
|
|
|
|
|
|
|
|
| 8-Feb-03 |
126 |
|
|
|
|
|
|
|
|
|
|
|
|
|
|
|
|
|
|
| 9-Feb-03 |
186 |
|
|
|
|
|
|
|
|
|
|
|
|
|
|
|
|
|
|
| 10-Feb-03 |
200 |
|
|
|
|
|
|
|
|
|
|
|
|
|
|
|
|
|
|
| 11-Feb-03 |
226 |
|
|
|
|
|
|
|
|
|
|
|
|
|
|
|
|
|
|
| 12-Feb-03 |
210 |
|
|
|
|
|
|
|
|
|
|
|
|
|
|
|
|
|
|
| 13-Feb-03 |
184 |
|
|
|
|
|
|
|
|
|
|
|
|
|
|
|
|
|
|
| 14-Feb-03 |
160 |
|
|
|
|
|
|
|
|
|
|
|
|
|
|
|
|
|
|
| 15-Feb-03 |
139 |
|
|
|
|
|
|
|
|
|
|
|
|
|
|
|
|
|
|
| 16-Feb-03 |
131 |
|
|
|
|
|
|
|
|
|
|
|
|
|
|
|
|
|
|
| 17-Feb-03 |
130 |
|
|
|
|
|
|
|
|
|
|
|
|
|
|
|
|
|
|
| 18-Feb-03 |
133 |
|
|
|
|
|
|
|
|
|
|
|
|
|
|
|
|
|
|
| 19-Feb-03 |
118 |
|
|
|
|
|
|
|
|
|
|
|
|
|
|
|
|
|
|
| 20-Feb-03 |
111 |
|
|
|
|
|
|
|
|
|
|
|
|
|
|
|
|
|
|
| 21-Feb-03 |
106 |
|
|
|
|
|
|
|
|
|
|
|
|
|
|
|
|
|
|
| 22-Feb-03 |
112 |
|
|
|
|
|
|
|
|
|
|
|
|
|
|
|
|
|
|
| 23-Feb-03 |
121 |
|
|
|
|
|
|
|
|
|
|
|
|
|
|
|
|
|
|
| 24-Feb-03 |
124 |
|
|
|
|
|
|
|
|
|
|
|
|
|
|
|
|
|
|
| 25-Feb-03 |
113 |
|
|
|
|
|
|
|
|
|
|
|
|
|
|
|
|
|
|
| 26-Feb-03 |
110 |
|
|
|
|
|
|
|
|
|
|
|
|
|
|
|
|
|
|
| 27-Feb-03 |
104 |
|
|
|
|
|
|
|
|
|
|
|
|
|
|
|
|
|
|
| 28-Feb-03 |
109 |
|
|
|
|
|
|
|
|
|
|
|
|
|
|
|
|
|
|
| 1-Mar-03 |
125 |
|
|
|
|
|
|
|
|
|
|
|
|
|
|
|
|
|
|
| 2-Mar-03 |
132 |
|
|
|
|
|
|
|
|
|
|
|
|
|
|
|
|
|
|
| 3-Mar-03 |
136 |
|
|
|
|
|
|
|
|
|
|
|
|
|
|
|
|
|
|
| 4-Mar-03 |
132 |
|
|
|
|
|
|
|
|
|
|
|
|
|
|
|
|
|
|
| 5-Mar-03 |
138 |
|
|
|
|
|
|
|
|
|
|
|
|
|
|
|
|
|
|
| 6-Mar-03 |
134 |
|
|
|
|
|
|
|
|
|
|
|
|
|
|
|
|
|
|
| 7-Mar-03 |
140 |
|
|
|
|
|
|
|
|
|
|
|
|
|
|
|
|
|
|
| 8-Mar-03 |
140 |
|
|
|
|
|
|
|
|
|
|
|
|
|
|
|
|
|
|
| 9-Mar-03 |
137 |
|
|
|
|
|
|
|
|
|
|
|
|
|
|
|
|
|
|
| 10-Mar-03 |
133 |
|
|
|
|
|
|
|
|
|
|
|
|
|
|
|
|
|
|
| 11-Mar-03 |
126 |
|
|
|
|
|
|
|
|
|
|
|
|
|
|
|
|
|
|
| 12-Mar-03 |
122 |
|
|
|
|
|
|
|
|
|
|
|
|
|
|
|
|
|
|
| 13-Mar-03 |
131 |
|
|
|
|
|
|
|
|
|
|
|
|
|
|
|
|
|
|
| 14-Mar-03 |
137 |
|
|
|
|
|
|
|
|
|
|
|
|
|
|
|
|
|
|
| 15-Mar-03 |
137 |
|
|
|
|
|
|
|
|
|
|
|
|
|
|
|
|
|
|
| 16-Mar-03 |
146 |
|
|
|
|
|
|
|
|
|
|
|
|
|
|
|
|
|
|
| 17-Mar-03 |
133 |
|
|
|
|
|
|
|
|
|
|
|
|
|
|
|
|
|
|
| 18-Mar-03 |
127 |
|
|
|
|
|
|
|
|
|
|
|
|
|
|
|
|
|
|
| 19-Mar-03 |
126 |
|
|
|
|
|
|
|
|
|
|
|
|
|
|
|
|
|
|
| 20-Mar-03 |
111 |
|
|
|
|
|
|
|
|
|
|
|
|
|
|
|
|
|
|
| 21-Mar-03 |
113 |
|
|
|
|
|
|
|
|
|
|
|
|
|
|
|
|
|
|
| 22-Mar-03 |
109 |
|
|
|
|
|
|
|
|
|
|
|
|
|
|
|
|
|
|
| 23-Mar-03 |
110 |
|
|
|
|
|
|
|
|
|
|
|
|
|
|
|
|
|
|
| 24-Mar-03 |
98 |
|
|
|
|
|
|
|
|
|
|
|
|
|
|
|
|
|
|
| 25-Mar-03 |
129 |
|
|
|
|
|
|
|
|
|
|
|
|
|
|
|
|
|
|
| 26-Mar-03 |
131 |
|
|
|
|
|
|
|
|
|
|
|
|
|
|
|
|
|
|
| 27-Mar-03 |
125 |
|
|
|
|
|
|
|
|
|
|
|
|
|
|
|
|
|
|
| 28-Mar-03 |
139 |
|
|
|
|
|
|
|
|
|
|
|
|
|
|
|
|
|
|
| 29-Mar-03 |
139 |
|
|
|
|
|
|
|
|
|
|
|
|
|
|
|
|
|
|
| 30-Mar-03 |
130 |
|
|
|
|
|
|
|
|
|
|
|
|
|
|
|
|
|
|
| 31-Mar-03 |
134 |
|
|
|
|
|
|
|
|
|
|
|
|
|
|
|
|
|
|
| 1-Apr-03 |
150 |
|
|
|
|
|
|
|
|
|
|
|
|
|
|
|
|
|
|
| 2-Apr-03 |
153 |
|
|
|
|
|
|
|
|
|
|
|
|
|
|
|
|
|
|
| 3-Apr-03 |
158 |
|
|
|
|
|
|
|
|
|
|
|
|
|
|
|
|
|
|
| 4-Apr-03 |
136 |
|
|
|
|
|
|
|
|
|
|
|
|
|
|
|
|
|
|
| 5-Apr-03 |
135 |
|
|
|
|
|
|
|
|
|
|
|
|
|
|
|
|
|
|
| 6-Apr-03 |
123 |
|
|
|
|
|
|
|
|
|
|
|
|
|
|
|
|
|
|
| 7-Apr-03 |
125 |
|
|
|
|
|
|
|
|
|
|
|
|
|
|
|
|
|
|
| 8-Apr-03 |
130 |
|
|
|
|
|
|
|
|
|
|
|
|
|
|
|
|
|
|
| 9-Apr-03 |
128 |
|
|
|
|
|
|
|
|
|
|
|
|
|
|
|
|
|
|
| 10-Apr-03 |
136 |
|
|
|
|
|
|
|
|
|
|
|
|
|
|
|
|
|
|
| 11-Apr-03 |
144 |
|
|
|
|
|
|
|
|
|
|
|
|
|
|
|
|
|
|
| 12-Apr-03 |
145 |
|
|
|
|
|
|
|
|
|
|
|
|
|
|
|
|
|
|
| 13-Apr-03 |
159 |
|
|
|
|
|
|
|
|
|
|
|
|
|
|
|
|
|
|
| 14-Apr-03 |
160 |
|
|
|
|
|
|
|
|
|
|
|
|
|
|
|
|
|
|
| 15-Apr-03 |
154 |
|
|
|
|
|
|
|
|
|
|
|
|
|
|
|
|
|
|
| 16-Apr-03 |
168 |
|
|
|
|
|
|
|
|
|
|
|
|
|
|
|
|
|
|
| 17-Apr-03 |
171 |
|
|
|
|
|
|
|
|
|
|
|
|
|
|
|
|
|
|
| 18-Apr-03 |
189 |
|
|
|
|
|
|
|
|
|
|
|
|
|
|
|
|
|
|
| 19-Apr-03 |
196 |
|
|
|
|
|
|
|
|
|
|
|
|
|
|
|
|
|
|
| 20-Apr-03 |
203 |
|
|
|
|
|
|
|
|
|
|
|
|
|
|
|
|
|
|
| 21-Apr-03 |
203 |
|
|
|
|
|
|
|
|
|
|
|
|
|
|
|
|
|
|
| 22-Apr-03 |
202 |
|
|
|
|
|
|
|
|
|
|
|
|
|
|
|
|
|
|
| 23-Apr-03 |
212 |
|
|
|
|
|
|
|
|
|
|
|
|
|
|
|
|
|
|
| 24-Apr-03 |
222 |
|
|
|
|
|
|
|
|
|
|
|
|
|
|
|
|
|
|
| 25-Apr-03 |
215 |
|
|
|
|
|
|
|
|
|
|
|
|
|
|
|
|
|
|
| 26-Apr-03 |
229 |
|
|
|
|
|
|
|
|
|
|
|
|
|
|
|
|
|
|
| 27-Apr-03 |
193 |
|
|
|
|
|
|
|
|
|
|
|
|
|
|
|
|
|
|
| 28-Apr-03 |
190 |
|
|
|
|
|
|
|
|
|
|
|
|
|
|
|
|
|
|
| 29-Apr-03 |
200 |
|
|
|
|
|
|
|
|
|
|
|
|
|
|
|
|
|
|
| 30-Apr-03 |
197 |
|
|
|
|
|
|
|
|
|
|
|
|
|
|
|
|
|
|
| 1-May-03 |
220 |
|
|
|
|
|
|
|
|
|
|
|
|
|
|
|
|
|
|
| 2-May-03 |
220 |
|
|
|
|
|
|
|
|
|
|
|
|
|
|
|
|
|
|
| 3-May-03 |
217 |
|
|
|
|
|
|
|
|
|
|
|
|
|
|
|
|
|
|
| 4-May-03 |
223 |
|
|
|
|
|
|
|
|
|
|
|
|
|
|
|
|
|
|
| 5-May-03 |
244 |
|
|
|
|
|
|
|
|
|
|
|
|
|
|
|
|
|
|
| 6-May-03 |
250 |
|
|
|
|
|
|
|
|
|
|
|
|
|
|
|
|
|
|
| 7-May-03 |
265 |
|
|
|
|
|
|
|
|
|
|
|
|
|
|
|
|
|
|
| 8-May-03 |
272 |
|
|
|
|
|
|
|
|
|
|
|
|
|
|
|
|
|
|
| 9-May-03 |
277 |
|
|
|
|
|
|
|
|
|
|
|
|
|
|
|
|
|
|
| 10-May-03 |
298 |
|
|
|
|
|
|
|
|
|
|
|
|
|
|
|
|
|
|
| 11-May-03 |
296 |
|
|
|
|
|
|
|
|
|
|
|
|
|
|
|
|
|
|
| 12-May-03 |
279 |
|
|
|
|
|
|
|
|
|
|
|
|
|
|
|
|
|
|
| 13-May-03 |
277 |
|
|
|
|
|
|
|
|
|
|
|
|
|
|
|
|
|
|
| 14-May-03 |
268 |
|
|
|
|
|
|
|
|
|
|
|
|
|
|
|
|
|
|
| 15-May-03 |
265 |
|
|
|
|
|
|
|
|
|
|
|
|
|
|
|
|
|
|
| 16-May-03 |
267 |
|
|
|
|
|
|
|
|
|
|
|
|
|
|
|
|
|
|
| 17-May-03 |
262 |
|
|
|
|
|
|
|
|
|
|
|
|
|
|
|
|
|
|
| 18-May-03 |
244 |
|
|
|
|
|
|
|
|
|
|
|
|
|
|
|
|
|
|
| 19-May-03 |
230 |
|
|
|
|
|
|
|
|
|
|
|
|
|
|
|
|
|
|
| 20-May-03 |
213 |
|
|
|
|
|
|
|
|
|
|
|
|
|
|
|
|
|
|
| 21-May-03 |
199 |
|
|
|
|
|
|
|
|
|
|
|
|
|
|
|
|
|
|
| 22-May-03 |
198 |
|
|
|
|
|
|
|
|
|
|
|
|
|
|
|
|
|
|
| 23-May-03 |
205 |
|
|
|
|
|
|
|
|
|
|
|
|
|
|
|
|
|
|
| 24-May-03 |
210 |
|
|
|
|
|
|
|
|
|
|
|
|
|
|
|
|
|
|
| 25-May-03 |
212 |
|
|
|
|
|
|
|
|
|
|
|
|
|
|
|
|
|
|
| 26-May-03 |
216 |
|
|
|
|
|
|
|
|
|
|
|
|
|
|
|
|
|
|
| 27-May-03 |
214 |
|
|
|
|
|
|
|
|
|
|
|
|
|
|
|
|
|
|
| 28-May-03 |
227 |
|
|
|
|
|
|
|
|
|
|
|
|
|
|
|
|
|
|
| 29-May-03 |
235 |
|
|
|
|
|
|
|
|
|
|
|
|
|
|
|
|
|
|
| 30-May-03 |
235 |
|
|
|
|
|
|
|
|
|
|
|
|
|
|
|
|
|
|
| 31-May-03 |
236 |
|
|
|
|
|
|
|
|
|
|
|
|
|
|
|
|
|
|
| 1-Jun-03 |
236 |
|
|
|
|
|
|
|
|
|
|
|
|
|
|
|
|
|
|
| 2-Jun-03 |
245 |
|
|
|
|
|
|
|
|
|
|
|
|
|
|
|
|
|
|
| 3-Jun-03 |
248 |
|
|
|
|
|
|
|
|
|
|
|
|
|
|
|
|
|
|
| 4-Jun-03 |
240 |
|
|
|
|
|
|
|
|
|
|
|
|
|
|
|
|
|
|
| 5-Jun-03 |
245 |
|
|
|
|
|
|
|
|
|
|
|
|
|
|
|
|
|
|
| 6-Jun-03 |
217 |
|
|
|
|
|
|
|
|
|
|
|
|
|
|
|
|
|
|
| 7-Jun-03 |
219 |
|
|
|
|
|
|
|
|
|
|
|
|
|
|
|
|
|
|
| 8-Jun-03 |
228 |
|
|
|
|
|
|
|
|
|
|
|
|
|
|
|
|
|
|
| 9-Jun-03 |
214 |
|
|
|
|
|
|
|
|
|
|
|
|
|
|
|
|
|
|
| 10-Jun-03 |
222 |
|
|
|
|
|
|
|
|
|
|
|
|
|
|
|
|
|
|
| 11-Jun-03 |
229 |
|
|
|
|
|
|
|
|
|
|
|
|
|
|
|
|
|
|
| 12-Jun-03 |
224 |
|
|
|
|
|
|
|
|
|
|
|
|
|
|
|
|
|
|
| 13-Jun-03 |
226 |
|
|
|
|
|
|
|
|
|
|
|
|
|
|
|
|
|
|
| 14-Jun-03 |
236 |
|
|
|
|
|
|
|
|
|
|
|
|
|
|
|
|
|
|
| 15-Jun-03 |
229 |
|
|
|
|
|
|
|
|
|
|
|
|
|
|
|
|
|
|
| 16-Jun-03 |
226 |
|
|
|
|
|
|
|
|
|
|
|
|
|
|
|
|
|
|
| 17-Jun-03 |
230 |
|
|
|
|
|
|
|
|
|
|
|
|
|
|
|
|
|
|
| 18-Jun-03 |
214 |
|
|
|
|
|
|
|
|
|
|
|
|
|
|
|
|
|
|
| 19-Jun-03 |
213 |
|
|
|
|
|
|
|
|
|
|
|
|
|
|
|
|
|
|
| 20-Jun-03 |
220 |
|
|
|
|
|
|
|
|
|
|
|
|
|
|
|
|
|
|
| 21-Jun-03 |
265 |
|
|
|
|
|
|
|
|
|
|
|
|
|
|
|
|
|
|
| 22-Jun-03 |
256 |
|
|
|
|
|
|
|
|
|
|
|
|
|
|
|
|
|
|
| 23-Jun-03 |
261 |
|
|
|
|
|
|
|
|
|
|
|
|
|
|
|
|
|
|
| 24-Jun-03 |
266 |
|
|
|
|
|
|
|
|
|
|
|
|
|
|
|
|
|
|
| 25-Jun-03 |
267 |
|
|
|
|
|
|
|
|
|
|
|
|
|
|
|
|
|
|
| 26-Jun-03 |
274 |
|
|
|
|
|
|
|
|
|
|
|
|
|
|
|
|
|
|
| 27-Jun-03 |
266 |
|
|
|
|
|
|
|
|
|
|
|
|
|
|
|
|
|
|
| 28-Jun-03 |
272 |
|
|
|
|
|
|
|
|
|
|
|
|
|
|
|
|
|
|
| 29-Jun-03 |
287 |
|
|
|
|
|
|
|
|
|
|
|
|
|
|
|
|
|
|
| 30-Jun-03 |
276 |
|
|
|
|
|
|
|
|
|
|
|
|
|
|
|
|
|
|
| 1-Jul-03 |
264 |
|
|
|
|
|
|
|
|
|
|
|
|
|
|
|
|
|
|
| 2-Jul-03 |
245 |
|
|
|
|
|
|
|
|
|
|
|
|
|
|
|
|
|
|
| 3-Jul-03 |
228 |
|
|
|
|
|
|
|
|
|
|
|
|
|
|
|
|
|
|
| 4-Jul-03 |
244 |
|
|
|
|
|
|
|
|
|
|
|
|
|
|
|
|
|
|
| 5-Jul-03 |
260 |
|
|
|
|
|
|
|
|
|
|
|
|
|
|
|
|
|
|
| 6-Jul-03 |
254 |
|
|
|
|
|
|
|
|
|
|
|
|
|
|
|
|
|
|
| 7-Jul-03 |
244 |
|
|
|
|
|
|
|
|
|
|
|
|
|
|
|
|
|
|
| 8-Jul-03 |
228 |
|
|
|
|
|
|
|
|
|
|
|
|
|
|
|
|
|
|
| 9-Jul-03 |
221 |
|
|
|
|
|
|
|
|
|
|
|
|
|
|
|
|
|
|
| 10-Jul-03 |
227 |
|
|
|
|
|
|
|
|
|
|
|
|
|
|
|
|
|
|
| 11-Jul-03 |
218 |
|
|
|
|
|
|
|
|
|
|
|
|
|
|
|
|
|
|
| 12-Jul-03 |
209 |
|
|
|
|
|
|
|
|
|
|
|
|
|
|
|
|
|
|
| 13-Jul-03 |
201 |
|
|
|
|
|
|
|
|
|
|
|
|
|
|
|
|
|
|
| 14-Jul-03 |
186 |
|
|
|
|
|
|
|
|
|
|
|
|
|
|
|
|
|
|
| 15-Jul-03 |
187 |
|
|
|
|
|
|
|
|
|
|
|
|
|
|
|
|
|
|
| 16-Jul-03 |
190 |
|
|
|
|
|
|
|
|
|
|
|
|
|
|
|
|
|
|
| 17-Jul-03 |
186 |
|
|
|
|
|
|
|
|
|
|
|
|
|
|
|
|
|
|
| 18-Jul-03 |
200 |
|
|
|
|
|
|
|
|
|
|
|
|
|
|
|
|
|
|
| 19-Jul-03 |
196 |
|
|
|
|
|
|
|
|
|
|
|
|
|
|
|
|
|
|
| 20-Jul-03 |
198 |
|
|
|
|
|
|
|
|
|
|
|
|
|
|
|
|
|
|
| 21-Jul-03 |
191 |
|
|
|
|
|
|
|
|
|
|
|
|
|
|
|
|
|
|
| 22-Jul-03 |
186 |
|
|
|
|
|
|
|
|
|
|
|
|
|
|
|
|
|
|
| 23-Jul-03 |
198 |
|
|
|
|
|
|
|
|
|
|
|
|
|
|
|
|
|
|
| 24-Jul-03 |
211 |
|
|
|
|
|
|
|
|
|
|
|
|
|
|
|
|
|
|
| 25-Jul-03 |
208 |
|
|
|
|
|
|
|
|
|
|
|
|
|
|
|
|
|
|
| 26-Jul-03 |
188 |
|
|
|
|
|
|
|
|
|
|
|
|
|
|
|
|
|
|
| 27-Jul-03 |
189 |
|
|
|
|
|
|
|
|
|
|
|
|
|
|
|
|
|
|
| 28-Jul-03 |
166 |
|
|
|
|
|
|
|
|
|
|
|
|
|
|
|
|
|
|
| 29-Jul-03 |
175 |
|
|
|
|
|
|
|
|
|
|
|
|
|
|
|
|
|
|
| 30-Jul-03 |
199 |
|
|
|
|
|
|
|
|
|
|
|
|
|
|
|
|
|
|
| 31-Jul-03 |
173 |
|
|
|
|
|
|
|
|
|
|
|
|
|
|
|
|
|
|
| 1-Aug-03 |
160 |
|
|
|
|
|
|
|
|
|
|
|
|
|
|
|
|
|
|
| 2-Aug-03 |
149 |
|
|
|
|
|
|
|
|
|
|
|
|
|
|
|
|
|
|
| 3-Aug-03 |
130 |
|
|
|
|
|
|
|
|
|
|
|
|
|
|
|
|
|
|
| 4-Aug-03 |
128 |
|
|
|
|
|
|
|
|
|
|
|
|
|
|
|
|
|
|
| 5-Aug-03 |
127 |
|
|
|
|
|
|
|
|
|
|
|
|
|
|
|
|
|
|
| 6-Aug-03 |
109 |
|
|
|
|
|
|
|
|
|
|
|
|
|
|
|
|
|
|
| 7-Aug-03 |
116 |
|
|
|
|
|
|
|
|
|
|
|
|
|
|
|
|
|
|
| 8-Aug-03 |
111 |
|
|
|
|
|
|
|
|
|
|
|
|
|
|
|
|
|
|
| 9-Aug-03 |
105 |
|
|
|
|
|
|
|
|
|
|
|
|
|
|
|
|
|
|
| 10-Aug-03 |
116 |
|
|
|
|
|
|
|
|
|
|
|
|
|
|
|
|
|
|
| 11-Aug-03 |
92 |
|
|
|
|
|
|
|
|
|
|
|
|
|
|
|
|
|
|
| 12-Aug-03 |
90 |
|
|
|
|
|
|
|
|
|
|
|
|
|
|
|
|
|
|
| 13-Aug-03 |
89 |
|
|
|
|
|
|
|
|
|
|
|
|
|
|
|
|
|
|
| 14-Aug-03 |
96 |
|
|
|
|
|
|
|
|
|
|
|
|
|
|
|
|
|
|
| 15-Aug-03 |
105 |
|
|
|
|
|
|
|
|
|
|
|
|
|
|
|
|
|
|
| 16-Aug-03 |
114 |
|
|
|
|
|
|
|
|
|
|
|
|
|
|
|
|
|
|
| 17-Aug-03 |
128 |
|
|
|
|
|
|
|
|
|
|
|
|
|
|
|
|
|
|
| 18-Aug-03 |
133 |
|
|
|
|
|
|
|
|
|
|
|
|
|
|
|
|
|
|
| 19-Aug-03 |
150 |
|
|
|
|
|
|
|
|
|
|
|
|
|
|
|
|
|
|
| 20-Aug-03 |
153 |
|
|
|
|
|
|
|
|
|
|
|
|
|
|
|
|
|
|
| 21-Aug-03 |
149 |
|
|
|
|
|
|
|
|
|
|
|
|
|
|
|
|
|
|
| 22-Aug-03 |
136 |
|
|
|
|
|
|
|
|
|
|
|
|
|
|
|
|
|
|
| 23-Aug-03 |
124 |
|
|
|
|
|
|
|
|
|
|
|
|
|
|
|
|
|
|
| 24-Aug-03 |
122 |
|
|
|
|
|
|
|
|
|
|
|
|
|
|
|
|
|
|
| 25-Aug-03 |
105 |
|
|
|
|
|
|
|
|
|
|
|
|
|
|
|
|
|
|
| 26-Aug-03 |
99 |
|
|
|
|
|
|
|
|
|
|
|
|
|
|
|
|
|
|
| 27-Aug-03 |
91 |
|
|
|
|
|
|
|
|
|
|
|
|
|
|
|
|
|
|
| 28-Aug-03 |
81 |
|
|
|
|
|
|
|
|
|
|
|
|
|
|
|
|
|
|
| 29-Aug-03 |
80 |
|
|
|
|
|
|
|
|
|
|
|
|
|
|
|
|
|
|
| 30-Aug-03 |
108 |
|
|
|
|
|
|
|
|
|
|
|
|
|
|
|
|
|
|
| 31-Aug-03 |
95 |
|
|
|
|
|
|
|
|
|
|
|
|
|
|
|
|
|
|
| 1-Sep-03 |
62 |
|
|
|
|
|
|
|
|
|
|
|
|
|
|
|
|
|
|
| 2-Sep-03 |
76 |
|
|
|
|
|
|
|
|
|
|
|
|
|
|
|
|
|
|
| 3-Sep-03 |
61 |
|
|
|
|
|
|
|
|
|
|
|
|
|
|
|
|
|
|
| 4-Sep-03 |
77 |
|
|
|
|
|
|
|
|
|
|
|
|
|
|
|
|
|
|
| 5-Sep-03 |
102 |
|
|
|
|
|
|
|
|
|
|
|
|
|
|
|
|
|
|
| 6-Sep-03 |
101 |
|
|
|
|
|
|
|
|
|
|
|
|
|
|
|
|
|
|
| 7-Sep-03 |
97 |
|
|
|
|
|
|
|
|
|
|
|
|
|
|
|
|
|
|
| 8-Sep-03 |
82 |
|
|
|
|
|
|
|
|
|
|
|
|
|
|
|
|
|
|
| 9-Sep-03 |
74 |
|
|
|
|
|
|
|
|
|
|
|
|
|
|
|
|
|
|
| 10-Sep-03 |
48 |
|
|
|
|
|
|
|
|
|
|
|
|
|
|
|
|
|
|
| 11-Sep-03 |
47 |
|
|
|
|
|
|
|
|
|
|
|
|
|
|
|
|
|
|
| 12-Sep-03 |
38 |
|
|
|
|
|
|
|
|
|
|
|
|
|
|
|
|
|
|
| 13-Sep-03 |
37 |
|
|
|
|
|
|
|
|
|
|
|
|
|
|
|
|
|
|
| 14-Sep-03 |
49 |
|
|
|
|
|
|
|
|
|
|
|
|
|
|
|
|
|
|
| 15-Sep-03 |
50 |
|
|
|
|
|
|
|
|
|
|
|
|
|
|
|
|
|
|
| 16-Sep-03 |
79 |
|
|
|
|
|
|
|
|
|
|
|
|
|
|
|
|
|
|
| 17-Sep-03 |
105 |
|
|
|
|
|
|
|
|
|
|
|
|
|
|
|
|
|
|
| 18-Sep-03 |
106 |
|
|
|
|
|
|
|
|
|
|
|
|
|
|
|
|
|
|
| 19-Sep-03 |
113 |
|
|
|
|
|
|
|
|
|
|
|
|
|
|
|
|
|
|
| 20-Sep-03 |
123 |
|
|
|
|
|
|
|
|
|
|
|
|
|
|
|
|
|
|
| 21-Sep-03 |
113 |
|
|
|
|
|
|
|
|
|
|
|
|
|
|
|
|
|
|
| 22-Sep-03 |
112 |
|
|
|
|
|
|
|
|
|
|
|
|
|
|
|
|
|
|
| 23-Sep-03 |
115 |
|
|
|
|
|
|
|
|
|
|
|
|
|
|
|
|
|
|
| 24-Sep-03 |
94 |
|
|
|
|
|
|
|
|
|
|
|
|
|
|
|
|
|
|
| 25-Sep-03 |
95 |
|
|
|
|
|
|
|
|
|
|
|
|
|
|
|
|
|
|
| 26-Sep-03 |
87 |
|
|
|
|
|
|
|
|
|
|
|
|
|
|
|
|
|
|
| 27-Sep-03 |
94 |
|
|
|
|
|
|
|
|
|
|
|
|
|
|
|
|
|
|
| 28-Sep-03 |
111 |
|
|
|
|
|
|
|
|
|
|
|
|
|
|
|
|
|
|
| 29-Sep-03 |
126 |
|
|
|
|
|
|
|
|
|
|
|
|
|
|
|
|
|
|
| 30-Sep-03 |
146 |
|
|
|
|
|
|
|
|
|
|
|
|
|
|
|
|
|
|
| 1-Oct-03 |
132 |
|
|
|
|
|
|
|
|
|
|
|
|
|
|
|
|
|
|
| 2-Oct-03 |
119 |
|
|
|
|
|
|
|
|
|
|
|
|
|
|
|
|
|
|
| 3-Oct-03 |
103 |
|
|
|
|
|
|
|
|
|
|
|
|
|
|
|
|
|
|
| 4-Oct-03 |
91 |
|
|
|
|
|
|
|
|
|
|
|
|
|
|
|
|
|
|
| 5-Oct-03 |
66 |
|
|
|
|
|
|
|
|
|
|
|
|
|
|
|
|
|
|
| 6-Oct-03 |
45 |
|
|
|
|
|
|
|
|
|
|
|
|
|
|
|
|
|
|
| 7-Oct-03 |
25 |
|
|
|
|
|
|
|
|
|
|
|
|
|
|
|
|
|
|
| 8-Oct-03 |
34 |
|
|
|
|
|
|
|
|
|
|
|
|
|
|
|
|
|
|
| 9-Oct-03 |
50 |
|
|
|
|
|
|
|
|
|
|
|
|
|
|
|
|
|
|
| 10-Oct-03 |
65 |
|
|
|
|
|
|
|
|
|
|
|
|
|
|
|
|
|
|
| 11-Oct-03 |
69 |
|
|
|
|
|
|
|
|
|
|
|
|
|
|
|
|
|
|
| 12-Oct-03 |
58 |
|
|
|
|
|
|
|
|
|
|
|
|
|
|
|
|
|
|
| 13-Oct-03 |
65 |
|
|
|
|
|
|
|
|
|
|
|
|
|
|
|
|
|
|
| 14-Oct-03 |
70 |
|
|
|
|
|
|
|
|
|
|
|
|
|
|
|
|
|
|
| 15-Oct-03 |
73 |
|
|
|
|
|
|
|
|
|
|
|
|
|
|
|
|
|
|
| 16-Oct-03 |
78 |
|
|
|
|
|
|
|
|
|
|
|
|
|
|
|
|
|
|
| 17-Oct-03 |
69 |
|
|
|
|
|
|
|
|
|
|
|
|
|
|
|
|
|
|
| 18-Oct-03 |
73 |
|
|
|
|
|
|
|
|
|
|
|
|
|
|
|
|
|
|
| 19-Oct-03 |
100 |
|
|
|
|
|
|
|
|
|
|
|
|
|
|
|
|
|
|
| 20-Oct-03 |
107 |
|
|
|
|
|
|
|
|
|
|
|
|
|
|
|
|
|
|
| 21-Oct-03 |
121 |
|
|
|
|
|
|
|
|
|
|
|
|
|
|
|
|
|
|
| 22-Oct-03 |
113 |
|
|
|
|
|
|
|
|
|
|
|
|
|
|
|
|
|
|
| 23-Oct-03 |
94 |
|
|
|
|
|
|
|
|
|
|
|
|
|
|
|
|
|
|
| 24-Oct-03 |
78 |
|
|
|
|
|
|
|
|
|
|
|
|
|
|
|
|
|
|
| 25-Oct-03 |
80 |
|
|
|
|
|
|
|
|
|
|
|
|
|
|
|
|
|
|
| 26-Oct-03 |
97 |
|
|
|
|
|
|
|
|
|
|
|
|
|
|
|
|
|
|
| 27-Oct-03 |
113 |
|
|
|
|
|
|
|
|
|
|
|
|
|
|
|
|
|
|
| 28-Oct-03 |
112 |
|
|
|
|
|
|
|
|
|
|
|
|
|
|
|
|
|
|
| 29-Oct-03 |
96 |
|
|
|
|
|
|
|
|
|
|
|
|
|
|
|
|
|
|
| 30-Oct-03 |
96 |
|
|
|
|
|
|
|
|
|
|
|
|
|
|
|
|
|
|
| 31-Oct-03 |
88 |
|
|
|
|
|
|
|
|
|
|
|
|
|
|
|
|
|
|
| 1-Nov-03 |
104 |
|
|
|
|
|
|
|
|
|
|
|
|
|
|
|
|
|
|
| 2-Nov-03 |
148 |
|
|
|
|
|
|
|
|
|
|
|
|
|
|
|
|
|
|
| 3-Nov-03 |
|
|
|
|
|
|
|
|
|
|
|
|
|
|
|
|
|
|
|
| 4-Nov-03 |
|
|
|
|
|
|
|
|
|
|
|
|
|
|
|
|
|
|
|
| 5-Nov-03 |
|
|
|
|
|
|
|
|
|
|
|
|
|
|
|
|
|
|
|
| 6-Nov-03 |
|
|
|
|
|
|
|
|
|
|
|
|
|
|
|
|
|
|
|
| 7-Nov-03 |
|
|
|
|
|
|
|
|
|
|
|
|
|
|
|
|
|
|
|
| 8-Nov-03 |
75 |
|
|
|
|
|
|
|
|
|
|
|
|
|
|
|
|
|
|
| 9-Nov-03 |
86 |
|
|
|
|
|
|
|
|
|
|
|
|
|
|
|
|
|
|
| 10-Nov-03 |
101 |
|
|
|
|
|
|
|
|
|
|
|
|
|
|
|
|
|
|
| 11-Nov-03 |
105 |
|
|
|
|
|
|
|
|
|
|
|
|
|
|
|
|
|
|
| 12-Nov-03 |
109 |
|
|
|
|
|
|
|
|
|
|
|
|
|
|
|
|
|
|
| 13-Nov-03 |
115 |
|
|
|
|
|
|
|
|
|
|
|
|
|
|
|
|
|
|
| 14-Nov-03 |
111 |
|
|
|
|
|
|
|
|
|
|
|
|
|
|
|
|
|
|
| 15-Nov-03 |
110 |
|
|
|
|
|
|
|
|
|
|
|
|
|
|
|
|
|
|
| 16-Nov-03 |
109 |
|
|
|
|
|
|
|
|
|
|
|
|
|
|
|
|
|
|
| 17-Nov-03 |
103 |
|
|
|
|
|
|
|
|
|
|
|
|
|
|
|
|
|
|
| 18-Nov-03 |
90 |
|
|
|
|
|
|
|
|
|
|
|
|
|
|
|
|
|
|
| 19-Nov-03 |
91 |
|
|
|
|
|
|
|
|
|
|
|
|
|
|
|
|
|
|
| 20-Nov-03 |
92 |
|
|
|
|
|
|
|
|
|
|
|
|
|
|
|
|
|
|
| 21-Nov-03 |
90 |
|
|
|
|
|
|
|
|
|
|
|
|
|
|
|
|
|
|
| 22-Nov-03 |
98 |
|
|
|
|
|
|
|
|
|
|
|
|
|
|
|
|
|
|
| 23-Nov-03 |
109 |
|
|
|
|
|
|
|
|
|
|
|
|
|
|
|
|
|
|
| 24-Nov-03 |
91 |
|
|
|
|
|
|
|
|
|
|
|
|
|
|
|
|
|
|
| 25-Nov-03 |
94 |
|
|
|
|
|
|
|
|
|
|
|
|
|
|
|
|
|
|
| 26-Nov-03 |
98 |
|
|
|
|
|
|
|
|
|
|
|
|
|
|
|
|
|
|
| 27-Nov-03 |
85 |
|
|
|
|
|
|
|
|
|
|
|
|
|
|
|
|
|
|
| 28-Nov-03 |
120 |
|
|
|
|
|
|
|
|
|
|
|
|
|
|
|
|
|
|
| 29-Nov-03 |
111 |
|
|
|
|
|
|
|
|
|
|
|
|
|
|
|
|
|
|
| 30-Nov-03 |
107 |
|
|
|
|
|
|
|
|
|
|
|
|
|
|
|
|
|
|
| 1-Dec-03 |
109 |
|
|
|
|
|
|
|
|
|
|
|
|
|
|
|
|
|
|
| 2-Dec-03 |
101 |
|
|
|
|
|
|
|
|
|
|
|
|
|
|
|
|
|
|
| 3-Dec-03 |
112 |
|
|
|
|
|
|
|
|
|
|
|
|
|
|
|
|
|
|
| 4-Dec-03 |
116 |
|
|
|
|
|
|
|
|
|
|
|
|
|
|
|
|
|
|
| 5-Dec-03 |
127 |
|
|
|
|
|
|
|
|
|
|
|
|
|
|
|
|
|
|
| 6-Dec-03 |
113 |
|
|
|
|
|
|
|
|
|
|
|
|
|
|
|
|
|
|
| 7-Dec-03 |
108 |
|
|
|
|
|
|
|
|
|
|
|
|
|
|
|
|
|
|
| 8-Dec-03 |
111 |
|
|
|
|
|
|
|
|
|
|
|
|
|
|
|
|
|
|
| 9-Dec-03 |
112 |
|
|
|
|
|
|
|
|
|
|
|
|
|
|
|
|
|
|
| 10-Dec-03 |
125 |
|
|
|
|
|
|
|
|
|
|
|
|
|
|
|
|
|
|
| 11-Dec-03 |
122 |
|
|
|
|
|
|
|
|
|
|
|
|
|
|
|
|
|
|
| 12-Dec-03 |
117 |
|
|
|
|
|
|
|
|
|
|
|
|
|
|
|
|
|
|
| 13-Dec-03 |
115 |
|
|
|
|
|
|
|
|
|
|
|
|
|
|
|
|
|
|
| 14-Dec-03 |
103 |
|
|
|
|
|
|
|
|
|
|
|
|
|
|
|
|
|
|
| 15-Dec-03 |
121 |
|
|
|
|
|
|
|
|
|
|
|
|
|
|
|
|
|
|
| 16-Dec-03 |
126 |
|
|
|
|
|
|
|
|
|
|
|
|
|
|
|
|
|
|
| 17-Dec-03 |
133 |
|
|
|
|
|
|
|
|
|
|
|
|
|
|
|
|
|
|
| 18-Dec-03 |
142 |
|
|
|
|
|
|
|
|
|
|
|
|
|
|
|
|
|
|
| 19-Dec-03 |
137 |
|
|
|
|
|
|
|
|
|
|
|
|
|
|
|
|
|
|
| 20-Dec-03 |
128 |
|
|
|
|
|
|
|
|
|
|
|
|
|
|
|
|
|
|
| 21-Dec-03 |
99 |
|
|
|
|
|
|
|
|
|
|
|
|
|
|
|
|
|
|
| 22-Dec-03 |
116 |
|
|
|
|
|
|
|
|
|
|
|
|
|
|
|
|
|
|
| 23-Dec-03 |
127 |
|
|
|
|
|
|
|
|
|
|
|
|
|
|
|
|
|
|
| 24-Dec-03 |
137 |
|
|
|
|
|
|
|
|
|
|
|
|
|
|
|
|
|
|
| 25-Dec-03 |
165 |
|
|
|
|
|
|
|
|
|
|
|
|
|
|
|
|
|
|
| 26-Dec-03 |
139 |
|
|
|
|
|
|
|
|
|
|
|
|
|
|
|
|
|
|
| 27-Dec-03 |
125 |
|
|
|
|
|
|
|
|
|
|
|
|
|
|
|
|
|
|
| 28-Dec-03 |
114 |
|
|
|
|
|
|
|
|
|
|
|
|
|
|
|
|
|
|
| 29-Dec-03 |
88 |
|
|
|
|
|
|
|
|
|
|
|
|
|
|
|
|
|
|
| 30-Dec-03 |
103 |
|
|
|
|
|
|
|
|
|
|
|
|
|
|
|
|
|
|
| 31-Dec-03 |
104 |
|
|
|
|
|
|
|
|
|
|
|
|
|
|
|
|
|
|
| 1-Jan-04 |
98 |
|
|
|
|
|
|
|
|
|
|
|
|
|
|
|
|
|
|
| 2-Jan-04 |
121 |
|
|
|
|
|
|
|
|
|
|
|
|
|
|
|
|
|
|
| 3-Jan-04 |
114 |
|
|
|
|
|
|
|
|
|
|
|
|
|
|
|
|
|
|
| 4-Jan-04 |
116 |
|
|
|
|
|
|
|
|
|
|
|
|
|
|
|
|
|
|
| 5-Jan-04 |
121 |
|
|
|
|
|
|
|
|
|
|
|
|
|
|
|
|
|
|
| 6-Jan-04 |
125 |
|
|
|
|
|
|
|
|
|
|
|
|
|
|
|
|
|
|
| 7-Jan-04 |
112 |
|
|
|
|
|
|
|
|
|
|
|
|
|
|
|
|
|
|
| 8-Jan-04 |
119 |
|
|
|
|
|
|
|
|
|
|
|
|
|
|
|
|
|
|
| 9-Jan-04 |
129 |
|
|
|
|
|
|
|
|
|
|
|
|
|
|
|
|
|
|
| 10-Jan-04 |
129 |
|
|
|
|
|
|
|
|
|
|
|
|
|
|
|
|
|
|
| 11-Jan-04 |
129 |
|
|
|
|
|
|
|
|
|
|
|
|
|
|
|
|
|
|
| 12-Jan-04 |
131 |
|
|
|
|
|
|
|
|
|
|
|
|
|
|
|
|
|
|
| 13-Jan-04 |
129 |
|
|
|
|
|
|
|
|
|
|
|
|
|
|
|
|
|
|
| 14-Jan-04 |
107 |
|
|
|
|
|
|
|
|
|
|
|
|
|
|
|
|
|
|
| 15-Jan-04 |
115 |
|
|
|
|
|
|
|
|
|
|
|
|
|
|
|
|
|
|
| 16-Jan-04 |
90 |
|
|
|
|
|
|
|
|
|
|
|
|
|
|
|
|
|
|
| 17-Jan-04 |
87 |
|
|
|
|
|
|
|
|
|
|
|
|
|
|
|
|
|
|
| 18-Jan-04 |
114 |
|
|
|
|
|
|
|
|
|
|
|
|
|
|
|
|
|
|
| 19-Jan-04 |
118 |
|
|
|
|
|
|
|
|
|
|
|
|
|
|
|
|
|
|
| 20-Jan-04 |
142 |
|
|
|
|
|
|
|
|
|
|
|
|
|
|
|
|
|
|
| 21-Jan-04 |
155 |
|
|
|
|
|
|
|
|
|
|
|
|
|
|
|
|
|
|
| 22-Jan-04 |
139 |
|
|
|
|
|
|
|
|
|
|
|
|
|
|
|
|
|
|
| 23-Jan-04 |
147 |
|
|
|
|
|
|
|
|
|
|
|
|
|
|
|
|
|
|
| 24-Jan-04 |
153 |
|
|
|
|
|
|
|
|
|
|
|
|
|
|
|
|
|
|
| 25-Jan-04 |
157 |
|
|
|
|
|
|
|
|
|
|
|
|
|
|
|
|
|
|
| 26-Jan-04 |
147 |
|
|
|
|
|
|
|
|
|
|
|
|
|
|
|
|
|
|
| 27-Jan-04 |
167 |
|
|
|
|
|
|
|
|
|
|
|
|
|
|
|
|
|
|
| 28-Jan-04 |
170 |
|
|
|
|
|
|
|
|
|
|
|
|
|
|
|
|
|
|
| 29-Jan-04 |
152 |
|
|
|
|
|
|
|
|
|
|
|
|
|
|
|
|
|
|
| 30-Jan-04 |
163 |
|
|
|
|
|
|
|
|
|
|
|
|
|
|
|
|
|
|
| 31-Jan-04 |
132 |
|
|
|
|
|
|
|
|
|
|
|
|
|
|
|
|
|
|
| 1-Feb-04 |
130 |
|
|
|
|
|
|
|
|
|
|
|
|
|
|
|
|
|
|
| 2-Feb-04 |
140 |
|
|
|
|
|
|
|
|
|
|
|
|
|
|
|
|
|
|
| 3-Feb-04 |
135 |
|
|
|
|
|
|
|
|
|
|
|
|
|
|
|
|
|
|
| 4-Feb-04 |
138 |
|
|
|
|
|
|
|
|
|
|
|
|
|
|
|
|
|
|
| 5-Feb-04 |
125 |
|
|
|
|
|
|
|
|
|
|
|
|
|
|
|
|
|
|
| 6-Feb-04 |
120 |
|
|
|
|
|
|
|
|
|
|
|
|
|
|
|
|
|
|
| 7-Feb-04 |
122 |
|
|
|
|
|
|
|
|
|
|
|
|
|
|
|
|
|
|
| 8-Feb-04 |
159 |
|
|
|
|
|
|
|
|
|
|
|
|
|
|
|
|
|
|
| 9-Feb-04 |
162 |
|
|
|
|
|
|
|
|
|
|
|
|
|
|
|
|
|
|
| 10-Feb-04 |
157 |
|
|
|
|
|
|
|
|
|
|
|
|
|
|
|
|
|
|
| 11-Feb-04 |
154 |
|
|
|
|
|
|
|
|
|
|
|
|
|
|
|
|
|
|
| 12-Feb-04 |
128 |
|
|
|
|
|
|
|
|
|
|
|
|
|
|
|
|
|
|
| 13-Feb-04 |
108 |
|
|
|
|
|
|
|
|
|
|
|
|
|
|
|
|
|
|
| 14-Feb-04 |
108 |
|
|
|
|
|
|
|
|
|
|
|
|
|
|
|
|
|
|
| 15-Feb-04 |
118 |
|
|
|
|
|
|
|
|
|
|
|
|
|
|
|
|
|
|
| 16-Feb-04 |
121 |
|
|
|
|
|
|
|
|
|
|
|
|
|
|
|
|
|
|
| 17-Feb-04 |
138 |
|
|
|
|
|
|
|
|
|
|
|
|
|
|
|
|
|
|
| 18-Feb-04 |
148 |
|
|
|
|
|
|
|
|
|
|
|
|
|
|
|
|
|
|
| 19-Feb-04 |
131 |
|
|
|
|
|
|
|
|
|
|
|
|
|
|
|
|
|
|
| 20-Feb-04 |
118 |
|
|
|
|
|
|
|
|
|
|
|
|
|
|
|
|
|
|
| 21-Feb-04 |
106 |
|
|
|
|
|
|
|
|
|
|
|
|
|
|
|
|
|
|
| 22-Feb-04 |
90 |
|
|
|
|
|
|
|
|
|
|
|
|
|
|
|
|
|
|
| 23-Feb-04 |
100 |
|
|
|
|
|
|
|
|
|
|
|
|
|
|
|
|
|
|
| 24-Feb-04 |
122 |
|
|
|
|
|
|
|
|
|
|
|
|
|
|
|
|
|
|
| 25-Feb-04 |
132 |
|
|
|
|
|
|
|
|
|
|
|
|
|
|
|
|
|
|
| 26-Feb-04 |
128 |
|
|
|
|
|
|
|
|
|
|
|
|
|
|
|
|
|
|
| 27-Feb-04 |
136 |
|
|
|
|
|
|
|
|
|
|
|
|
|
|
|
|
|
|
| 28-Feb-04 |
136 |
|
|
|
|
|
|
|
|
|
|
|
|
|
|
|
|
|
|
| 29-Feb-04 |
125 |
|
|
|
|
|
|
|
|
|
|
|
|
|
|
|
|
|
|
| 1-Mar-04 |
132 |
|
|
|
|
|
|
|
|
|
|
|
|
|
|
|
|
|
|
| 2-Mar-04 |
126 |
|
|
|
|
|
|
|
|
|
|
|
|
|
|
|
|
|
|
| 3-Mar-04 |
120 |
|
|
|
|
|
|
|
|
|
|
|
|
|
|
|
|
|
|
| 4-Mar-04 |
119 |
|
|
|
|
|
|
|
|
|
|
|
|
|
|
|
|
|
|
| 5-Mar-04 |
123 |
|
|
|
|
|
|
|
|
|
|
|
|
|
|
|
|
|
|
| 6-Mar-04 |
103 |
|
|
|
|
|
|
|
|
|
|
|
|
|
|
|
|
|
|
| 7-Mar-04 |
119 |
|
|
|
|
|
|
|
|
|
|
|
|
|
|
|
|
|
|
| 8-Mar-04 |
121 |
|
|
|
|
|
|
|
|
|
|
|
|
|
|
|
|
|
|
| 9-Mar-04 |
116 |
|
|
|
|
|
|
|
|
|
|
|
|
|
|
|
|
|
|
| 10-Mar-04 |
130 |
|
|
|
|
|
|
|
|
|
|
|
|
|
|
|
|
|
|
| 11-Mar-04 |
127 |
|
|
|
|
|
|
|
|
|
|
|
|
|
|
|
|
|
|
| 12-Mar-04 |
133 |
|
|
|
|
|
|
|
|
|
|
|
|
|
|
|
|
|
|
| 13-Mar-04 |
146 |
|
|
|
|
|
|
|
|
|
|
|
|
|
|
|
|
|
|
| 14-Mar-04 |
153 |
|
|
|
|
|
|
|
|
|
|
|
|
|
|
|
|
|
|
| 15-Mar-04 |
154 |
|
|
|
|
|
|
|
|
|
|
|
|
|
|
|
|
|
|
| 16-Mar-04 |
149 |
|
|
|
|
|
|
|
|
|
|
|
|
|
|
|
|
|
|
| 17-Mar-04 |
142 |
|
|
|
|
|
|
|
|
|
|
|
|
|
|
|
|
|
|
| 18-Mar-04 |
130 |
|
|
|
|
|
|
|
|
|
|
|
|
|
|
|
|
|
|
| 19-Mar-04 |
133 |
|
|
|
|
|
|
|
|
|
|
|
|
|
|
|
|
|
|
| 20-Mar-04 |
136 |
|
|
|
|
|
|
|
|
|
|
|
|
|
|
|
|
|
|
| 21-Mar-04 |
133 |
|
|
|
|
|
|
|
|
|
|
|
|
|
|
|
|
|
|
| 22-Mar-04 |
140 |
|
|
|
|
|
|
|
|
|
|
|
|
|
|
|
|
|
|
| 23-Mar-04 |
131 |
|
|
|
|
|
|
|
|
|
|
|
|
|
|
|
|
|
|
| 24-Mar-04 |
127 |
|
|
|
|
|
|
|
|
|
|
|
|
|
|
|
|
|
|
| 25-Mar-04 |
129 |
|
|
|
|
|
|
|
|
|
|
|
|
|
|
|
|
|
|
| 26-Mar-04 |
131 |
|
|
|
|
|
|
|
|
|
|
|
|
|
|
|
|
|
|
| 27-Mar-04 |
123 |
|
|
|
|
|
|
|
|
|
|
|
|
|
|
|
|
|
|
| 28-Mar-04 |
130 |
|
|
|
|
|
|
|
|
|
|
|
|
|
|
|
|
|
|
| 29-Mar-04 |
131 |
|
|
|
|
|
|
|
|
|
|
|
|
|
|
|
|
|
|
| 30-Mar-04 |
130 |
|
|
|
|
|
|
|
|
|
|
|
|
|
|
|
|
|
|
| 31-Mar-04 |
132 |
|
|
|
|
|
|
|
|
|
|
|
|
|
|
|
|
|
|
| 1-Apr-04 |
129 |
|
|
|
|
|
|
|
|
|
|
|
|
|
|
|
|
|
|
| 2-Apr-04 |
129 |
|
|
|
|
|
|
|
|
|
|
|
|
|
|
|
|
|
|
| 3-Apr-04 |
134 |
|
|
|
|
|
|
|
|
|
|
|
|
|
|
|
|
|
|
| 4-Apr-04 |
147 |
|
|
|
|
|
|
|
|
|
|
|
|
|
|
|
|
|
|
| 5-Apr-04 |
152 |
|
|
|
|
|
|
|
|
|
|
|
|
|
|
|
|
|
|
| 6-Apr-04 |
147 |
|
|
|
|
|
|
|
|
|
|
|
|
|
|
|
|
|
|
| 7-Apr-04 |
162 |
|
|
|
|
|
|
|
|
|
|
|
|
|
|
|
|
|
|
| 8-Apr-04 |
167 |
|
|
|
|
|
|
|
|
|
|
|
|
|
|
|
|
|
|
| 9-Apr-04 |
171 |
|
|
|
|
|
|
|
|
|
|
|
|
|
|
|
|
|
|
| 10-Apr-04 |
186 |
|
|
|
|
|
|
|
|
|
|
|
|
|
|
|
|
|
|
| 11-Apr-04 |
157 |
|
|
|
|
|
|
|
|
|
|
|
|
|
|
|
|
|
|
| 12-Apr-04 |
150 |
|
|
|
|
|
|
|
|
|
|
|
|
|
|
|
|
|
|
| 13-Apr-04 |
156 |
|
|
|
|
|
|
|
|
|
|
|
|
|
|
|
|
|
|
| 14-Apr-04 |
153 |
|
|
|
|
|
|
|
|
|
|
|
|
|
|
|
|
|
|
| 15-Apr-04 |
154 |
|
|
|
|
|
|
|
|
|
|
|
|
|
|
|
|
|
|
| 16-Apr-04 |
158 |
|
|
|
|
|
|
|
|
|
|
|
|
|
|
|
|
|
|
| 17-Apr-04 |
154 |
|
|
|
|
|
|
|
|
|
|
|
|
|
|
|
|
|
|
| 18-Apr-04 |
153 |
|
|
|
|
|
|
|
|
|
|
|
|
|
|
|
|
|
|
| 19-Apr-04 |
174 |
|
|
|
|
|
|
|
|
|
|
|
|
|
|
|
|
|
|
| 20-Apr-04 |
172 |
|
|
|
|
|
|
|
|
|
|
|
|
|
|
|
|
|
|
| 21-Apr-04 |
169 |
|
|
|
|
|
|
|
|
|
|
|
|
|
|
|
|
|
|
| 22-Apr-04 |
167 |
|
|
|
|
|
|
|
|
|
|
|
|
|
|
|
|
|
|
| 23-Apr-04 |
135 |
|
|
|
|
|
|
|
|
|
|
|
|
|
|
|
|
|
|
| 24-Apr-04 |
146 |
|
|
|
|
|
|
|
|
|
|
|
|
|
|
|
|
|
|
| 25-Apr-04 |
145 |
|
|
|
|
|
|
|
|
|
|
|
|
|
|
|
|
|
|
| 26-Apr-04 |
163 |
|
|
|
|
|
|
|
|
|
|
|
|
|
|
|
|
|
|
| 27-Apr-04 |
207 |
|
|
|
|
|
|
|
|
|
|
|
|
|
|
|
|
|
|
| 28-Apr-04 |
211 |
|
|
|
|
|
|
|
|
|
|
|
|
|
|
|
|
|
|
| 29-Apr-04 |
221 |
|
|
|
|
|
|
|
|
|
|
|
|
|
|
|
|
|
|
| 30-Apr-04 |
220 |
|
|
|
|
|
|
|
|
|
|
|
|
|
|
|
|
|
|
| 1-May-04 |
225 |
|
|
|
|
|
|
|
|
|
|
|
|
|
|
|
|
|
|
| 2-May-04 |
219 |
|
|
|
|
|
|
|
|
|
|
|
|
|
|
|
|
|
|
| 3-May-04 |
207 |
|
|
|
|
|
|
|
|
|
|
|
|
|
|
|
|
|
|
| 4-May-04 |
214 |
|
|
|
|
|
|
|
|
|
|
|
|
|
|
|
|
|
|
| 5-May-04 |
209 |
|
|
|
|
|
|
|
|
|
|
|
|
|
|
|
|
|
|
| 6-May-04 |
212 |
|
|
|
|
|
|
|
|
|
|
|
|
|
|
|
|
|
|
| 7-May-04 |
213 |
|
|
|
|
|
|
|
|
|
|
|
|
|
|
|
|
|
|
| 8-May-04 |
201 |
|
|
|
|
|
|
|
|
|
|
|
|
|
|
|
|
|
|
| 9-May-04 |
215 |
|
|
|
|
|
|
|
|
|
|
|
|
|
|
|
|
|
|
| 10-May-04 |
212 |
|
|
|
|
|
|
|
|
|
|
|
|
|
|
|
|
|
|
| 11-May-04 |
214 |
|
|
|
|
|
|
|
|
|
|
|
|
|
|
|
|
|
|
| 12-May-04 |
230 |
|
|
|
|
|
|
|
|
|
|
|
|
|
|
|
|
|
|
| 13-May-04 |
202 |
|
|
|
|
|
|
|
|
|
|
|
|
|
|
|
|
|
|
| 14-May-04 |
195 |
|
|
|
|
|
|
|
|
|
|
|
|
|
|
|
|
|
|
| 15-May-04 |
185 |
|
|
|
|
|
|
|
|
|
|
|
|
|
|
|
|
|
|
| 16-May-04 |
181 |
|
|
|
|
|
|
|
|
|
|
|
|
|
|
|
|
|
|
| 17-May-04 |
183 |
|
|
|
|
|
|
|
|
|
|
|
|
|
|
|
|
|
|
| 18-May-04 |
179 |
|
|
|
|
|
|
|
|
|
|
|
|
|
|
|
|
|
|
| 19-May-04 |
188 |
|
|
|
|
|
|
|
|
|
|
|
|
|
|
|
|
|
|
| 20-May-04 |
182 |
|
|
|
|
|
|
|
|
|
|
|
|
|
|
|
|
|
|
| 21-May-04 |
196 |
|
|
|
|
|
|
|
|
|
|
|
|
|
|
|
|
|
|
| 22-May-04 |
208 |
|
|
|
|
|
|
|
|
|
|
|
|
|
|
|
|
|
|
| 23-May-04 |
196 |
|
|
|
|
|
|
|
|
|
|
|
|
|
|
|
|
|
|
| 24-May-04 |
181 |
|
|
|
|
|
|
|
|
|
|
|
|
|
|
|
|
|
|
| 25-May-04 |
161 |
|
|
|
|
|
|
|
|
|
|
|
|
|
|
|
|
|
|
| 26-May-04 |
157 |
|
|
|
|
|
|
|
|
|
|
|
|
|
|
|
|
|
|
| 27-May-04 |
158 |
|
|
|
|
|
|
|
|
|
|
|
|
|
|
|
|
|
|
| 28-May-04 |
160 |
|
|
|
|
|
|
|
|
|
|
|
|
|
|
|
|
|
|
| 29-May-04 |
179 |
|
|
|
|
|
|
|
|
|
|
|
|
|
|
|
|
|
|
| 30-May-04 |
191 |
|
|
|
|
|
|
|
|
|
|
|
|
|
|
|
|
|
|
| 31-May-04 |
193 |
|
|
|
|
|
|
|
|
|
|
|
|
|
|
|
|
|
|
| 1-Jun-04 |
203 |
|
|
|
|
|
|
|
|
|
|
|
|
|
|
|
|
|
|
| 2-Jun-04 |
124 |
|
|
|
|
|
|
|
|
|
|
|
|
|
|
|
|
|
|
| 3-Jun-04 |
95 |
|
|
|
|
|
|
|
|
|
|
|
|
|
|
|
|
|
|
| 4-Jun-04 |
106 |
|
|
|
|
|
|
|
|
|
|
|
|
|
|
|
|
|
|
| 5-Jun-04 |
116 |
|
|
|
|
|
|
|
|
|
|
|
|
|
|
|
|
|
|
| 6-Jun-04 |
192 |
|
|
|
|
|
|
|
|
|
|
|
|
|
|
|
|
|
|
| 7-Jun-04 |
198 |
|
|
|
|
|
|
|
|
|
|
|
|
|
|
|
|
|
|
| 8-Jun-04 |
192 |
|
|
|
|
|
|
|
|
|
|
|
|
|
|
|
|
|
|
| 9-Jun-04 |
183 |
|
|
|
|
|
|
|
|
|
|
|
|
|
|
|
|
|
|
| 10-Jun-04 |
195 |
|
|
|
|
|
|
|
|
|
|
|
|
|
|
|
|
|
|
| 11-Jun-04 |
197 |
|
|
|
|
|
|
|
|
|
|
|
|
|
|
|
|
|
|
| 12-Jun-04 |
196 |
|
|
|
|
|
|
|
|
|
|
|
|
|
|
|
|
|
|
| 13-Jun-04 |
225 |
|
|
|
|
|
|
|
|
|
|
|
|
|
|
|
|
|
|
| 14-Jun-04 |
215 |
|
|
|
|
|
|
|
|
|
|
|
|
|
|
|
|
|
|
| 15-Jun-04 |
217 |
|
|
|
|
|
|
|
|
|
|
|
|
|
|
|
|
|
|
| 16-Jun-04 |
215 |
|
|
|
|
|
|
|
|
|
|
|
|
|
|
|
|
|
|
| 17-Jun-04 |
205 |
|
|
|
|
|
|
|
|
|
|
|
|
|
|
|
|
|
|
| 18-Jun-04 |
223 |
|
|
|
|
|
|
|
|
|
|
|
|
|
|
|
|
|
|
| 19-Jun-04 |
245 |
|
|
|
|
|
|
|
|
|
|
|
|
|
|
|
|
|
|
| 20-Jun-04 |
242 |
|
|
|
|
|
|
|
|
|
|
|
|
|
|
|
|
|
|
| 21-Jun-04 |
225 |
|
|
|
|
|
|
|
|
|
|
|
|
|
|
|
|
|
|
| 22-Jun-04 |
229 |
|
|
|
|
|
|
|
|
|
|
|
|
|
|
|
|
|
|
| 23-Jun-04 |
244 |
|
|
|
|
|
|
|
|
|
|
|
|
|
|
|
|
|
|
| 24-Jun-04 |
249 |
|
|
|
|
|
|
|
|
|
|
|
|
|
|
|
|
|
|
| 25-Jun-04 |
275 |
|
|
|
|
|
|
|
|
|
|
|
|
|
|
|
|
|
|
| 26-Jun-04 |
281 |
|
|
|
|
|
|
|
|
|
|
|
|
|
|
|
|
|
|
| 27-Jun-04 |
268 |
|
|
|
|
|
|
|
|
|
|
|
|
|
|
|
|
|
|
| 28-Jun-04 |
270 |
|
|
|
|
|
|
|
|
|
|
|
|
|
|
|
|
|
|
| 29-Jun-04 |
264 |
|
|
|
|
|
|
|
|
|
|
|
|
|
|
|
|
|
|
| 30-Jun-04 |
250 |
|
|
|
|
|
|
|
|
|
|
|
|
|
|
|
|
|
|
| 1-Jul-04 |
241 |
|
|
|
|
|
|
|
|
|
|
|
|
|
|
|
|
|
|
| 2-Jul-04 |
243 |
|
|
|
|
|
|
|
|
|
|
|
|
|
|
|
|
|
|
| 3-Jul-04 |
247 |
|
|
|
|
|
|
|
|
|
|
|
|
|
|
|
|
|
|
| 4-Jul-04 |
255 |
|
|
|
|
|
|
|
|
|
|
|
|
|
|
|
|
|
|
| 5-Jul-04 |
249 |
|
|
|
|
|
|
|
|
|
|
|
|
|
|
|
|
|
|
| 6-Jul-04 |
237 |
|
|
|
|
|
|
|
|
|
|
|
|
|
|
|
|
|
|
| 7-Jul-04 |
234 |
|
|
|
|
|
|
|
|
|
|
|
|
|
|
|
|
|
|
| 8-Jul-04 |
250 |
|
|
|
|
|
|
|
|
|
|
|
|
|
|
|
|
|
|
| 9-Jul-04 |
255 |
|
|
|
|
|
|
|
|
|
|
|
|
|
|
|
|
|
|
| 10-Jul-04 |
275 |
|
|
|
|
|
|
|
|
|
|
|
|
|
|
|
|
|
|
| 11-Jul-04 |
258 |
|
|
|
|
|
|
|
|
|
|
|
|
|
|
|
|
|
|
| 12-Jul-04 |
237 |
|
|
|
|
|
|
|
|
|
|
|
|
|
|
|
|
|
|
| 13-Jul-04 |
235 |
|
|
|
|
|
|
|
|
|
|
|
|
|
|
|
|
|
|
| 14-Jul-04 |
223 |
|
|
|
|
|
|
|
|
|
|
|
|
|
|
|
|
|
|
| 15-Jul-04 |
232 |
|
|
|
|
|
|
|
|
|
|
|
|
|
|
|
|
|
|
| 16-Jul-04 |
199 |
|
|
|
|
|
|
|
|
|
|
|
|
|
|
|
|
|
|
| 17-Jul-04 |
210 |
|
|
|
|
|
|
|
|
|
|
|
|
|
|
|
|
|
|
| 18-Jul-04 |
203 |
|
|
|
|
|
|
|
|
|
|
|
|
|
|
|
|
|
|
| 19-Jul-04 |
189 |
|
|
|
|
|
|
|
|
|
|
|
|
|
|
|
|
|
|
| 20-Jul-04 |
204 |
|
|
|
|
|
|
|
|
|
|
|
|
|
|
|
|
|
|
| 21-Jul-04 |
158 |
|
|
|
|
|
|
|
|
|
|
|
|
|
|
|
|
|
|
| 22-Jul-04 |
153 |
|
|
|
|
|
|
|
|
|
|
|
|
|
|
|
|
|
|
| 23-Jul-04 |
133 |
|
|
|
|
|
|
|
|
|
|
|
|
|
|
|
|
|
|
| 24-Jul-04 |
145 |
|
|
|
|
|
|
|
|
|
|
|
|
|
|
|
|
|
|
| 25-Jul-04 |
176 |
|
|
|
|
|
|
|
|
|
|
|
|
|
|
|
|
|
|
| 26-Jul-04 |
178 |
|
|
|
|
|
|
|
|
|
|
|
|
|
|
|
|
|
|
| 27-Jul-04 |
203 |
|
|
|
|
|
|
|
|
|
|
|
|
|
|
|
|
|
|
| 28-Jul-04 |
184 |
|
|
|
|
|
|
|
|
|
|
|
|
|
|
|
|
|
|
| 29-Jul-04 |
184 |
|
|
|
|
|
|
|
|
|
|
|
|
|
|
|
|
|
|
| 30-Jul-04 |
190 |
|
|
|
|
|
|
|
|
|
|
|
|
|
|
|
|
|
|
| 31-Jul-04 |
183 |
|
|
|
|
|
|
|
|
|
|
|
|
|
|
|
|
|
|
| 1-Aug-04 |
191 |
|
|
|
|
|
|
|
|
|
|
|
|
|
|
|
|
|
|
| 2-Aug-04 |
173 |
|
|
|
|
|
|
|
|
|
|
|
|
|
|
|
|
|
|
| 3-Aug-04 |
174 |
|
|
|
|
|
|
|
|
|
|
|
|
|
|
|
|
|
|
| 4-Aug-04 |
178 |
|
|
|
|
|
|
|
|
|
|
|
|
|
|
|
|
|
|
| 5-Aug-04 |
171 |
|
|
|
|
|
|
|
|
|
|
|
|
|
|
|
|
|
|
| 6-Aug-04 |
179 |
|
|
|
|
|
|
|
|
|
|
|
|
|
|
|
|
|
|
| 7-Aug-04 |
171 |
|
|
|
|
|
|
|
|
|
|
|
|
|
|
|
|
|
|
| 8-Aug-04 |
161 |
|
|
|
|
|
|
|
|
|
|
|
|
|
|
|
|
|
|
| 9-Aug-04 |
171 |
|
|
|
|
|
|
|
|
|
|
|
|
|
|
|
|
|
|
| 10-Aug-04 |
146 |
|
|
|
|
|
|
|
|
|
|
|
|
|
|
|
|
|
|
| 11-Aug-04 |
141 |
|
|
|
|
|
|
|
|
|
|
|
|
|
|
|
|
|
|
| 12-Aug-04 |
141 |
|
|
|
|
|
|
|
|
|
|
|
|
|
|
|
|
|
|
| 13-Aug-04 |
135 |
|
|
|
|
|
|
|
|
|
|
|
|
|
|
|
|
|
|
| 14-Aug-04 |
155 |
|
|
|
|
|
|
|
|
|
|
|
|
|
|
|
|
|
|
| 15-Aug-04 |
166 |
|
|
|
|
|
|
|
|
|
|
|
|
|
|
|
|
|
|
| 16-Aug-04 |
164 |
|
|
|
|
|
|
|
|
|
|
|
|
|
|
|
|
|
|
| 17-Aug-04 |
161 |
|
|
|
|
|
|
|
|
|
|
|
|
|
|
|
|
|
|
| 18-Aug-04 |
142 |
|
|
|
|
|
|
|
|
|
|
|
|
|
|
|
|
|
|
| 19-Aug-04 |
127 |
|
|
|
|
|
|
|
|
|
|
|
|
|
|
|
|
|
|
| 20-Aug-04 |
95 |
|
|
|
|
|
|
|
|
|
|
|
|
|
|
|
|
|
|
| 21-Aug-04 |
77 |
|
|
|
|
|
|
|
|
|
|
|
|
|
|
|
|
|
|
| 22-Aug-04 |
81 |
|
|
|
|
|
|
|
|
|
|
|
|
|
|
|
|
|
|
| 23-Aug-04 |
98 |
|
|
|
|
|
|
|
|
|
|
|
|
|
|
|
|
|
|
| 24-Aug-04 |
118 |
|
|
|
|
|
|
|
|
|
|
|
|
|
|
|
|
|
|
| 25-Aug-04 |
143 |
|
|
|
|
|
|
|
|
|
|
|
|
|
|
|
|
|
|
| 26-Aug-04 |
149 |
|
|
|
|
|
|
|
|
|
|
|
|
|
|
|
|
|
|
| 27-Aug-04 |
147 |
|
|
|
|
|
|
|
|
|
|
|
|
|
|
|
|
|
|
| 28-Aug-04 |
166 |
|
|
|
|
|
|
|
|
|
|
|
|
|
|
|
|
|
|
| 29-Aug-04 |
138 |
|
|
|
|
|
|
|
|
|
|
|
|
|
|
|
|
|
|
| 30-Aug-04 |
127 |
|
|
|
|
|
|
|
|
|
|
|
|
|
|
|
|
|
|
| 31-Aug-04 |
119 |
|
|
|
|
|
|
|
|
|
|
|
|
|
|
|
|
|
|
| 1-Sep-04 |
116 |
|
|
|
|
|
|
|
|
|
|
|
|
|
|
|
|
|
|
| 2-Sep-04 |
140 |
|
|
|
|
|
|
|
|
|
|
|
|
|
|
|
|
|
|
| 3-Sep-04 |
164 |
|
|
|
|
|
|
|
|
|
|
|
|
|
|
|
|
|
|
| 4-Sep-04 |
153 |
|
|
|
|
|
|
|
|
|
|
|
|
|
|
|
|
|
|
| 5-Sep-04 |
159 |
|
|
|
|
|
|
|
|
|
|
|
|
|
|
|
|
|
|
| 6-Sep-04 |
160 |
|
|
|
|
|
|
|
|
|
|
|
|
|
|
|
|
|
|
| 7-Sep-04 |
147 |
|
|
|
|
|
|
|
|
|
|
|
|
|
|
|
|
|
|
| 8-Sep-04 |
149 |
|
|
|
|
|
|
|
|
|
|
|
|
|
|
|
|
|
|
| 9-Sep-04 |
140 |
|
|
|
|
|
|
|
|
|
|
|
|
|
|
|
|
|
|
| 10-Sep-04 |
143 |
|
|
|
|
|
|
|
|
|
|
|
|
|
|
|
|
|
|
| 11-Sep-04 |
148 |
|
|
|
|
|
|
|
|
|
|
|
|
|
|
|
|
|
|
| 12-Sep-04 |
120 |
|
|
|
|
|
|
|
|
|
|
|
|
|
|
|
|
|
|
| 13-Sep-04 |
111 |
|
|
|
|
|
|
|
|
|
|
|
|
|
|
|
|
|
|
| 14-Sep-04 |
101 |
|
|
|
|
|
|
|
|
|
|
|
|
|
|
|
|
|
|
| 15-Sep-04 |
96 |
|
|
|
|
|
|
|
|
|
|
|
|
|
|
|
|
|
|
| 16-Sep-04 |
120 |
|
|
|
|
|
|
|
|
|
|
|
|
|
|
|
|
|
|
| 17-Sep-04 |
146 |
|
|
|
|
|
|
|
|
|
|
|
|
|
|
|
|
|
|
| 18-Sep-04 |
153 |
|
|
|
|
|
|
|
|
|
|
|
|
|
|
|
|
|
|
| 19-Sep-04 |
167 |
|
|
|
|
|
|
|
|
|
|
|
|
|
|
|
|
|
|
| 20-Sep-04 |
153 |
|
|
|
|
|
|
|
|
|
|
|
|
|
|
|
|
|
|
| 21-Sep-04 |
135 |
|
|
|
|
|
|
|
|
|
|
|
|
|
|
|
|
|
|
| 22-Sep-04 |
132 |
|
|
|
|
|
|
|
|
|
|
|
|
|
|
|
|
|
|
| 23-Sep-04 |
130 |
|
|
|
|
|
|
|
|
|
|
|
|
|
|
|
|
|
|
| 24-Sep-04 |
142 |
|
|
|
|
|
|
|
|
|
|
|
|
|
|
|
|
|
|
| 25-Sep-04 |
139 |
|
|
|
|
|
|
|
|
|
|
|
|
|
|
|
|
|
|
| 26-Sep-04 |
138 |
|
|
|
|
|
|
|
|
|
|
|
|
|
|
|
|
|
|
| 27-Sep-04 |
140 |
|
|
|
|
|
|
|
|
|
|
|
|
|
|
|
|
|
|
| 28-Sep-04 |
136 |
|
|
|
|
|
|
|
|
|
|
|
|
|
|
|
|
|
|
| 29-Sep-04 |
127 |
|
|
|
|
|
|
|
|
|
|
|
|
|
|
|
|
|
|
| 30-Sep-04 |
126 |
|
|
|
|
|
|
|
|
|
|
|
|
|
|
|
|
|
|
| 1-Oct-04 |
118 |
|
|
|
|
|
|
|
|
|
|
|
|
|
|
|
|
|
|
| 2-Oct-04 |
111 |
|
|
|
|
|
|
|
|
|
|
|
|
|
|
|
|
|
|
| 3-Oct-04 |
133 |
|
|
|
|
|
|
|
|
|
|
|
|
|
|
|
|
|
|
| 4-Oct-04 |
132 |
|
|
|
|
|
|
|
|
|
|
|
|
|
|
|
|
|
|
| 5-Oct-04 |
131 |
|
|
|
|
|
|
|
|
|
|
|
|
|
|
|
|
|
|
| 6-Oct-04 |
123 |
|
|
|
|
|
|
|
|
|
|
|
|
|
|
|
|
|
|
| 7-Oct-04 |
123 |
|
|
|
|
|
|
|
|
|
|
|
|
|
|
|
|
|
|
| 8-Oct-04 |
121 |
|
|
|
|
|
|
|
|
|
|
|
|
|
|
|
|
|
|
| 9-Oct-04 |
91 |
|
|
|
|
|
|
|
|
|
|
|
|
|
|
|
|
|
|
| 10-Oct-04 |
88 |
|
|
|
|
|
|
|
|
|
|
|
|
|
|
|
|
|
|
| 11-Oct-04 |
72 |
|
|
|
|
|
|
|
|
|
|
|
|
|
|
|
|
|
|
| 12-Oct-04 |
63 |
|
|
|
|
|
|
|
|
|
|
|
|
|
|
|
|
|
|
| 13-Oct-04 |
63 |
|
|
|
|
|
|
|
|
|
|
|
|
|
|
|
|
|
|
| 14-Oct-04 |
59 |
|
|
|
|
|
|
|
|
|
|
|
|
|
|
|
|
|
|
| 15-Oct-04 |
63 |
|
|
|
|
|
|
|
|
|
|
|
|
|
|
|
|
|
|
| 16-Oct-04 |
44 |
|
|
|
|
|
|
|
|
|
|
|
|
|
|
|
|
|
|
| 17-Oct-04 |
64 |
|
|
|
|
|
|
|
|
|
|
|
|
|
|
|
|
|
|
| 18-Oct-04 |
62 |
|
|
|
|
|
|
|
|
|
|
|
|
|
|
|
|
|
|
| 19-Oct-04 |
49 |
|
|
|
|
|
|
|
|
|
|
|
|
|
|
|
|
|
|
| 20-Oct-04 |
74 |
|
|
|
|
|
|
|
|
|
|
|
|
|
|
|
|
|
|
| 21-Oct-04 |
70 |
|
|
|
|
|
|
|
|
|
|
|
|
|
|
|
|
|
|
| 22-Oct-04 |
67 |
|
|
|
|
|
|
|
|
|
|
|
|
|
|
|
|
|
|
| 23-Oct-04 |
76 |
|
|
|
|
|
|
|
|
|
|
|
|
|
|
|
|
|
|
| 24-Oct-04 |
87 |
|
|
|
|
|
|
|
|
|
|
|
|
|
|
|
|
|
|
| 25-Oct-04 |
82 |
|
|
|
|
|
|
|
|
|
|
|
|
|
|
|
|
|
|
| 26-Oct-04 |
76 |
|
|
|
|
|
|
|
|
|
|
|
|
|
|
|
|
|
|
| 27-Oct-04 |
90 |
|
|
|
|
|
|
|
|
|
|
|
|
|
|
|
|
|
|
| 28-Oct-04 |
83 |
|
|
|
|
|
|
|
|
|
|
|
|
|
|
|
|
|
|
| 29-Oct-04 |
84 |
|
|
|
|
|
|
|
|
|
|
|
|
|
|
|
|
|
|
| 30-Oct-04 |
100 |
|
|
|
|
|
|
|
|
|
|
|
|
|
|
|
|
|
|
| 31-Oct-04 |
92 |
|
|
|
|
|
|
|
|
|
|
|
|
|
|
|
|
|
|
| 1-Nov-04 |
97 |
|
|
|
|
|
|
|
|
|
|
|
|
|
|
|
|
|
|
| 2-Nov-04 |
101 |
|
|
|
|
|
|
|
|
|
|
|
|
|
|
|
|
|
|
| 3-Nov-04 |
103 |
|
|
|
|
|
|
|
|
|
|
|
|
|
|
|
|
|
|
| 4-Nov-04 |
100 |
|
|
|
|
|
|
|
|
|
|
|
|
|
|
|
|
|
|
| 5-Nov-04 |
113 |
|
|
|
|
|
|
|
|
|
|
|
|
|
|
|
|
|
|
| 6-Nov-04 |
104 |
|
|
|
|
|
|
|
|
|
|
|
|
|
|
|
|
|
|
| 7-Nov-04 |
103 |
|
|
|
|
|
|
|
|
|
|
|
|
|
|
|
|
|
|
| 8-Nov-04 |
111 |
|
|
|
|
|
|
|
|
|
|
|
|
|
|
|
|
|
|
| 9-Nov-04 |
98 |
|
|
|
|
|
|
|
|
|
|
|
|
|
|
|
|
|
|
| 10-Nov-04 |
113 |
|
|
|
|
|
|
|
|
|
|
|
|
|
|
|
|
|
|
| 11-Nov-04 |
112 |
|
|
|
|
|
|
|
|
|
|
|
|
|
|
|
|
|
|
| 12-Nov-04 |
108 |
|
|
|
|
|
|
|
|
|
|
|
|
|
|
|
|
|
|
| 13-Nov-04 |
107 |
|
|
|
|
|
|
|
|
|
|
|
|
|
|
|
|
|
|
| 14-Nov-04 |
107 |
|
|
|
|
|
|
|
|
|
|
|
|
|
|
|
|
|
|
| 15-Nov-04 |
122 |
|
|
|
|
|
|
|
|
|
|
|
|
|
|
|
|
|
|
| 16-Nov-04 |
131 |
|
|
|
|
|
|
|
|
|
|
|
|
|
|
|
|
|
|
| 17-Nov-04 |
134 |
|
|
|
|
|
|
|
|
|
|
|
|
|
|
|
|
|
|
| 18-Nov-04 |
129 |
|
|
|
|
|
|
|
|
|
|
|
|
|
|
|
|
|
|
| 19-Nov-04 |
119 |
|
|
|
|
|
|
|
|
|
|
|
|
|
|
|
|
|
|
| 20-Nov-04 |
106 |
|
|
|
|
|
|
|
|
|
|
|
|
|
|
|
|
|
|
| 21-Nov-04 |
111 |
|
|
|
|
|
|
|
|
|
|
|
|
|
|
|
|
|
|
| 22-Nov-04 |
172 |
|
|
|
|
|
|
|
|
|
|
|
|
|
|
|
|
|
|
| 23-Nov-04 |
125 |
|
|
|
|
|
|
|
|
|
|
|
|
|
|
|
|
|
|
| 24-Nov-04 |
105 |
|
|
|
|
|
|
|
|
|
|
|
|
|
|
|
|
|
|
| 25-Nov-04 |
113 |
|
|
|
|
|
|
|
|
|
|
|
|
|
|
|
|
|
|
| 26-Nov-04 |
92 |
|
|
|
|
|
|
|
|
|
|
|
|
|
|
|
|
|
|
| 27-Nov-04 |
91 |
|
|
|
|
|
|
|
|
|
|
|
|
|
|
|
|
|
|
| 28-Nov-04 |
99 |
|
|
|
|
|
|
|
|
|
|
|
|
|
|
|
|
|
|
| 29-Nov-04 |
83 |
|
|
|
|
|
|
|
|
|
|
|
|
|
|
|
|
|
|
| 30-Nov-04 |
95 |
|
|
|
|
|
|
|
|
|
|
|
|
|
|
|
|
|
|
| 1-Dec-04 |
101 |
|
|
|
|
|
|
|
|
|
|
|
|
|
|
|
|
|
|
| 2-Dec-04 |
96 |
|
|
|
|
|
|
|
|
|
|
|
|
|
|
|
|
|
|
| 3-Dec-04 |
93 |
|
|
|
|
|
|
|
|
|
|
|
|
|
|
|
|
|
|
| 4-Dec-04 |
76 |
|
|
|
|
|
|
|
|
|
|
|
|
|
|
|
|
|
|
| 5-Dec-04 |
68 |
|
|
|
|
|
|
|
|
|
|
|
|
|
|
|
|
|
|
| 6-Dec-04 |
83 |
|
|
|
|
|
|
|
|
|
|
|
|
|
|
|
|
|
|
| 7-Dec-04 |
106 |
|
|
|
|
|
|
|
|
|
|
|
|
|
|
|
|
|
|
| 8-Dec-04 |
130 |
|
|
|
|
|
|
|
|
|
|
|
|
|
|
|
|
|
|
| 9-Dec-04 |
129 |
|
|
|
|
|
|
|
|
|
|
|
|
|
|
|
|
|
|
| 10-Dec-04 |
127 |
|
|
|
|
|
|
|
|
|
|
|
|
|
|
|
|
|
|
| 11-Dec-04 |
117 |
|
|
|
|
|
|
|
|
|
|
|
|
|
|
|
|
|
|
| 12-Dec-04 |
108 |
|
|
|
|
|
|
|
|
|
|
|
|
|
|
|
|
|
|
| 13-Dec-04 |
114 |
|
|
|
|
|
|
|
|
|
|
|
|
|
|
|
|
|
|
| 14-Dec-04 |
112 |
|
|
|
|
|
|
|
|
|
|
|
|
|
|
|
|
|
|
| 15-Dec-04 |
107 |
|
|
|
|
|
|
|
|
|
|
|
|
|
|
|
|
|
|
| 16-Dec-04 |
108 |
|
|
|
|
|
|
|
|
|
|
|
|
|
|
|
|
|
|
| 17-Dec-04 |
97 |
|
|
|
|
|
|
|
|
|
|
|
|
|
|
|
|
|
|
| 18-Dec-04 |
82 |
|
|
|
|
|
|
|
|
|
|
|
|
|
|
|
|
|
|
| 19-Dec-04 |
88 |
|
|
|
|
|
|
|
|
|
|
|
|
|
|
|
|
|
|
| 20-Dec-04 |
89 |
|
|
|
|
|
|
|
|
|
|
|
|
|
|
|
|
|
|
| 21-Dec-04 |
84 |
|
|
|
|
|
|
|
|
|
|
|
|
|
|
|
|
|
|
| 22-Dec-04 |
105 |
|
|
|
|
|
|
|
|
|
|
|
|
|
|
|
|
|
|
| 23-Dec-04 |
106 |
|
|
|
|
|
|
|
|
|
|
|
|
|
|
|
|
|
|
| 24-Dec-04 |
107 |
|
|
|
|
|
|
|
|
|
|
|
|
|
|
|
|
|
|
| 25-Dec-04 |
98 |
|
|
|
|
|
|
|
|
|
|
|
|
|
|
|
|
|
|
| 26-Dec-04 |
98 |
|
|
|
|
|
|
|
|
|
|
|
|
|
|
|
|
|
|
| 27-Dec-04 |
107 |
|
|
|
|
|
|
|
|
|
|
|
|
|
|
|
|
|
|
| 28-Dec-04 |
111 |
|
|
|
|
|
|
|
|
|
|
|
|
|
|
|
|
|
|
| 29-Dec-04 |
128 |
|
|
|
|
|
|
|
|
|
|
|
|
|
|
|
|
|
|
| 30-Dec-04 |
134 |
|
|
|
|
|
|
|
|
|
|
|
|
|
|
|
|
|
|
| 31-Dec-04 |
128 |
|
|
|
|
|
|
|
|
|
|
|
|
|
|
|
|
|
|
| 1-Jan-05 |
122 |
|
|
|
|
|
|
|
|
|
|
|
|
|
|
|
|
|
|
| 2-Jan-05 |
110 |
|
|
|
|
|
|
|
|
|
|
|
|
|
|
|
|
|
|
| 3-Jan-05 |
110 |
|
|
|
|
|
|
|
|
|
|
|
|
|
|
|
|
|
|
| 4-Jan-05 |
113 |
|
|
|
|
|
|
|
|
|
|
|
|
|
|
|
|
|
|
| 5-Jan-05 |
109 |
|
|
|
|
|
|
|
|
|
|
|
|
|
|
|
|
|
|
| 6-Jan-05 |
115 |
|
|
|
|
|
|
|
|
|
|
|
|
|
|
|
|
|
|
| 7-Jan-05 |
117 |
|
|
|
|
|
|
|
|
|
|
|
|
|
|
|
|
|
|
| 8-Jan-05 |
126 |
|
|
|
|
|
|
|
|
|
|
|
|
|
|
|
|
|
|
| 9-Jan-05 |
118 |
|
|
|
|
|
|
|
|
|
|
|
|
|
|
|
|
|
|
| 10-Jan-05 |
144 |
|
|
|
|
|
|
|
|
|
|
|
|
|
|
|
|
|
|
| 11-Jan-05 |
122 |
|
|
|
|
|
|
|
|
|
|
|
|
|
|
|
|
|
|
| 12-Jan-05 |
122 |
|
|
|
|
|
|
|
|
|
|
|
|
|
|
|
|
|
|
| 13-Jan-05 |
127 |
|
|
|
|
|
|
|
|
|
|
|
|
|
|
|
|
|
|
| 14-Jan-05 |
117 |
|
|
|
|
|
|
|
|
|
|
|
|
|
|
|
|
|
|
| 15-Jan-05 |
141 |
|
|
|
|
|
|
|
|
|
|
|
|
|
|
|
|
|
|
| 16-Jan-05 |
140 |
|
|
|
|
|
|
|
|
|
|
|
|
|
|
|
|
|
|
| 17-Jan-05 |
155 |
|
|
|
|
|
|
|
|
|
|
|
|
|
|
|
|
|
|
| 18-Jan-05 |
137 |
|
|
|
|
|
|
|
|
|
|
|
|
|
|
|
|
|
|
| 19-Jan-05 |
125 |
|
|
|
|
|
|
|
|
|
|
|
|
|
|
|
|
|
|
| 20-Jan-05 |
106 |
|
|
|
|
|
|
|
|
|
|
|
|
|
|
|
|
|
|
| 21-Jan-05 |
111 |
|
|
|
|
|
|
|
|
|
|
|
|
|
|
|
|
|
|
| 22-Jan-05 |
112 |
|
|
|
|
|
|
|
|
|
|
|
|
|
|
|
|
|
|
| 23-Jan-05 |
101 |
|
|
|
|
|
|
|
|
|
|
|
|
|
|
|
|
|
|
| 24-Jan-05 |
138 |
|
|
|
|
|
|
|
|
|
|
|
|
|
|
|
|
|
|
| 25-Jan-05 |
123 |
|
|
|
|
|
|
|
|
|
|
|
|
|
|
|
|
|
|
| 26-Jan-05 |
134 |
|
|
|
|
|
|
|
|
|
|
|
|
|
|
|
|
|
|
| 27-Jan-05 |
149 |
|
|
|
|
|
|
|
|
|
|
|
|
|
|
|
|
|
|
| 28-Jan-05 |
127 |
|
|
|
|
|
|
|
|
|
|
|
|
|
|
|
|
|
|
| 29-Jan-05 |
130 |
|
|
|
|
|
|
|
|
|
|
|
|
|
|
|
|
|
|
| 30-Jan-05 |
118 |
|
|
|
|
|
|
|
|
|
|
|
|
|
|
|
|
|
|
| 31-Jan-05 |
114 |
|
|
|
|
|
|
|
|
|
|
|
|
|
|
|
|
|
|
| 1-Feb-05 |
138 |
|
|
|
|
|
|
|
|
|
|
|
|
|
|
|
|
|
|
| 2-Feb-05 |
125 |
|
|
|
|
|
|
|
|
|
|
|
|
|
|
|
|
|
|
| 3-Feb-05 |
133 |
|
|
|
|
|
|
|
|
|
|
|
|
|
|
|
|
|
|
| 4-Feb-05 |
134 |
|
|
|
|
|
|
|
|
|
|
|
|
|
|
|
|
|
|
| 5-Feb-05 |
118 |
|
|
|
|
|
|
|
|
|
|
|
|
|
|
|
|
|
|
| 6-Feb-05 |
123 |
|
|
|
|
|
|
|
|
|
|
|
|
|
|
|
|
|
|
| 7-Feb-05 |
114 |
|
|
|
|
|
|
|
|
|
|
|
|
|
|
|
|
|
|
| 8-Feb-05 |
136 |
|
|
|
|
|
|
|
|
|
|
|
|
|
|
|
|
|
|
| 9-Feb-05 |
149 |
|
|
|
|
|
|
|
|
|
|
|
|
|
|
|
|
|
|
| 10-Feb-05 |
162 |
|
|
|
|
|
|
|
|
|
|
|
|
|
|
|
|
|
|
| 11-Feb-05 |
161 |
|
|
|
|
|
|
|
|
|
|
|
|
|
|
|
|
|
|
| 12-Feb-05 |
143 |
|
|
|
|
|
|
|
|
|
|
|
|
|
|
|
|
|
|
| 13-Feb-05 |
126 |
|
|
|
|
|
|
|
|
|
|
|
|
|
|
|
|
|
|
| 14-Feb-05 |
133 |
|
|
|
|
|
|
|
|
|
|
|
|
|
|
|
|
|
|
| 15-Feb-05 |
141 |
|
|
|
|
|
|
|
|
|
|
|
|
|
|
|
|
|
|
| 16-Feb-05 |
160 |
|
|
|
|
|
|
|
|
|
|
|
|
|
|
|
|
|
|
| 17-Feb-05 |
187 |
|
|
|
|
|
|
|
|
|
|
|
|
|
|
|
|
|
|
| 18-Feb-05 |
185 |
|
|
|
|
|
|
|
|
|
|
|
|
|
|
|
|
|
|
| 19-Feb-05 |
181 |
|
|
|
|
|
|
|
|
|
|
|
|
|
|
|
|
|
|
| 20-Feb-05 |
154 |
|
|
|
|
|
|
|
|
|
|
|
|
|
|
|
|
|
|
| 21-Feb-05 |
135 |
|
|
|
|
|
|
|
|
|
|
|
|
|
|
|
|
|
|
| 22-Feb-05 |
149 |
|
|
|
|
|
|
|
|
|
|
|
|
|
|
|
|
|
|
| 23-Feb-05 |
143 |
|
|
|
|
|
|
|
|
|
|
|
|
|
|
|
|
|
|
| 24-Feb-05 |
165 |
|
|
|
|
|
|
|
|
|
|
|
|
|
|
|
|
|
|
| 25-Feb-05 |
180 |
|
|
|
|
|
|
|
|
|
|
|
|
|
|
|
|
|
|
| 26-Feb-05 |
125 |
|
|
|
|
|
|
|
|
|
|
|
|
|
|
|
|
|
|
| 27-Feb-05 |
116 |
|
|
|
|
|
|
|
|
|
|
|
|
|
|
|
|
|
|
| 28-Feb-05 |
103 |
|
|
|
|
|
|
|
|
|
|
|
|
|
|
|
|
|
|
| 1-Mar-05 |
82 |
|
|
|
|
|
|
|
|
|
|
|
|
|
|
|
|
|
|
| 2-Mar-05 |
98 |
|
|
|
|
|
|
|
|
|
|
|
|
|
|
|
|
|
|
| 3-Mar-05 |
98 |
|
|
|
|
|
|
|
|
|
|
|
|
|
|
|
|
|
|
| 4-Mar-05 |
105 |
|
|
|
|
|
|
|
|
|
|
|
|
|
|
|
|
|
|
| 5-Mar-05 |
111 |
|
|
|
|
|
|
|
|
|
|
|
|
|
|
|
|
|
|
| 6-Mar-05 |
120 |
|
|
|
|
|
|
|
|
|
|
|
|
|
|
|
|
|
|
| 7-Mar-05 |
131 |
|
|
|
|
|
|
|
|
|
|
|
|
|
|
|
|
|
|
| 8-Mar-05 |
123 |
|
|
|
|
|
|
|
|
|
|
|
|
|
|
|
|
|
|
| 9-Mar-05 |
127 |
|
|
|
|
|
|
|
|
|
|
|
|
|
|
|
|
|
|
| 10-Mar-05 |
115 |
|
|
|
|
|
|
|
|
|
|
|
|
|
|
|
|
|
|
| 11-Mar-05 |
108 |
|
|
|
|
|
|
|
|
|
|
|
|
|
|
|
|
|
|
| 12-Mar-05 |
129 |
|
|
|
|
|
|
|
|
|
|
|
|
|
|
|
|
|
|
| 13-Mar-05 |
119 |
|
|
|
|
|
|
|
|
|
|
|
|
|
|
|
|
|
|
| 14-Mar-05 |
139 |
|
|
|
|
|
|
|
|
|
|
|
|
|
|
|
|
|
|
| 15-Mar-05 |
147 |
|
|
|
|
|
|
|
|
|
|
|
|
|
|
|
|
|
|
| 16-Mar-05 |
142 |
|
|
|
|
|
|
|
|
|
|
|
|
|
|
|
|
|
|
| 17-Mar-05 |
145 |
|
|
|
|
|
|
|
|
|
|
|
|
|
|
|
|
|
|
| 18-Mar-05 |
140 |
|
|
|
|
|
|
|
|
|
|
|
|
|
|
|
|
|
|
| 19-Mar-05 |
126 |
|
|
|
|
|
|
|
|
|
|
|
|
|
|
|
|
|
|
| 20-Mar-05 |
129 |
|
|
|
|
|
|
|
|
|
|
|
|
|
|
|
|
|
|
| 21-Mar-05 |
123 |
|
|
|
|
|
|
|
|
|
|
|
|
|
|
|
|
|
|
| 22-Mar-05 |
113 |
|
|
|
|
|
|
|
|
|
|
|
|
|
|
|
|
|
|
| 23-Mar-05 |
113 |
|
|
|
|
|
|
|
|
|
|
|
|
|
|
|
|
|
|
| 24-Mar-05 |
114 |
|
|
|
|
|
|
|
|
|
|
|
|
|
|
|
|
|
|
| 25-Mar-05 |
113 |
|
|
|
|
|
|
|
|
|
|
|
|
|
|
|
|
|
|
| 26-Mar-05 |
132 |
|
|
|
|
|
|
|
|
|
|
|
|
|
|
|
|
|
|
| 27-Mar-05 |
135 |
|
|
|
|
|
|
|
|
|
|
|
|
|
|
|
|
|
|
| 28-Mar-05 |
121 |
|
|
|
|
|
|
|
|
|
|
|
|
|
|
|
|
|
|
| 29-Mar-05 |
136 |
|
|
|
|
|
|
|
|
|
|
|
|
|
|
|
|
|
|
| 30-Mar-05 |
139 |
|
|
|
|
|
|
|
|
|
|
|
|
|
|
|
|
|
|
| 31-Mar-05 |
129 |
|
|
|
|
|
|
|
|
|
|
|
|
|
|
|
|
|
|
| 1-Apr-05 |
132 |
|
|
|
|
|
|
|
|
|
|
|
|
|
|
|
|
|
|
| 2-Apr-05 |
137 |
|
|
|
|
|
|
|
|
|
|
|
|
|
|
|
|
|
|
| 3-Apr-05 |
139 |
|
|
|
|
|
|
|
|
|
|
|
|
|
|
|
|
|
|
| 4-Apr-05 |
146 |
|
|
|
|
|
|
|
|
|
|
|
|
|
|
|
|
|
|
| 5-Apr-05 |
168 |
|
|
|
|
|
|
|
|
|
|
|
|
|
|
|
|
|
|
| 6-Apr-05 |
176 |
|
|
|
|
|
|
|
|
|
|
|
|
|
|
|
|
|
|
| 7-Apr-05 |
177 |
|
|
|
|
|
|
|
|
|
|
|
|
|
|
|
|
|
|
| 8-Apr-05 |
174 |
|
|
|
|
|
|
|
|
|
|
|
|
|
|
|
|
|
|
| 9-Apr-05 |
155 |
|
|
|
|
|
|
|
|
|
|
|
|
|
|
|
|
|
|
| 10-Apr-05 |
143 |
|
|
|
|
|
|
|
|
|
|
|
|
|
|
|
|
|
|
| 11-Apr-05 |
133 |
|
|
|
|
|
|
|
|
|
|
|
|
|
|
|
|
|
|
| 12-Apr-05 |
129 |
|
|
|
|
|
|
|
|
|
|
|
|
|
|
|
|
|
|
| 13-Apr-05 |
127 |
|
|
|
|
|
|
|
|
|
|
|
|
|
|
|
|
|
|
| 14-Apr-05 |
124 |
|
|
|
|
|
|
|
|
|
|
|
|
|
|
|
|
|
|
| 15-Apr-05 |
131 |
|
|
|
|
|
|
|
|
|
|
|
|
|
|
|
|
|
|
| 16-Apr-05 |
146 |
|
|
|
|
|
|
|
|
|
|
|
|
|
|
|
|
|
|
| 17-Apr-05 |
156 |
|
|
|
|
|
|
|
|
|
|
|
|
|
|
|
|
|
|
| 18-Apr-05 |
162 |
|
|
|
|
|
|
|
|
|
|
|
|
|
|
|
|
|
|
| 19-Apr-05 |
172 |
|
|
|
|
|
|
|
|
|
|
|
|
|
|
|
|
|
|
| 20-Apr-05 |
171 |
|
|
|
|
|
|
|
|
|
|
|
|
|
|
|
|
|
|
| 21-Apr-05 |
169 |
|
|
|
|
|
|
|
|
|
|
|
|
|
|
|
|
|
|
| 22-Apr-05 |
168 |
|
|
|
|
|
|
|
|
|
|
|
|
|
|
|
|
|
|
| 23-Apr-05 |
169 |
|
|
|
|
|
|
|
|
|
|
|
|
|
|
|
|
|
|
| 24-Apr-05 |
177 |
|
|
|
|
|
|
|
|
|
|
|
|
|
|
|
|
|
|
| 25-Apr-05 |
197 |
|
|
|
|
|
|
|
|
|
|
|
|
|
|
|
|
|
|
| 26-Apr-05 |
207 |
|
|
|
|
|
|
|
|
|
|
|
|
|
|
|
|
|
|
| 27-Apr-05 |
201 |
|
|
|
|
|
|
|
|
|
|
|
|
|
|
|
|
|
|
| 28-Apr-05 |
198 |
|
|
|
|
|
|
|
|
|
|
|
|
|
|
|
|
|
|
| 29-Apr-05 |
184 |
|
|
|
|
|
|
|
|
|
|
|
|
|
|
|
|
|
|
| 30-Apr-05 |
187 |
|
|
|
|
|
|
|
|
|
|
|
|
|
|
|
|
|
|
| 1-May-05 |
206 |
|
|
|
|
|
|
|
|
|
|
|
|
|
|
|
|
|
|
| 2-May-05 |
219 |
|
|
|
|
|
|
|
|
|
|
|
|
|
|
|
|
|
|
| 3-May-05 |
236 |
|
|
|
|
|
|
|
|
|
|
|
|
|
|
|
|
|
|
| 4-May-05 |
243 |
|
|
|
|
|
|
|
|
|
|
|
|
|
|
|
|
|
|
| 5-May-05 |
239 |
|
|
|
|
|
|
|
|
|
|
|
|
|
|
|
|
|
|
| 6-May-05 |
221 |
|
|
|
|
|
|
|
|
|
|
|
|
|
|
|
|
|
|
| 7-May-05 |
217 |
|
|
|
|
|
|
|
|
|
|
|
|
|
|
|
|
|
|
| 8-May-05 |
194 |
|
|
|
|
|
|
|
|
|
|
|
|
|
|
|
|
|
|
| 9-May-05 |
175 |
|
|
|
|
|
|
|
|
|
|
|
|
|
|
|
|
|
|
| 10-May-05 |
174 |
|
|
|
|
|
|
|
|
|
|
|
|
|
|
|
|
|
|
| 11-May-05 |
166 |
|
|
|
|
|
|
|
|
|
|
|
|
|
|
|
|
|
|
| 12-May-05 |
158 |
|
|
|
|
|
|
|
|
|
|
|
|
|
|
|
|
|
|
| 13-May-05 |
164 |
|
|
|
|
|
|
|
|
|
|
|
|
|
|
|
|
|
|
| 14-May-05 |
164 |
|
|
|
|
|
|
|
|
|
|
|
|
|
|
|
|
|
|
| 15-May-05 |
166 |
|
|
|
|
|
|
|
|
|
|
|
|
|
|
|
|
|
|
| 16-May-05 |
177 |
|
|
|
|
|
|
|
|
|
|
|
|
|
|
|
|
|
|
| 17-May-05 |
179 |
|
|
|
|
|
|
|
|
|
|
|
|
|
|
|
|
|
|
| 18-May-05 |
177 |
|
|
|
|
|
|
|
|
|
|
|
|
|
|
|
|
|
|
| 19-May-05 |
171 |
|
|
|
|
|
|
|
|
|
|
|
|
|
|
|
|
|
|
| 20-May-05 |
177 |
|
|
|
|
|
|
|
|
|
|
|
|
|
|
|
|
|
|
| 21-May-05 |
167 |
|
|
|
|
|
|
|
|
|
|
|
|
|
|
|
|
|
|
| 22-May-05 |
160 |
|
|
|
|
|
|
|
|
|
|
|
|
|
|
|
|
|
|
| 23-May-05 |
178 |
|
|
|
|
|
|
|
|
|
|
|
|
|
|
|
|
|
|
| 24-May-05 |
190 |
|
|
|
|
|
|
|
|
|
|
|
|
|
|
|
|
|
|
| 25-May-05 |
194 |
|
|
|
|
|
|
|
|
|
|
|
|
|
|
|
|
|
|
| 26-May-05 |
198 |
|
|
|
|
|
|
|
|
|
|
|
|
|
|
|
|
|
|
| 27-May-05 |
193 |
|
|
|
|
|
|
|
|
|
|
|
|
|
|
|
|
|
|
| 28-May-05 |
186 |
|
|
|
|
|
|
|
|
|
|
|
|
|
|
|
|
|
|
| 29-May-05 |
193 |
|
|
|
|
|
|
|
|
|
|
|
|
|
|
|
|
|
|
| 30-May-05 |
192 |
|
|
|
|
|
|
|
|
|
|
|
|
|
|
|
|
|
|
| 31-May-05 |
184 |
|
|
|
|
|
|
|
|
|
|
|
|
|
|
|
|
|
|
| 1-Jun-05 |
185 |
|
|
|
|
|
|
|
|
|
|
|
|
|
|
|
|
|
|
| 2-Jun-05 |
183 |
|
|
|
|
|
|
|
|
|
|
|
|
|
|
|
|
|
|
| 3-Jun-05 |
187 |
|
|
|
|
|
|
|
|
|
|
|
|
|
|
|
|
|
|
| 4-Jun-05 |
208 |
|
|
|
|
|
|
|
|
|
|
|
|
|
|
|
|
|
|
| 5-Jun-05 |
204 |
|
|
|
|
|
|
|
|
|
|
|
|
|
|
|
|
|
|
| 6-Jun-05 |
212 |
|
|
|
|
|
|
|
|
|
|
|
|
|
|
|
|
|
|
| 7-Jun-05 |
206 |
|
|
|
|
|
|
|
|
|
|
|
|
|
|
|
|
|
|
| 8-Jun-05 |
226 |
|
|
|
|
|
|
|
|
|
|
|
|
|
|
|
|
|
|
| 9-Jun-05 |
242 |
|
|
|
|
|
|
|
|
|
|
|
|
|
|
|
|
|
|
| 10-Jun-05 |
243 |
|
|
|
|
|
|
|
|
|
|
|
|
|
|
|
|
|
|
| 11-Jun-05 |
231 |
|
|
|
|
|
|
|
|
|
|
|
|
|
|
|
|
|
|
| 12-Jun-05 |
203 |
|
|
|
|
|
|
|
|
|
|
|
|
|
|
|
|
|
|
| 13-Jun-05 |
195 |
|
|
|
|
|
|
|
|
|
|
|
|
|
|
|
|
|
|
| 14-Jun-05 |
196 |
|
|
|
|
|
|
|
|
|
|
|
|
|
|
|
|
|
|
| 15-Jun-05 |
196 |
|
|
|
|
|
|
|
|
|
|
|
|
|
|
|
|
|
|
| 16-Jun-05 |
203 |
|
|
|
|
|
|
|
|
|
|
|
|
|
|
|
|
|
|
| 17-Jun-05 |
237 |
|
|
|
|
|
|
|
|
|
|
|
|
|
|
|
|
|
|
| 18-Jun-05 |
240 |
|
|
|
|
|
|
|
|
|
|
|
|
|
|
|
|
|
|
| 19-Jun-05 |
250 |
|
|
|
|
|
|
|
|
|
|
|
|
|
|
|
|
|
|
| 20-Jun-05 |
260 |
|
|
|
|
|
|
|
|
|
|
|
|
|
|
|
|
|
|
| 21-Jun-05 |
244 |
|
|
|
|
|
|
|
|
|
|
|
|
|
|
|
|
|
|
| 22-Jun-05 |
241 |
|
|
|
|
|
|
|
|
|
|
|
|
|
|
|
|
|
|
| 23-Jun-05 |
238 |
|
|
|
|
|
|
|
|
|
|
|
|
|
|
|
|
|
|
| 24-Jun-05 |
238 |
|
|
|
|
|
|
|
|
|
|
|
|
|
|
|
|
|
|
| 25-Jun-05 |
220 |
|
|
|
|
|
|
|
|
|
|
|
|
|
|
|
|
|
|
| 26-Jun-05 |
230 |
|
|
|
|
|
|
|
|
|
|
|
|
|
|
|
|
|
|
| 27-Jun-05 |
236 |
|
|
|
|
|
|
|
|
|
|
|
|
|
|
|
|
|
|
| 28-Jun-05 |
239 |
|
|
|
|
|
|
|
|
|
|
|
|
|
|
|
|
|
|
| 29-Jun-05 |
260 |
|
|
|
|
|
|
|
|
|
|
|
|
|
|
|
|
|
|
| 30-Jun-05 |
266 |
|
|
|
|
|
|
|
|
|
|
|
|
|
|
|
|
|
|
| 1-Jul-05 |
273 |
|
|
|
|
|
|
|
|
|
|
|
|
|
|
|
|
|
|
| 2-Jul-05 |
277 |
|
|
|
|
|
|
|
|
|
|
|
|
|
|
|
|
|
|
| 3-Jul-05 |
279 |
|
|
|
|
|
|
|
|
|
|
|
|
|
|
|
|
|
|
| 4-Jul-05 |
|
|
|
|
|
|
|
|
|
|
|
|
|
|
|
|
|
|
|
| 5-Jul-05 |
|
|
|
|
|
|
|
|
|
|
|
|
|
|
|
|
|
|
|
| 6-Jul-05 |
|
|
|
|
|
|
|
|
|
|
|
|
|
|
|
|
|
|
|
| 7-Jul-05 |
|
|
|
|
|
|
|
|
|
|
|
|
|
|
|
|
|
|
|
| 8-Jul-05 |
|
|
|
|
|
|
|
|
|
|
|
|
|
|
|
|
|
|
|
| 9-Jul-05 |
|
|
|
|
|
|
|
|
|
|
|
|
|
|
|
|
|
|
|
| 10-Jul-05 |
|
|
|
|
|
|
|
|
|
|
|
|
|
|
|
|
|
|
|
| 11-Jul-05 |
|
|
|
|
|
|
|
|
|
|
|
|
|
|
|
|
|
|
|
| 12-Jul-05 |
|
|
|
|
|
|
|
|
|
|
|
|
|
|
|
|
|
|
|
| 13-Jul-05 |
|
|
|
|
|
|
|
|
|
|
|
|
|
|
|
|
|
|
|
| 14-Jul-05 |
|
|
|
|
|
|
|
|
|
|
|
|
|
|
|
|
|
|
|
| 15-Jul-05 |
|
|
|
|
|
|
|
|
|
|
|
|
|
|
|
|
|
|
|
| 16-Jul-05 |
|
|
|
|
|
|
|
|
|
|
|
|
|
|
|
|
|
|
|
| 17-Jul-05 |
|
|
|
|
|
|
|
|
|
|
|
|
|
|
|
|
|
|
|
| 18-Jul-05 |
|
|
|
|
|
|
|
|
|
|
|
|
|
|
|
|
|
|
|
| 19-Jul-05 |
|
|
|
|
|
|
|
|
|
|
|
|
|
|
|
|
|
|
|
| 20-Jul-05 |
|
|
|
|
|
|
|
|
|
|
|
|
|
|
|
|
|
|
|
| 21-Jul-05 |
|
|
|
|
|
|
|
|
|
|
|
|
|
|
|
|
|
|
|
| 22-Jul-05 |
|
|
|
|
|
|
|
|
|
|
|
|
|
|
|
|
|
|
|
| 23-Jul-05 |
|
|
|
|
|
|
|
|
|
|
|
|
|
|
|
|
|
|
|
| 24-Jul-05 |
|
|
|
|
|
|
|
|
|
|
|
|
|
|
|
|
|
|
|
| 25-Jul-05 |
|
|
|
|
|
|
|
|
|
|
|
|
|
|
|
|
|
|
|
| 26-Jul-05 |
|
|
|
|
|
|
|
|
|
|
|
|
|
|
|
|
|
|
|
| 27-Jul-05 |
|
|
|
|
|
|
|
|
|
|
|
|
|
|
|
|
|
|
|
| 28-Jul-05 |
|
|
|
|
|
|
|
|
|
|
|
|
|
|
|
|
|
|
|
| 29-Jul-05 |
|
|
|
|
|
|
|
|
|
|
|
|
|
|
|
|
|
|
|
| 30-Jul-05 |
|
|
|
|
|
|
|
|
|
|
|
|
|
|
|
|
|
|
|
| 31-Jul-05 |
|
|
|
|
|
|
|
|
|
|
|
|
|
|
|
|
|
|
|
| 1-Aug-05 |
|
|
|
|
|
|
|
|
|
|
|
|
|
|
|
|
|
|
|
| 2-Aug-05 |
155 |
|
|
|
|
|
|
|
|
|
|
|
|
|
|
|
|
|
|
| 3-Aug-05 |
159 |
|
|
|
|
|
|
|
|
|
|
|
|
|
|
|
|
|
|
| 4-Aug-05 |
163 |
|
|
|
|
|
|
|
|
|
|
|
|
|
|
|
|
|
|
| 5-Aug-05 |
162 |
|
|
|
|
|
|
|
|
|
|
|
|
|
|
|
|
|
|
| 6-Aug-05 |
167 |
|
|
|
|
|
|
|
|
|
|
|
|
|
|
|
|
|
|
| 7-Aug-05 |
170 |
|
|
|
|
|
|
|
|
|
|
|
|
|
|
|
|
|
|
| 8-Aug-05 |
154 |
|
|
|
|
|
|
|
|
|
|
|
|
|
|
|
|
|
|
| 9-Aug-05 |
137 |
|
|
|
|
|
|
|
|
|
|
|
|
|
|
|
|
|
|
| 10-Aug-05 |
128 |
|
|
|
|
|
|
|
|
|
|
|
|
|
|
|
|
|
|
| 11-Aug-05 |
124 |
|
|
|
|
|
|
|
|
|
|
|
|
|
|
|
|
|
|
| 12-Aug-05 |
125 |
|
|
|
|
|
|
|
|
|
|
|
|
|
|
|
|
|
|
| 13-Aug-05 |
122 |
|
|
|
|
|
|
|
|
|
|
|
|
|
|
|
|
|
|
| 14-Aug-05 |
116 |
|
|
|
|
|
|
|
|
|
|
|
|
|
|
|
|
|
|
| 15-Aug-05 |
113 |
|
|
|
|
|
|
|
|
|
|
|
|
|
|
|
|
|
|
| 16-Aug-05 |
115 |
|
|
|
|
|
|
|
|
|
|
|
|
|
|
|
|
|
|
| 17-Aug-05 |
119 |
|
|
|
|
|
|
|
|
|
|
|
|
|
|
|
|
|
|
| 18-Aug-05 |
127 |
|
|
|
|
|
|
|
|
|
|
|
|
|
|
|
|
|
|
| 19-Aug-05 |
127 |
|
|
|
|
|
|
|
|
|
|
|
|
|
|
|
|
|
|
| 20-Aug-05 |
127 |
|
|
|
|
|
|
|
|
|
|
|
|
|
|
|
|
|
|
| 21-Aug-05 |
130 |
|
|
|
|
|
|
|
|
|
|
|
|
|
|
|
|
|
|
| 22-Aug-05 |
122 |
|
|
|
|
|
|
|
|
|
|
|
|
|
|
|
|
|
|
| 23-Aug-05 |
119 |
|
|
|
|
|
|
|
|
|
|
|
|
|
|
|
|
|
|
| 24-Aug-05 |
121 |
|
|
|
|
|
|
|
|
|
|
|
|
|
|
|
|
|
|
| 25-Aug-05 |
126 |
|
|
|
|
|
|
|
|
|
|
|
|
|
|
|
|
|
|
| 26-Aug-05 |
135 |
|
|
|
|
|
|
|
|
|
|
|
|
|
|
|
|
|
|
| 27-Aug-05 |
149 |
|
|
|
|
|
|
|
|
|
|
|
|
|
|
|
|
|
|
| 28-Aug-05 |
156 |
|
|
|
|
|
|
|
|
|
|
|
|
|
|
|
|
|
|
| 29-Aug-05 |
157 |
|
|
|
|
|
|
|
|
|
|
|
|
|
|
|
|
|
|
| 30-Aug-05 |
159 |
|
|
|
|
|
|
|
|
|
|
|
|
|
|
|
|
|
|
| 31-Aug-05 |
156 |
|
|
|
|
|
|
|
|
|
|
|
|
|
|
|
|
|
|
| 1-Sep-05 |
156 |
|
|
|
|
|
|
|
|
|
|
|
|
|
|
|
|
|
|
| 2-Sep-05 |
158 |
|
|
|
|
|
|
|
|
|
|
|
|
|
|
|
|
|
|
| 3-Sep-05 |
155 |
|
|
|
|
|
|
|
|
|
|
|
|
|
|
|
|
|
|
| 4-Sep-05 |
150 |
|
|
|
|
|
|
|
|
|
|
|
|
|
|
|
|
|
|
| 5-Sep-05 |
138 |
|
|
|
|
|
|
|
|
|
|
|
|
|
|
|
|
|
|
| 6-Sep-05 |
123 |
|
|
|
|
|
|
|
|
|
|
|
|
|
|
|
|
|
|
| 7-Sep-05 |
120 |
|
|
|
|
|
|
|
|
|
|
|
|
|
|
|
|
|
|
| 8-Sep-05 |
119 |
|
|
|
|
|
|
|
|
|
|
|
|
|
|
|
|
|
|
| 9-Sep-05 |
117 |
|
|
|
|
|
|
|
|
|
|
|
|
|
|
|
|
|
|
| 10-Sep-05 |
123 |
|
|
|
|
|
|
|
|
|
|
|
|
|
|
|
|
|
|
| 11-Sep-05 |
132 |
|
|
|
|
|
|
|
|
|
|
|
|
|
|
|
|
|
|
| 12-Sep-05 |
110 |
|
|
|
|
|
|
|
|
|
|
|
|
|
|
|
|
|
|
| 13-Sep-05 |
94 |
|
|
|
|
|
|
|
|
|
|
|
|
|
|
|
|
|
|
| 14-Sep-05 |
87 |
|
|
|
|
|
|
|
|
|
|
|
|
|
|
|
|
|
|
| 15-Sep-05 |
81 |
|
|
|
|
|
|
|
|
|
|
|
|
|
|
|
|
|
|
| 16-Sep-05 |
103 |
|
|
|
|
|
|
|
|
|
|
|
|
|
|
|
|
|
|
| 17-Sep-05 |
114 |
|
|
|
|
|
|
|
|
|
|
|
|
|
|
|
|
|
|
| 18-Sep-05 |
110 |
|
|
|
|
|
|
|
|
|
|
|
|
|
|
|
|
|
|
| 19-Sep-05 |
112 |
|
|
|
|
|
|
|
|
|
|
|
|
|
|
|
|
|
|
| 20-Sep-05 |
117 |
|
|
|
|
|
|
|
|
|
|
|
|
|
|
|
|
|
|
| 21-Sep-05 |
133 |
|
|
|
|
|
|
|
|
|
|
|
|
|
|
|
|
|
|
| 22-Sep-05 |
144 |
|
|
|
|
|
|
|
|
|
|
|
|
|
|
|
|
|
|
| 23-Sep-05 |
147 |
|
|
|
|
|
|
|
|
|
|
|
|
|
|
|
|
|
|
| 24-Sep-05 |
145 |
|
|
|
|
|
|
|
|
|
|
|
|
|
|
|
|
|
|
| 25-Sep-05 |
142 |
|
|
|
|
|
|
|
|
|
|
|
|
|
|
|
|
|
|
| 26-Sep-05 |
140 |
|
|
|
|
|
|
|
|
|
|
|
|
|
|
|
|
|
|
| 27-Sep-05 |
134 |
|
|
|
|
|
|
|
|
|
|
|
|
|
|
|
|
|
|
| 28-Sep-05 |
133 |
|
|
|
|
|
|
|
|
|
|
|
|
|
|
|
|
|
|
| 29-Sep-05 |
132 |
|
|
|
|
|
|
|
|
|
|
|
|
|
|
|
|
|
|
| 30-Sep-05 |
126 |
|
|
|
|
|
|
|
|
|
|
|
|
|
|
|
|
|
|
| 1-Oct-05 |
130 |
|
|
|
|
|
|
|
|
|
|
|
|
|
|
|
|
|
|
| 2-Oct-05 |
122 |
|
|
|
|
|
|
|
|
|
|
|
|
|
|
|
|
|
|
| 3-Oct-05 |
119 |
|
|
|
|
|
|
|
|
|
|
|
|
|
|
|
|
|
|
| 4-Oct-05 |
124 |
|
|
|
|
|
|
|
|
|
|
|
|
|
|
|
|
|
|
| 5-Oct-05 |
117 |
|
|
|
|
|
|
|
|
|
|
|
|
|
|
|
|
|
|
| 6-Oct-05 |
93 |
|
|
|
|
|
|
|
|
|
|
|
|
|
|
|
|
|
|
| 7-Oct-05 |
66 |
|
|
|
|
|
|
|
|
|
|
|
|
|
|
|
|
|
|
| 8-Oct-05 |
63 |
|
|
|
|
|
|
|
|
|
|
|
|
|
|
|
|
|
|
| 9-Oct-05 |
68 |
|
|
|
|
|
|
|
|
|
|
|
|
|
|
|
|
|
|
| 10-Oct-05 |
87 |
|
|
|
|
|
|
|
|
|
|
|
|
|
|
|
|
|
|
| 11-Oct-05 |
109 |
|
|
|
|
|
|
|
|
|
|
|
|
|
|
|
|
|
|
| 12-Oct-05 |
110 |
|
|
|
|
|
|
|
|
|
|
|
|
|
|
|
|
|
|
| 13-Oct-05 |
97 |
|
|
|
|
|
|
|
|
|
|
|
|
|
|
|
|
|
|
| 14-Oct-05 |
83 |
|
|
|
|
|
|
|
|
|
|
|
|
|
|
|
|
|
|
| 15-Oct-05 |
82 |
|
|
|
|
|
|
|
|
|
|
|
|
|
|
|
|
|
|
| 16-Oct-05 |
89 |
|
|
|
|
|
|
|
|
|
|
|
|
|
|
|
|
|
|
| 17-Oct-05 |
83 |
|
|
|
|
|
|
|
|
|
|
|
|
|
|
|
|
|
|
| 18-Oct-05 |
88 |
|
|
|
|
|
|
|
|
|
|
|
|
|
|
|
|
|
|
| 19-Oct-05 |
86 |
|
|
|
|
|
|
|
|
|
|
|
|
|
|
|
|
|
|
| 20-Oct-05 |
82 |
|
|
|
|
|
|
|
|
|
|
|
|
|
|
|
|
|
|
| 21-Oct-05 |
74 |
|
|
|
|
|
|
|
|
|
|
|
|
|
|
|
|
|
|
| 22-Oct-05 |
49 |
|
|
|
|
|
|
|
|
|
|
|
|
|
|
|
|
|
|
| 23-Oct-05 |
44 |
|
|
|
|
|
|
|
|
|
|
|
|
|
|
|
|
|
|
| 24-Oct-05 |
57 |
|
|
|
|
|
|
|
|
|
|
|
|
|
|
|
|
|
|
| 25-Oct-05 |
65 |
|
|
|
|
|
|
|
|
|
|
|
|
|
|
|
|
|
|
| 26-Oct-05 |
80 |
|
|
|
|
|
|
|
|
|
|
|
|
|
|
|
|
|
|
| 27-Oct-05 |
96 |
|
|
|
|
|
|
|
|
|
|
|
|
|
|
|
|
|
|
| 28-Oct-05 |
93 |
|
|
|
|
|
|
|
|
|
|
|
|
|
|
|
|
|
|
| 29-Oct-05 |
94 |
|
|
|
|
|
|
|
|
|
|
|
|
|
|
|
|
|
|
| 30-Oct-05 |
90 |
|
|
|
|
|
|
|
|
|
|
|
|
|
|
|
|
|
|
| 31-Oct-05 |
92 |
|
|
|
|
|
|
|
|
|
|
|
|
|
|
|
|
|
|
| 1-Nov-05 |
103 |
|
|
|
|
|
|
|
|
|
|
|
|
|
|
|
|
|
|
| 2-Nov-05 |
96 |
|
|
|
|
|
|
|
|
|
|
|
|
|
|
|
|
|
|
| 3-Nov-05 |
94 |
|
|
|
|
|
|
|
|
|
|
|
|
|
|
|
|
|
|
| 4-Nov-05 |
97 |
|
|
|
|
|
|
|
|
|
|
|
|
|
|
|
|
|
|
| 5-Nov-05 |
103 |
|
|
|
|
|
|
|
|
|
|
|
|
|
|
|
|
|
|
| 6-Nov-05 |
107 |
|
|
|
|
|
|
|
|
|
|
|
|
|
|
|
|
|
|
| 7-Nov-05 |
104 |
|
|
|
|
|
|
|
|
|
|
|
|
|
|
|
|
|
|
| 8-Nov-05 |
94 |
|
|
|
|
|
|
|
|
|
|
|
|
|
|
|
|
|
|
| 9-Nov-05 |
88 |
|
|
|
|
|
|
|
|
|
|
|
|
|
|
|
|
|
|
| 10-Nov-05 |
91 |
|
|
|
|
|
|
|
|
|
|
|
|
|
|
|
|
|
|
| 11-Nov-05 |
101 |
|
|
|
|
|
|
|
|
|
|
|
|
|
|
|
|
|
|
| 12-Nov-05 |
104 |
|
|
|
|
|
|
|
|
|
|
|
|
|
|
|
|
|
|
| 13-Nov-05 |
101 |
|
|
|
|
|
|
|
|
|
|
|
|
|
|
|
|
|
|
| 14-Nov-05 |
98 |
|
|
|
|
|
|
|
|
|
|
|
|
|
|
|
|
|
|
| 15-Nov-05 |
86 |
|
|
|
|
|
|
|
|
|
|
|
|
|
|
|
|
|
|
| 16-Nov-05 |
84 |
|
|
|
|
|
|
|
|
|
|
|
|
|
|
|
|
|
|
| 17-Nov-05 |
86 |
|
|
|
|
|
|
|
|
|
|
|
|
|
|
|
|
|
|
| 18-Nov-05 |
75 |
|
|
|
|
|
|
|
|
|
|
|
|
|
|
|
|
|
|
| 19-Nov-05 |
77 |
|
|
|
|
|
|
|
|
|
|
|
|
|
|
|
|
|
|
| 20-Nov-05 |
94 |
|
|
|
|
|
|
|
|
|
|
|
|
|
|
|
|
|
|
| 21-Nov-05 |
102 |
|
|
|
|
|
|
|
|
|
|
|
|
|
|
|
|
|
|
| 22-Nov-05 |
98 |
|
|
|
|
|
|
|
|
|
|
|
|
|
|
|
|
|
|
| 23-Nov-05 |
94 |
|
|
|
|
|
|
|
|
|
|
|
|
|
|
|
|
|
|
| 24-Nov-05 |
101 |
|
|
|
|
|
|
|
|
|
|
|
|
|
|
|
|
|
|
| 25-Nov-05 |
109 |
|
|
|
|
|
|
|
|
|
|
|
|
|
|
|
|
|
|
| 26-Nov-05 |
114 |
|
|
|
|
|
|
|
|
|
|
|
|
|
|
|
|
|
|
| 27-Nov-05 |
120 |
|
|
|
|
|
|
|
|
|
|
|
|
|
|
|
|
|
|
| 28-Nov-05 |
124 |
|
|
|
|
|
|
|
|
|
|
|
|
|
|
|
|
|
|
| 29-Nov-05 |
125 |
|
|
|
|
|
|
|
|
|
|
|
|
|
|
|
|
|
|
| 30-Nov-05 |
128 |
|
|
|
|
|
|
|
|
|
|
|
|
|
|
|
|
|
|
| 1-Dec-05 |
134 |
|
|
|
|
|
|
|
|
|
|
|
|
|
|
|
|
|
|
| 2-Dec-05 |
130 |
|
|
|
|
|
|
|
|
|
|
|
|
|
|
|
|
|
|
| 3-Dec-05 |
126 |
|
|
|
|
|
|
|
|
|
|
|
|
|
|
|
|
|
|
| 4-Dec-05 |
125 |
|
|
|
|
|
|
|
|
|
|
|
|
|
|
|
|
|
|
| 5-Dec-05 |
118 |
|
|
|
|
|
|
|
|
|
|
|
|
|
|
|
|
|
|
| 6-Dec-05 |
112 |
|
|
|
|
|
|
|
|
|
|
|
|
|
|
|
|
|
|
| 7-Dec-05 |
114 |
|
|
|
|
|
|
|
|
|
|
|
|
|
|
|
|
|
|
| 8-Dec-05 |
122 |
|
|
|
|
|
|
|
|
|
|
|
|
|
|
|
|
|
|
| 9-Dec-05 |
127 |
|
|
|
|
|
|
|
|
|
|
|
|
|
|
|
|
|
|
| 10-Dec-05 |
128 |
|
|
|
|
|
|
|
|
|
|
|
|
|
|
|
|
|
|
| 11-Dec-05 |
121 |
|
|
|
|
|
|
|
|
|
|
|
|
|
|
|
|
|
|
| 12-Dec-05 |
103 |
|
|
|
|
|
|
|
|
|
|
|
|
|
|
|
|
|
|
| 13-Dec-05 |
94 |
|
|
|
|
|
|
|
|
|
|
|
|
|
|
|
|
|
|
| 14-Dec-05 |
90 |
|
|
|
|
|
|
|
|
|
|
|
|
|
|
|
|
|
|
| 15-Dec-05 |
80 |
|
|
|
|
|
|
|
|
|
|
|
|
|
|
|
|
|
|
| 16-Dec-05 |
70 |
|
|
|
|
|
|
|
|
|
|
|
|
|
|
|
|
|
|
| 17-Dec-05 |
70 |
|
|
|
|
|
|
|
|
|
|
|
|
|
|
|
|
|
|
| 18-Dec-05 |
80 |
|
|
|
|
|
|
|
|
|
|
|
|
|
|
|
|
|
|
| 19-Dec-05 |
86 |
|
|
|
|
|
|
|
|
|
|
|
|
|
|
|
|
|
|
| 20-Dec-05 |
93 |
|
|
|
|
|
|
|
|
|
|
|
|
|
|
|
|
|
|
| 21-Dec-05 |
93 |
|
|
|
|
|
|
|
|
|
|
|
|
|
|
|
|
|
|
| 22-Dec-05 |
92 |
|
|
|
|
|
|
|
|
|
|
|
|
|
|
|
|
|
|
| 23-Dec-05 |
97 |
|
|
|
|
|
|
|
|
|
|
|
|
|
|
|
|
|
|
| 24-Dec-05 |
108 |
|
|
|
|
|
|
|
|
|
|
|
|
|
|
|
|
|
|
| 25-Dec-05 |
123 |
|
|
|
|
|
|
|
|
|
|
|
|
|
|
|
|
|
|
| 26-Dec-05 |
128 |
|
|
|
|
|
|
|
|
|
|
|
|
|
|
|
|
|
|
| 27-Dec-05 |
125 |
|
|
|
|
|
|
|
|
|
|
|
|
|
|
|
|
|
|
| 28-Dec-05 |
123 |
|
|
|
|
|
|
|
|
|
|
|
|
|
|
|
|
|
|
| 29-Dec-05 |
128 |
|
|
|
|
|
|
|
|
|
|
|
|
|
|
|
|
|
|
| 30-Dec-05 |
131 |
|
|
|
|
|
|
|
|
|
|
|
|
|
|
|
|
|
|
| 31-Dec-05 |
121 |
|
|
|
|
|
|
|
|
|
|
|
|
|
|
|
|
|
|
| 1-Jan-06 |
115 |
|
|
|
|
|
|
|
|
|
|
|
|
|
|
|
|
|
|
| 2-Jan-06 |
89 |
|
|
|
|
|
|
|
|
|
|
|
|
|
|
|
|
|
|
| 3-Jan-06 |
63 |
|
|
|
|
|
|
|
|
|
|
|
|
|
|
|
|
|
|
| 4-Jan-06 |
65 |
|
|
|
|
|
|
|
|
|
|
|
|
|
|
|
|
|
|
| 5-Jan-06 |
67 |
|
|
|
|
|
|
|
|
|
|
|
|
|
|
|
|
|
|
| 6-Jan-06 |
89 |
|
|
|
|
|
|
|
|
|
|
|
|
|
|
|
|
|
|
| 7-Jan-06 |
102 |
|
|
|
|
|
|
|
|
|
|
|
|
|
|
|
|
|
|
| 8-Jan-06 |
120 |
|
|
|
|
|
|
|
|
|
|
|
|
|
|
|
|
|
|
| 9-Jan-06 |
128 |
|
|
|
|
|
|
|
|
|
|
|
|
|
|
|
|
|
|
| 10-Jan-06 |
106 |
|
|
|
|
|
|
|
|
|
|
|
|
|
|
|
|
|
|
| 11-Jan-06 |
80 |
|
|
|
|
|
|
|
|
|
|
|
|
|
|
|
|
|
|
| 12-Jan-06 |
82 |
|
|
|
|
|
|
|
|
|
|
|
|
|
|
|
|
|
|
| 13-Jan-06 |
90 |
|
|
|
|
|
|
|
|
|
|
|
|
|
|
|
|
|
|
| 14-Jan-06 |
98 |
|
|
|
|
|
|
|
|
|
|
|
|
|
|
|
|
|
|
| 15-Jan-06 |
109 |
|
|
|
|
|
|
|
|
|
|
|
|
|
|
|
|
|
|
| 16-Jan-06 |
108 |
|
|
|
|
|
|
|
|
|
|
|
|
|
|
|
|
|
|
| 17-Jan-06 |
107 |
|
|
|
|
|
|
|
|
|
|
|
|
|
|
|
|
|
|
| 18-Jan-06 |
91 |
|
|
|
|
|
|
|
|
|
|
|
|
|
|
|
|
|
|
| 19-Jan-06 |
81 |
|
|
|
|
|
|
|
|
|
|
|
|
|
|
|
|
|
|
| 20-Jan-06 |
81 |
|
|
|
|
|
|
|
|
|
|
|
|
|
|
|
|
|
|
| 21-Jan-06 |
66 |
|
|
|
|
|
|
|
|
|
|
|
|
|
|
|
|
|
|
| 22-Jan-06 |
61 |
|
|
|
|
|
|
|
|
|
|
|
|
|
|
|
|
|
|
| 23-Jan-06 |
59 |
|
|
|
|
|
|
|
|
|
|
|
|
|
|
|
|
|
|
| 24-Jan-06 |
79 |
|
|
|
|
|
|
|
|
|
|
|
|
|
|
|
|
|
|
| 25-Jan-06 |
97 |
|
|
|
|
|
|
|
|
|
|
|
|
|
|
|
|
|
|
| 26-Jan-06 |
96 |
|
|
|
|
|
|
|
|
|
|
|
|
|
|
|
|
|
|
| 27-Jan-06 |
100 |
|
|
|
|
|
|
|
|
|
|
|
|
|
|
|
|
|
|
| 28-Jan-06 |
104 |
|
|
|
|
|
|
|
|
|
|
|
|
|
|
|
|
|
|
| 29-Jan-06 |
107 |
|
|
|
|
|
|
|
|
|
|
|
|
|
|
|
|
|
|
| 30-Jan-06 |
70 |
|
|
|
|
|
|
|
|
|
|
|
|
|
|
|
|
|
|
| 31-Jan-06 |
15 |
|
|
|
|
|
|
|
|
|
|
|
|
|
|
|
|
|
|
| 1-Feb-06 |
4 |
|
|
|
|
|
|
|
|
|
|
|
|
|
|
|
|
|
|
| 2-Feb-06 |
4 |
|
|
|
|
|
|
|
|
|
|
|
|
|
|
|
|
|
|
| 3-Feb-06 |
4 |
|
|
|
|
|
|
|
|
|
|
|
|
|
|
|
|
|
|
| 4-Feb-06 |
19 |
|
|
|
|
|
|
|
|
|
|
|
|
|
|
|
|
|
|
| 5-Feb-06 |
81 |
|
|
|
|
|
|
|
|
|
|
|
|
|
|
|
|
|
|
| 6-Feb-06 |
118 |
|
|
|
|
|
|
|
|
|
|
|
|
|
|
|
|
|
|
| 7-Feb-06 |
119 |
|
|
|
|
|
|
|
|
|
|
|
|
|
|
|
|
|
|
| 8-Feb-06 |
111 |
|
|
|
|
|
|
|
|
|
|
|
|
|
|
|
|
|
|
| 9-Feb-06 |
116 |
|
|
|
|
|
|
|
|
|
|
|
|
|
|
|
|
|
|
| 10-Feb-06 |
111 |
|
|
|
|
|
|
|
|
|
|
|
|
|
|
|
|
|
|
| 11-Feb-06 |
122 |
|
|
|
|
|
|
|
|
|
|
|
|
|
|
|
|
|
|
| 12-Feb-06 |
118 |
|
|
|
|
|
|
|
|
|
|
|
|
|
|
|
|
|
|
| 13-Feb-06 |
115 |
|
|
|
|
|
|
|
|
|
|
|
|
|
|
|
|
|
|
| 14-Feb-06 |
112 |
|
|
|
|
|
|
|
|
|
|
|
|
|
|
|
|
|
|
| 15-Feb-06 |
107 |
|
|
|
|
|
|
|
|
|
|
|
|
|
|
|
|
|
|
| 16-Feb-06 |
109 |
|
|
|
|
|
|
|
|
|
|
|
|
|
|
|
|
|
|
| 17-Feb-06 |
135 |
|
|
|
|
|
|
|
|
|
|
|
|
|
|
|
|
|
|
| 18-Feb-06 |
128 |
|
|
|
|
|
|
|
|
|
|
|
|
|
|
|
|
|
|
| 19-Feb-06 |
94 |
|
|
|
|
|
|
|
|
|
|
|
|
|
|
|
|
|
|
| 20-Feb-06 |
85 |
|
|
|
|
|
|
|
|
|
|
|
|
|
|
|
|
|
|
| 21-Feb-06 |
27 |
|
|
|
|
|
|
|
|
|
|
|
|
|
|
|
|
|
|
| 22-Feb-06 |
19 |
|
|
|
|
|
|
|
|
|
|
|
|
|
|
|
|
|
|
| 23-Feb-06 |
25 |
|
|
|
|
|
|
|
|
|
|
|
|
|
|
|
|
|
|
| 24-Feb-06 |
12 |
|
|
|
|
|
|
|
|
|
|
|
|
|
|
|
|
|
|
| 25-Feb-06 |
14 |
|
|
|
|
|
|
|
|
|
|
|
|
|
|
|
|
|
|
| 26-Feb-06 |
4 |
|
|
|
|
|
|
|
|
|
|
|
|
|
|
|
|
|
|
| 27-Feb-06 |
39 |
|
|
|
|
|
|
|
|
|
|
|
|
|
|
|
|
|
|
| 28-Feb-06 |
78 |
|
|
|
|
|
|
|
|
|
|
|
|
|
|
|
|
|
|
| 1-Mar-06 |
73 |
|
|
|
|
|
|
|
|
|
|
|
|
|
|
|
|
|
|
| 2-Mar-06 |
73 |
|
|
|
|
|
|
|
|
|
|
|
|
|
|
|
|
|
|
| 3-Mar-06 |
80 |
|
|
|
|
|
|
|
|
|
|
|
|
|
|
|
|
|
|
| 4-Mar-06 |
85 |
|
|
|
|
|
|
|
|
|
|
|
|
|
|
|
|
|
|
| 5-Mar-06 |
93 |
|
|
|
|
|
|
|
|
|
|
|
|
|
|
|
|
|
|
| 6-Mar-06 |
105 |
|
|
|
|
|
|
|
|
|
|
|
|
|
|
|
|
|
|
| 7-Mar-06 |
105 |
|
|
|
|
|
|
|
|
|
|
|
|
|
|
|
|
|
|
| 8-Mar-06 |
104 |
|
|
|
|
|
|
|
|
|
|
|
|
|
|
|
|
|
|
| 9-Mar-06 |
116 |
|
|
|
|
|
|
|
|
|
|
|
|
|
|
|
|
|
|
| 10-Mar-06 |
109 |
|
|
|
|
|
|
|
|
|
|
|
|
|
|
|
|
|
|
| 11-Mar-06 |
109 |
|
|
|
|
|
|
|
|
|
|
|
|
|
|
|
|
|
|
| 12-Mar-06 |
115 |
|
|
|
|
|
|
|
|
|
|
|
|
|
|
|
|
|
|
| 13-Mar-06 |
115 |
|
|
|
|
|
|
|
|
|
|
|
|
|
|
|
|
|
|
| 14-Mar-06 |
|
|
|
|
|
|
|
|
|
|
|
|
|
|
|
|
|
|
|
| 15-Mar-06 |
114 |
|
|
|
|
|
|
|
|
|
|
|
|
|
|
|
|
|
|
| 16-Mar-06 |
101 |
|
|
|
|
|
|
|
|
|
|
|
|
|
|
|
|
|
|
| 17-Mar-06 |
106 |
|
|
|
|
|
|
|
|
|
|
|
|
|
|
|
|
|
|
| 18-Mar-06 |
104 |
|
|
|
|
|
|
|
|
|
|
|
|
|
|
|
|
|
|
| 19-Mar-06 |
103 |
|
|
|
|
|
|
|
|
|
|
|
|
|
|
|
|
|
|
| 20-Mar-06 |
104 |
|
|
|
|
|
|
|
|
|
|
|
|
|
|
|
|
|
|
| 21-Mar-06 |
128 |
|
|
|
|
|
|
|
|
|
|
|
|
|
|
|
|
|
|
| 22-Mar-06 |
120 |
|
|
|
|
|
|
|
|
|
|
|
|
|
|
|
|
|
|
| 23-Mar-06 |
91 |
|
|
|
|
|
|
|
|
|
|
|
|
|
|
|
|
|
|
| 24-Mar-06 |
103 |
|
|
|
|
|
|
|
|
|
|
|
|
|
|
|
|
|
|
| 25-Mar-06 |
87 |
|
|
|
|
|
|
|
|
|
|
|
|
|
|
|
|
|
|
| 26-Mar-06 |
92 |
|
|
|
|
|
|
|
|
|
|
|
|
|
|
|
|
|
|
| 27-Mar-06 |
99 |
|
|
|
|
|
|
|
|
|
|
|
|
|
|
|
|
|
|
| 28-Mar-06 |
92 |
|
|
|
|
|
|
|
|
|
|
|
|
|
|
|
|
|
|
| 29-Mar-06 |
107 |
|
|
|
|
|
|
|
|
|
|
|
|
|
|
|
|
|
|
| 30-Mar-06 |
101 |
|
|
|
|
|
|
|
|
|
|
|
|
|
|
|
|
|
|
| 31-Mar-06 |
110 |
|
|
|
|
|
|
|
|
|
|
|
|
|
|
|
|
|
|
| 1-Apr-06 |
99 |
|
|
|
|
|
|
|
|
|
|
|
|
|
|
|
|
|
|
| 2-Apr-06 |
102 |
|
|
|
|
|
|
|
|
|
|
|
|
|
|
|
|
|
|
| 3-Apr-06 |
109 |
|
|
|
|
|
|
|
|
|
|
|
|
|
|
|
|
|
|
| 4-Apr-06 |
112 |
|
|
|
|
|
|
|
|
|
|
|
|
|
|
|
|
|
|
| 5-Apr-06 |
130 |
|
|
|
|
|
|
|
|
|
|
|
|
|
|
|
|
|
|
| 6-Apr-06 |
148 |
|
|
|
|
|
|
|
|
|
|
|
|
|
|
|
|
|
|
| 7-Apr-06 |
186 |
|
|
|
|
|
|
|
|
|
|
|
|
|
|
|
|
|
|
| 8-Apr-06 |
175 |
|
|
|
|
|
|
|
|
|
|
|
|
|
|
|
|
|
|
| 9-Apr-06 |
181 |
|
|
|
|
|
|
|
|
|
|
|
|
|
|
|
|
|
|
| 10-Apr-06 |
163 |
|
|
|
|
|
|
|
|
|
|
|
|
|
|
|
|
|
|
| 11-Apr-06 |
158 |
|
|
|
|
|
|
|
|
|
|
|
|
|
|
|
|
|
|
| 12-Apr-06 |
153 |
|
|
|
|
|
|
|
|
|
|
|
|
|
|
|
|
|
|
| 13-Apr-06 |
152 |
|
|
|
|
|
|
|
|
|
|
|
|
|
|
|
|
|
|
| 14-Apr-06 |
157 |
|
|
|
|
|
|
|
|
|
|
|
|
|
|
|
|
|
|
| 15-Apr-06 |
166 |
|
|
|
|
|
|
|
|
|
|
|
|
|
|
|
|
|
|
| 16-Apr-06 |
178 |
|
|
|
|
|
|
|
|
|
|
|
|
|
|
|
|
|
|
| 17-Apr-06 |
177 |
|
|
|
|
|
|
|
|
|
|
|
|
|
|
|
|
|
|
| 18-Apr-06 |
143 |
|
|
|
|
|
|
|
|
|
|
|
|
|
|
|
|
|
|
| 19-Apr-06 |
153 |
|
|
|
|
|
|
|
|
|
|
|
|
|
|
|
|
|
|
| 20-Apr-06 |
157 |
|
|
|
|
|
|
|
|
|
|
|
|
|
|
|
|
|
|
| 21-Apr-06 |
169 |
|
|
|
|
|
|
|
|
|
|
|
|
|
|
|
|
|
|
| 22-Apr-06 |
206 |
|
|
|
|
|
|
|
|
|
|
|
|
|
|
|
|
|
|
| 23-Apr-06 |
199 |
|
|
|
|
|
|
|
|
|
|
|
|
|
|
|
|
|
|
| 24-Apr-06 |
186 |
|
|
|
|
|
|
|
|
|
|
|
|
|
|
|
|
|
|
| 25-Apr-06 |
179 |
|
|
|
|
|
|
|
|
|
|
|
|
|
|
|
|
|
|
| 26-Apr-06 |
215 |
|
|
|
|
|
|
|
|
|
|
|
|
|
|
|
|
|
|
| 27-Apr-06 |
226 |
|
|
|
|
|
|
|
|
|
|
|
|
|
|
|
|
|
|
| 28-Apr-06 |
231 |
|
|
|
|
|
|
|
|
|
|
|
|
|
|
|
|
|
|
| 29-Apr-06 |
234 |
|
|
|
|
|
|
|
|
|
|
|
|
|
|
|
|
|
|
| 30-Apr-06 |
222 |
|
|
|
|
|
|
|
|
|
|
|
|
|
|
|
|
|
|
| 1-May-06 |
219 |
|
|
|
|
|
|
|
|
|
|
|
|
|
|
|
|
|
|
| 2-May-06 |
228 |
|
|
|
|
|
|
|
|
|
|
|
|
|
|
|
|
|
|
| 3-May-06 |
209 |
|
|
|
|
|
|
|
|
|
|
|
|
|
|
|
|
|
|
| 4-May-06 |
215 |
|
|
|
|
|
|
|
|
|
|
|
|
|
|
|
|
|
|
| 5-May-06 |
224 |
|
|
|
|
|
|
|
|
|
|
|
|
|
|
|
|
|
|
| 6-May-06 |
241 |
|
|
|
|
|
|
|
|
|
|
|
|
|
|
|
|
|
|
| 7-May-06 |
257 |
|
|
|
|
|
|
|
|
|
|
|
|
|
|
|
|
|
|
| 8-May-06 |
244 |
|
|
|
|
|
|
|
|
|
|
|
|
|
|
|
|
|
|
| 9-May-06 |
231 |
|
|
|
|
|
|
|
|
|
|
|
|
|
|
|
|
|
|
| 10-May-06 |
227 |
|
|
|
|
|
|
|
|
|
|
|
|
|
|
|
|
|
|
| 11-May-06 |
235 |
|
|
|
|
|
|
|
|
|
|
|
|
|
|
|
|
|
|
| 12-May-06 |
201 |
|
|
|
|
|
|
|
|
|
|
|
|
|
|
|
|
|
|
| 13-May-06 |
216 |
|
|
|
|
|
|
|
|
|
|
|
|
|
|
|
|
|
|
| 14-May-06 |
228 |
|
|
|
|
|
|
|
|
|
|
|
|
|
|
|
|
|
|
| 15-May-06 |
226 |
|
|
|
|
|
|
|
|
|
|
|
|
|
|
|
|
|
|
| 16-May-06 |
236 |
|
|
|
|
|
|
|
|
|
|
|
|
|
|
|
|
|
|
| 17-May-06 |
240 |
|
|
|
|
|
|
|
|
|
|
|
|
|
|
|
|
|
|
| 18-May-06 |
251 |
|
|
|
|
|
|
|
|
|
|
|
|
|
|
|
|
|
|
| 19-May-06 |
244 |
|
|
|
|
|
|
|
|
|
|
|
|
|
|
|
|
|
|
| 20-May-06 |
240 |
|
|
|
|
|
|
|
|
|
|
|
|
|
|
|
|
|
|
| 21-May-06 |
229 |
|
|
|
|
|
|
|
|
|
|
|
|
|
|
|
|
|
|
| 22-May-06 |
217 |
|
|
|
|
|
|
|
|
|
|
|
|
|
|
|
|
|
|
| 23-May-06 |
213 |
|
|
|
|
|
|
|
|
|
|
|
|
|
|
|
|
|
|
| 24-May-06 |
190 |
|
|
|
|
|
|
|
|
|
|
|
|
|
|
|
|
|
|
| 25-May-06 |
219 |
|
|
|
|
|
|
|
|
|
|
|
|
|
|
|
|
|
|
| 26-May-06 |
206 |
|
|
|
|
|
|
|
|
|
|
|
|
|
|
|
|
|
|
| 27-May-06 |
201 |
|
|
|
|
|
|
|
|
|
|
|
|
|
|
|
|
|
|
| 28-May-06 |
206 |
|
|
|
|
|
|
|
|
|
|
|
|
|
|
|
|
|
|
| 29-May-06 |
202 |
|
|
|
|
|
|
|
|
|
|
|
|
|
|
|
|
|
|
| 30-May-06 |
210 |
|
|
|
|
|
|
|
|
|
|
|
|
|
|
|
|
|
|
| 31-May-06 |
214 |
|
|
|
|
|
|
|
|
|
|
|
|
|
|
|
|
|
|
| 1-Jun-06 |
207 |
|
|
|
|
|
|
|
|
|
|
|
|
|
|
|
|
|
|
| 2-Jun-06 |
196 |
|
|
|
|
|
|
|
|
|
|
|
|
|
|
|
|
|
|
| 3-Jun-06 |
214 |
|
|
|
|
|
|
|
|
|
|
|
|
|
|
|
|
|
|
| 4-Jun-06 |
213 |
|
|
|
|
|
|
|
|
|
|
|
|
|
|
|
|
|
|
| 5-Jun-06 |
232 |
|
|
|
|
|
|
|
|
|
|
|
|
|
|
|
|
|
|
| 6-Jun-06 |
223 |
|
|
|
|
|
|
|
|
|
|
|
|
|
|
|
|
|
|
| 7-Jun-06 |
213 |
|
|
|
|
|
|
|
|
|
|
|
|
|
|
|
|
|
|
| 8-Jun-06 |
216 |
|
|
|
|
|
|
|
|
|
|
|
|
|
|
|
|
|
|
| 9-Jun-06 |
216 |
|
|
|
|
|
|
|
|
|
|
|
|
|
|
|
|
|
|
| 10-Jun-06 |
215 |
|
|
|
|
|
|
|
|
|
|
|
|
|
|
|
|
|
|
| 11-Jun-06 |
212 |
|
|
|
|
|
|
|
|
|
|
|
|
|
|
|
|
|
|
| 12-Jun-06 |
194 |
|
|
|
|
|
|
|
|
|
|
|
|
|
|
|
|
|
|
| 13-Jun-06 |
219 |
|
|
|
|
|
|
|
|
|
|
|
|
|
|
|
|
|
|
| 14-Jun-06 |
226 |
|
|
|
|
|
|
|
|
|
|
|
|
|
|
|
|
|
|
| 15-Jun-06 |
228 |
|
|
|
|
|
|
|
|
|
|
|
|
|
|
|
|
|
|
| 16-Jun-06 |
191 |
|
|
|
|
|
|
|
|
|
|
|
|
|
|
|
|
|
|
| 17-Jun-06 |
193 |
|
|
|
|
|
|
|
|
|
|
|
|
|
|
|
|
|
|
| 18-Jun-06 |
193 |
|
|
|
|
|
|
|
|
|
|
|
|
|
|
|
|
|
|
| 19-Jun-06 |
189 |
|
|
|
|
|
|
|
|
|
|
|
|
|
|
|
|
|
|
| 20-Jun-06 |
208 |
|
|
|
|
|
|
|
|
|
|
|
|
|
|
|
|
|
|
| 21-Jun-06 |
214 |
|
|
|
|
|
|
|
|
|
|
|
|
|
|
|
|
|
|
| 22-Jun-06 |
219 |
|
|
|
|
|
|
|
|
|
|
|
|
|
|
|
|
|
|
| 23-Jun-06 |
254 |
|
|
|
|
|
|
|
|
|
|
|
|
|
|
|
|
|
|
| 24-Jun-06 |
254 |
|
|
|
|
|
|
|
|
|
|
|
|
|
|
|
|
|
|
| 25-Jun-06 |
258 |
|
|
|
|
|
|
|
|
|
|
|
|
|
|
|
|
|
|
| 26-Jun-06 |
232 |
|
|
|
|
|
|
|
|
|
|
|
|
|
|
|
|
|
|
| 27-Jun-06 |
212 |
|
|
|
|
|
|
|
|
|
|
|
|
|
|
|
|
|
|
| 28-Jun-06 |
182 |
|
|
|
|
|
|
|
|
|
|
|
|
|
|
|
|
|
|
| 29-Jun-06 |
225 |
|
|
|
|
|
|
|
|
|
|
|
|
|
|
|
|
|
|
| 30-Jun-06 |
222 |
|
|
|
|
|
|
|
|
|
|
|
|
|
|
|
|
|
|
| 1-Jul-06 |
217 |
|
|
|
|
|
|
|
|
|
|
|
|
|
|
|
|
|
|
| 2-Jul-06 |
213 |
|
|
|
|
|
|
|
|
|
|
|
|
|
|
|
|
|
|
| 3-Jul-06 |
210 |
|
|
|
|
|
|
|
|
|
|
|
|
|
|
|
|
|
|
| 4-Jul-06 |
222 |
|
|
|
|
|
|
|
|
|
|
|
|
|
|
|
|
|
|
| 5-Jul-06 |
227 |
|
|
|
|
|
|
|
|
|
|
|
|
|
|
|
|
|
|
| 6-Jul-06 |
246 |
|
|
|
|
|
|
|
|
|
|
|
|
|
|
|
|
|
|
| 7-Jul-06 |
235 |
|
|
|
|
|
|
|
|
|
|
|
|
|
|
|
|
|
|
| 8-Jul-06 |
245 |
|
|
|
|
|
|
|
|
|
|
|
|
|
|
|
|
|
|
| 9-Jul-06 |
234 |
|
|
|
|
|
|
|
|
|
|
|
|
|
|
|
|
|
|
| 10-Jul-06 |
223 |
|
|
|
|
|
|
|
|
|
|
|
|
|
|
|
|
|
|
| 11-Jul-06 |
225 |
|
|
|
|
|
|
|
|
|
|
|
|
|
|
|
|
|
|
| 12-Jul-06 |
201 |
|
|
|
|
|
|
|
|
|
|
|
|
|
|
|
|
|
|
| 13-Jul-06 |
187 |
|
|
|
|
|
|
|
|
|
|
|
|
|
|
|
|
|
|
| 14-Jul-06 |
177 |
|
|
|
|
|
|
|
|
|
|
|
|
|
|
|
|
|
|
| 15-Jul-06 |
183 |
|
|
|
|
|
|
|
|
|
|
|
|
|
|
|
|
|
|
| 16-Jul-06 |
176 |
|
|
|
|
|
|
|
|
|
|
|
|
|
|
|
|
|
|
| 17-Jul-06 |
166 |
|
|
|
|
|
|
|
|
|
|
|
|
|
|
|
|
|
|
| 18-Jul-06 |
155 |
|
|
|
|
|
|
|
|
|
|
|
|
|
|
|
|
|
|
| 19-Jul-06 |
138 |
|
|
|
|
|
|
|
|
|
|
|
|
|
|
|
|
|
|
| 20-Jul-06 |
128 |
|
|
|
|
|
|
|
|
|
|
|
|
|
|
|
|
|
|
| 21-Jul-06 |
128 |
|
|
|
|
|
|
|
|
|
|
|
|
|
|
|
|
|
|
| 22-Jul-06 |
148 |
|
|
|
|
|
|
|
|
|
|
|
|
|
|
|
|
|
|
| 23-Jul-06 |
125 |
|
|
|
|
|
|
|
|
|
|
|
|
|
|
|
|
|
|
| 24-Jul-06 |
148 |
|
|
|
|
|
|
|
|
|
|
|
|
|
|
|
|
|
|
| 25-Jul-06 |
154 |
|
|
|
|
|
|
|
|
|
|
|
|
|
|
|
|
|
|
| 26-Jul-06 |
148 |
|
|
|
|
|
|
|
|
|
|
|
|
|
|
|
|
|
|
| 27-Jul-06 |
170 |
|
|
|
|
|
|
|
|
|
|
|
|
|
|
|
|
|
|
| 28-Jul-06 |
247 |
|
|
|
|
|
|
|
|
|
|
|
|
|
|
|
|
|
|
| 29-Jul-06 |
262 |
|
|
|
|
|
|
|
|
|
|
|
|
|
|
|
|
|
|
| 30-Jul-06 |
262 |
|
|
|
|
|
|
|
|
|
|
|
|
|
|
|
|
|
|
| 31-Jul-06 |
271 |
|
|
|
|
|
|
|
|
|
|
|
|
|
|
|
|
|
|
| 1-Aug-06 |
216 |
|
|
|
|
|
|
|
|
|
|
|
|
|
|
|
|
|
|
| 2-Aug-06 |
199 |
|
|
|
|
|
|
|
|
|
|
|
|
|
|
|
|
|
|
| 3-Aug-06 |
160 |
|
|
|
|
|
|
|
|
|
|
|
|
|
|
|
|
|
|
| 4-Aug-06 |
160 |
|
|
|
|
|
|
|
|
|
|
|
|
|
|
|
|
|
|
| 5-Aug-06 |
139 |
|
|
|
|
|
|
|
|
|
|
|
|
|
|
|
|
|
|
| 6-Aug-06 |
145 |
|
|
|
|
|
|
|
|
|
|
|
|
|
|
|
|
|
|
| 7-Aug-06 |
159 |
|
|
|
|
|
|
|
|
|
|
|
|
|
|
|
|
|
|
| 8-Aug-06 |
162 |
|
|
|
|
|
|
|
|
|
|
|
|
|
|
|
|
|
|
| 9-Aug-06 |
161 |
|
|
|
|
|
|
|
|
|
|
|
|
|
|
|
|
|
|
| 10-Aug-06 |
171 |
|
|
|
|
|
|
|
|
|
|
|
|
|
|
|
|
|
|
| 11-Aug-06 |
165 |
|
|
|
|
|
|
|
|
|
|
|
|
|
|
|
|
|
|
| 12-Aug-06 |
155 |
|
|
|
|
|
|
|
|
|
|
|
|
|
|
|
|
|
|
| 13-Aug-06 |
142 |
|
|
|
|
|
|
|
|
|
|
|
|
|
|
|
|
|
|
| 14-Aug-06 |
133 |
|
|
|
|
|
|
|
|
|
|
|
|
|
|
|
|
|
|
| 15-Aug-06 |
129 |
|
|
|
|
|
|
|
|
|
|
|
|
|
|
|
|
|
|
| 16-Aug-06 |
140 |
|
|
|
|
|
|
|
|
|
|
|
|
|
|
|
|
|
|
| 17-Aug-06 |
141 |
|
|
|
|
|
|
|
|
|
|
|
|
|
|
|
|
|
|
| 18-Aug-06 |
132 |
|
|
|
|
|
|
|
|
|
|
|
|
|
|
|
|
|
|
| 19-Aug-06 |
128 |
|
|
|
|
|
|
|
|
|
|
|
|
|
|
|
|
|
|
| 20-Aug-06 |
111 |
|
|
|
|
|
|
|
|
|
|
|
|
|
|
|
|
|
|
| 21-Aug-06 |
104 |
|
|
|
|
|
|
|
|
|
|
|
|
|
|
|
|
|
|
| 22-Aug-06 |
91 |
|
|
|
|
|
|
|
|
|
|
|
|
|
|
|
|
|
|
| 23-Aug-06 |
103 |
|
|
|
|
|
|
|
|
|
|
|
|
|
|
|
|
|
|
| 24-Aug-06 |
105 |
|
|
|
|
|
|
|
|
|
|
|
|
|
|
|
|
|
|
| 25-Aug-06 |
112 |
|
|
|
|
|
|
|
|
|
|
|
|
|
|
|
|
|
|
| 26-Aug-06 |
124 |
|
|
|
|
|
|
|
|
|
|
|
|
|
|
|
|
|
|
| 27-Aug-06 |
114 |
|
|
|
|
|
|
|
|
|
|
|
|
|
|
|
|
|
|
| 28-Aug-06 |
122 |
|
|
|
|
|
|
|
|
|
|
|
|
|
|
|
|
|
|
| 29-Aug-06 |
107 |
|
|
|
|
|
|
|
|
|
|
|
|
|
|
|
|
|
|
| 30-Aug-06 |
102 |
|
|
|
|
|
|
|
|
|
|
|
|
|
|
|
|
|
|
| 31-Aug-06 |
108 |
|
|
|
|
|
|
|
|
|
|
|
|
|
|
|
|
|
|
| 1-Sep-06 |
108 |
|
|
|
|
|
|
|
|
|
|
|
|
|
|
|
|
|
|
| 2-Sep-06 |
119 |
|
|
|
|
|
|
|
|
|
|
|
|
|
|
|
|
|
|
| 3-Sep-06 |
125 |
|
|
|
|
|
|
|
|
|
|
|
|
|
|
|
|
|
|
| 4-Sep-06 |
114 |
|
|
|
|
|
|
|
|
|
|
|
|
|
|
|
|
|
|
| 5-Sep-06 |
104 |
|
|
|
|
|
|
|
|
|
|
|
|
|
|
|
|
|
|
| 6-Sep-06 |
116 |
|
|
|
|
|
|
|
|
|
|
|
|
|
|
|
|
|
|
| 7-Sep-06 |
124 |
|
|
|
|
|
|
|
|
|
|
|
|
|
|
|
|
|
|
| 8-Sep-06 |
135 |
|
|
|
|
|
|
|
|
|
|
|
|
|
|
|
|
|
|
| 9-Sep-06 |
124 |
|
|
|
|
|
|
|
|
|
|
|
|
|
|
|
|
|
|
| 10-Sep-06 |
120 |
|
|
|
|
|
|
|
|
|
|
|
|
|
|
|
|
|
|
| 11-Sep-06 |
120 |
|
|
|
|
|
|
|
|
|
|
|
|
|
|
|
|
|
|
| 12-Sep-06 |
119 |
|
|
|
|
|
|
|
|
|
|
|
|
|
|
|
|
|
|
| 13-Sep-06 |
120 |
|
|
|
|
|
|
|
|
|
|
|
|
|
|
|
|
|
|
| 14-Sep-06 |
115 |
|
|
|
|
|
|
|
|
|
|
|
|
|
|
|
|
|
|
| 15-Sep-06 |
111 |
|
|
|
|
|
|
|
|
|
|
|
|
|
|
|
|
|
|
| 16-Sep-06 |
99 |
|
|
|
|
|
|
|
|
|
|
|
|
|
|
|
|
|
|
| 17-Sep-06 |
102 |
|
|
|
|
|
|
|
|
|
|
|
|
|
|
|
|
|
|
| 18-Sep-06 |
109 |
|
|
|
|
|
|
|
|
|
|
|
|
|
|
|
|
|
|
| 19-Sep-06 |
105 |
|
|
|
|
|
|
|
|
|
|
|
|
|
|
|
|
|
|
| 20-Sep-06 |
123 |
|
|
|
|
|
|
|
|
|
|
|
|
|
|
|
|
|
|
| 21-Sep-06 |
126 |
|
|
|
|
|
|
|
|
|
|
|
|
|
|
|
|
|
|
| 22-Sep-06 |
118 |
|
|
|
|
|
|
|
|
|
|
|
|
|
|
|
|
|
|
| 23-Sep-06 |
136 |
|
|
|
|
|
|
|
|
|
|
|
|
|
|
|
|
|
|
| 24-Sep-06 |
116 |
|
|
|
|
|
|
|
|
|
|
|
|
|
|
|
|
|
|
| 25-Sep-06 |
115 |
|
|
|
|
|
|
|
|
|
|
|
|
|
|
|
|
|
|
| 26-Sep-06 |
105 |
|
|
|
|
|
|
|
|
|
|
|
|
|
|
|
|
|
|
| 27-Sep-06 |
93 |
|
|
|
|
|
|
|
|
|
|
|
|
|
|
|
|
|
|
| 28-Sep-06 |
99 |
|
|
|
|
|
|
|
|
|
|
|
|
|
|
|
|
|
|
| 29-Sep-06 |
96 |
|
|
|
|
|
|
|
|
|
|
|
|
|
|
|
|
|
|
| 30-Sep-06 |
116 |
|
|
|
|
|
|
|
|
|
|
|
|
|
|
|
|
|
|
| 1-Oct-06 |
130 |
|
|
|
|
|
|
|
|
|
|
|
|
|
|
|
|
|
|
| 2-Oct-06 |
120 |
|
|
|
|
|
|
|
|
|
|
|
|
|
|
|
|
|
|
| 3-Oct-06 |
133 |
|
|
|
|
|
|
|
|
|
|
|
|
|
|
|
|
|
|
| 4-Oct-06 |
148 |
|
|
|
|
|
|
|
|
|
|
|
|
|
|
|
|
|
|
| 5-Oct-06 |
107 |
|
|
|
|
|
|
|
|
|
|
|
|
|
|
|
|
|
|
| 6-Oct-06 |
105 |
|
|
|
|
|
|
|
|
|
|
|
|
|
|
|
|
|
|
| 7-Oct-06 |
101 |
|
|
|
|
|
|
|
|
|
|
|
|
|
|
|
|
|
|
| 8-Oct-06 |
91 |
|
|
|
|
|
|
|
|
|
|
|
|
|
|
|
|
|
|
| 9-Oct-06 |
106 |
|
|
|
|
|
|
|
|
|
|
|
|
|
|
|
|
|
|
| 10-Oct-06 |
124 |
|
|
|
|
|
|
|
|
|
|
|
|
|
|
|
|
|
|
| 11-Oct-06 |
126 |
|
|
|
|
|
|
|
|
|
|
|
|
|
|
|
|
|
|
| 12-Oct-06 |
119 |
|
|
|
|
|
|
|
|
|
|
|
|
|
|
|
|
|
|
| 13-Oct-06 |
123 |
|
|
|
|
|
|
|
|
|
|
|
|
|
|
|
|
|
|
| 14-Oct-06 |
102 |
|
|
|
|
|
|
|
|
|
|
|
|
|
|
|
|
|
|
| 15-Oct-06 |
87 |
|
|
|
|
|
|
|
|
|
|
|
|
|
|
|
|
|
|
| 16-Oct-06 |
94 |
|
|
|
|
|
|
|
|
|
|
|
|
|
|
|
|
|
|
| 17-Oct-06 |
94 |
|
|
|
|
|
|
|
|
|
|
|
|
|
|
|
|
|
|
| 18-Oct-06 |
110 |
|
|
|
|
|
|
|
|
|
|
|
|
|
|
|
|
|
|
| 19-Oct-06 |
111 |
|
|
|
|
|
|
|
|
|
|
|
|
|
|
|
|
|
|
| 20-Oct-06 |
106 |
|
|
|
|
|
|
|
|
|
|
|
|
|
|
|
|
|
|
| 21-Oct-06 |
104 |
|
|
|
|
|
|
|
|
|
|
|
|
|
|
|
|
|
|
| 22-Oct-06 |
81 |
|
|
|
|
|
|
|
|
|
|
|
|
|
|
|
|
|
|
| 23-Oct-06 |
71 |
|
|
|
|
|
|
|
|
|
|
|
|
|
|
|
|
|
|
| 24-Oct-06 |
71 |
|
|
|
|
|
|
|
|
|
|
|
|
|
|
|
|
|
|
| 25-Oct-06 |
65 |
|
|
|
|
|
|
|
|
|
|
|
|
|
|
|
|
|
|
| 26-Oct-06 |
94 |
|
|
|
|
|
|
|
|
|
|
|
|
|
|
|
|
|
|
| 27-Oct-06 |
91 |
|
|
|
|
|
|
|
|
|
|
|
|
|
|
|
|
|
|
| 28-Oct-06 |
100 |
|
|
|
|
|
|
|
|
|
|
|
|
|
|
|
|
|
|
| 29-Oct-06 |
111 |
|
|
|
|
|
|
|
|
|
|
|
|
|
|
|
|
|
|
| 30-Oct-06 |
117 |
|
|
|
|
|
|
|
|
|
|
|
|
|
|
|
|
|
|
| 31-Oct-06 |
118 |
|
|
|
|
|
|
|
|
|
|
|
|
|
|
|
|
|
|
| 1-Nov-06 |
127 |
|
|
|
|
|
|
|
|
|
|
|
|
|
|
|
|
|
|
| 2-Nov-06 |
129 |
|
|
|
|
|
|
|
|
|
|
|
|
|
|
|
|
|
|
| 3-Nov-06 |
126 |
|
|
|
|
|
|
|
|
|
|
|
|
|
|
|
|
|
|
| 4-Nov-06 |
132 |
|
|
|
|
|
|
|
|
|
|
|
|
|
|
|
|
|
|
| 5-Nov-06 |
131 |
|
|
|
|
|
|
|
|
|
|
|
|
|
|
|
|
|
|
| 6-Nov-06 |
124 |
|
|
|
|
|
|
|
|
|
|
|
|
|
|
|
|
|
|
| 7-Nov-06 |
118 |
|
|
|
|
|
|
|
|
|
|
|
|
|
|
|
|
|
|
| 8-Nov-06 |
118 |
|
|
|
|
|
|
|
|
|
|
|
|
|
|
|
|
|
|
| 9-Nov-06 |
108 |
|
|
|
|
|
|
|
|
|
|
|
|
|
|
|
|
|
|
| 10-Nov-06 |
134 |
|
|
|
|
|
|
|
|
|
|
|
|
|
|
|
|
|
|
| 11-Nov-06 |
143 |
|
|
|
|
|
|
|
|
|
|
|
|
|
|
|
|
|
|
| 12-Nov-06 |
132 |
|
|
|
|
|
|
|
|
|
|
|
|
|
|
|
|
|
|
| 13-Nov-06 |
122 |
|
|
|
|
|
|
|
|
|
|
|
|
|
|
|
|
|
|
| 14-Nov-06 |
107 |
|
|
|
|
|
|
|
|
|
|
|
|
|
|
|
|
|
|
| 15-Nov-06 |
70 |
|
|
|
|
|
|
|
|
|
|
|
|
|
|
|
|
|
|
| 16-Nov-06 |
65 |
|
|
|
|
|
|
|
|
|
|
|
|
|
|
|
|
|
|
| 17-Nov-06 |
67 |
|
|
|
|
|
|
|
|
|
|
|
|
|
|
|
|
|
|
| 18-Nov-06 |
64 |
|
|
|
|
|
|
|
|
|
|
|
|
|
|
|
|
|
|
| 19-Nov-06 |
92 |
|
|
|
|
|
|
|
|
|
|
|
|
|
|
|
|
|
|
| 20-Nov-06 |
102 |
|
|
|
|
|
|
|
|
|
|
|
|
|
|
|
|
|
|
| 21-Nov-06 |
124 |
|
|
|
|
|
|
|
|
|
|
|
|
|
|
|
|
|
|
| 22-Nov-06 |
114 |
|
|
|
|
|
|
|
|
|
|
|
|
|
|
|
|
|
|
| 23-Nov-06 |
100 |
|
|
|
|
|
|
|
|
|
|
|
|
|
|
|
|
|
|
| 24-Nov-06 |
99 |
|
|
|
|
|
|
|
|
|
|
|
|
|
|
|
|
|
|
| 25-Nov-06 |
83 |
|
|
|
|
|
|
|
|
|
|
|
|
|
|
|
|
|
|
| 26-Nov-06 |
75 |
|
|
|
|
|
|
|
|
|
|
|
|
|
|
|
|
|
|
| 27-Nov-06 |
105 |
|
|
|
|
|
|
|
|
|
|
|
|
|
|
|
|
|
|
| 28-Nov-06 |
104 |
|
|
|
|
|
|
|
|
|
|
|
|
|
|
|
|
|
|
| 29-Nov-06 |
103 |
|
|
|
|
|
|
|
|
|
|
|
|
|
|
|
|
|
|
| 30-Nov-06 |
116 |
|
|
|
|
|
|
|
|
|
|
|
|
|
|
|
|
|
|
| 1-Dec-06 |
102 |
|
|
|
|
|
|
|
|
|
|
|
|
|
|
|
|
|
|
| 2-Dec-06 |
106 |
|
|
|
|
|
|
|
|
|
|
|
|
|
|
|
|
|
|
| 3-Dec-06 |
116 |
|
|
|
|
|
|
|
|
|
|
|
|
|
|
|
|
|
|
| 4-Dec-06 |
111 |
|
|
|
|
|
|
|
|
|
|
|
|
|
|
|
|
|
|
| 5-Dec-06 |
111 |
|
|
|
|
|
|
|
|
|
|
|
|
|
|
|
|
|
|
| 6-Dec-06 |
122 |
|
|
|
|
|
|
|
|
|
|
|
|
|
|
|
|
|
|
| 7-Dec-06 |
114 |
|
|
|
|
|
|
|
|
|
|
|
|
|
|
|
|
|
|
| 8-Dec-06 |
131 |
|
|
|
|
|
|
|
|
|
|
|
|
|
|
|
|
|
|
| 9-Dec-06 |
128 |
|
|
|
|
|
|
|
|
|
|
|
|
|
|
|
|
|
|
| 10-Dec-06 |
119 |
|
|
|
|
|
|
|
|
|
|
|
|
|
|
|
|
|
|
| 11-Dec-06 |
108 |
|
|
|
|
|
|
|
|
|
|
|
|
|
|
|
|
|
|
| 12-Dec-06 |
113 |
|
|
|
|
|
|
|
|
|
|
|
|
|
|
|
|
|
|
| 13-Dec-06 |
126 |
|
|
|
|
|
|
|
|
|
|
|
|
|
|
|
|
|
|
| 14-Dec-06 |
124 |
|
|
|
|
|
|
|
|
|
|
|
|
|
|
|
|
|
|
| 15-Dec-06 |
140 |
|
|
|
|
|
|
|
|
|
|
|
|
|
|
|
|
|
|
| 16-Dec-06 |
139 |
|
|
|
|
|
|
|
|
|
|
|
|
|
|
|
|
|
|
| 17-Dec-06 |
145 |
|
|
|
|
|
|
|
|
|
|
|
|
|
|
|
|
|
|
| 18-Dec-06 |
149 |
|
|
|
|
|
|
|
|
|
|
|
|
|
|
|
|
|
|
| 19-Dec-06 |
153 |
|
|
|
|
|
|
|
|
|
|
|
|
|
|
|
|
|
|
| 20-Dec-06 |
137 |
|
|
|
|
|
|
|
|
|
|
|
|
|
|
|
|
|
|
| 21-Dec-06 |
132 |
|
|
|
|
|
|
|
|
|
|
|
|
|
|
|
|
|
|
| 22-Dec-06 |
129 |
|
|
|
|
|
|
|
|
|
|
|
|
|
|
|
|
|
|
| 23-Dec-06 |
119 |
|
|
|
|
|
|
|
|
|
|
|
|
|
|
|
|
|
|
| 24-Dec-06 |
114 |
|
|
|
|
|
|
|
|
|
|
|
|
|
|
|
|
|
|
| 25-Dec-06 |
112 |
|
|
|
|
|
|
|
|
|
|
|
|
|
|
|
|
|
|
| 26-Dec-06 |
103 |
|
|
|
|
|
|
|
|
|
|
|
|
|
|
|
|
|
|
| 27-Dec-06 |
106 |
|
|
|
|
|
|
|
|
|
|
|
|
|
|
|
|
|
|
| 28-Dec-06 |
118 |
|
|
|
|
|
|
|
|
|
|
|
|
|
|
|
|
|
|
| 29-Dec-06 |
103 |
|
|
|
|
|
|
|
|
|
|
|
|
|
|
|
|
|
|
| 30-Dec-06 |
101 |
|
|
|
|
|
|
|
|
|
|
|
|
|
|
|
|
|
|
| 31-Dec-06 |
116 |
|
|
|
|
|
|
|
|
|
|
|
|
|
|
|
|
|
|
| 1-Jan-07 |
125 |
|
|
|
|
|
|
|
|
|
|
|
|
|
|
|
|
|
|
| 2-Jan-07 |
108 |
|
|
|
|
|
|
|
|
|
|
|
|
|
|
|
|
|
|
| 3-Jan-07 |
115 |
|
|
|
|
|
|
|
|
|
|
|
|
|
|
|
|
|
|
| 4-Jan-07 |
89 |
|
|
|
|
|
|
|
|
|
|
|
|
|
|
|
|
|
|
| 5-Jan-07 |
94 |
|
|
|
|
|
|
|
|
|
|
|
|
|
|
|
|
|
|
| 6-Jan-07 |
98 |
|
|
|
|
|
|
|
|
|
|
|
|
|
|
|
|
|
|
| 7-Jan-07 |
106 |
|
|
|
|
|
|
|
|
|
|
|
|
|
|
|
|
|
|
| 8-Jan-07 |
108 |
|
|
|
|
|
|
|
|
|
|
|
|
|
|
|
|
|
|
| 9-Jan-07 |
115 |
|
|
|
|
|
|
|
|
|
|
|
|
|
|
|
|
|
|
| 10-Jan-07 |
128 |
|
|
|
|
|
|
|
|
|
|
|
|
|
|
|
|
|
|
| 11-Jan-07 |
125 |
|
|
|
|
|
|
|
|
|
|
|
|
|
|
|
|
|
|
| 12-Jan-07 |
142 |
|
|
|
|
|
|
|
|
|
|
|
|
|
|
|
|
|
|
| 13-Jan-07 |
115 |
|
|
|
|
|
|
|
|
|
|
|
|
|
|
|
|
|
|
| 14-Jan-07 |
113 |
|
|
|
|
|
|
|
|
|
|
|
|
|
|
|
|
|
|
| 15-Jan-07 |
121 |
|
|
|
|
|
|
|
|
|
|
|
|
|
|
|
|
|
|
| 16-Jan-07 |
116 |
|
|
|
|
|
|
|
|
|
|
|
|
|
|
|
|
|
|
| 17-Jan-07 |
126 |
|
|
|
|
|
|
|
|
|
|
|
|
|
|
|
|
|
|
| 18-Jan-07 |
124 |
|
|
|
|
|
|
|
|
|
|
|
|
|
|
|
|
|
|
| 19-Jan-07 |
124 |
|
|
|
|
|
|
|
|
|
|
|
|
|
|
|
|
|
|
| 20-Jan-07 |
123 |
|
|
|
|
|
|
|
|
|
|
|
|
|
|
|
|
|
|
| 21-Jan-07 |
132 |
|
|
|
|
|
|
|
|
|
|
|
|
|
|
|
|
|
|
| 22-Jan-07 |
138 |
|
|
|
|
|
|
|
|
|
|
|
|
|
|
|
|
|
|
| 23-Jan-07 |
136 |
|
|
|
|
|
|
|
|
|
|
|
|
|
|
|
|
|
|
| 24-Jan-07 |
84 |
|
|
|
|
|
|
|
|
|
|
|
|
|
|
|
|
|
|
| 25-Jan-07 |
67 |
|
|
|
|
|
|
|
|
|
|
|
|
|
|
|
|
|
|
| 26-Jan-07 |
16 |
|
|
|
|
|
|
|
|
|
|
|
|
|
|
|
|
|
|
| 27-Jan-07 |
4 |
|
|
|
|
|
|
|
|
|
|
|
|
|
|
|
|
|
|
| 28-Jan-07 |
40 |
|
|
|
|
|
|
|
|
|
|
|
|
|
|
|
|
|
|
| 29-Jan-07 |
57 |
|
|
|
|
|
|
|
|
|
|
|
|
|
|
|
|
|
|
| 30-Jan-07 |
113 |
|
|
|
|
|
|
|
|
|
|
|
|
|
|
|
|
|
|
| 31-Jan-07 |
115 |
|
|
|
|
|
|
|
|
|
|
|
|
|
|
|
|
|
|
| 1-Feb-07 |
111 |
|
|
|
|
|
|
|
|
|
|
|
|
|
|
|
|
|
|
| 2-Feb-07 |
124 |
|
|
|
|
|
|
|
|
|
|
|
|
|
|
|
|
|
|
| 3-Feb-07 |
126 |
|
|
|
|
|
|
|
|
|
|
|
|
|
|
|
|
|
|
| 4-Feb-07 |
120 |
|
|
|
|
|
|
|
|
|
|
|
|
|
|
|
|
|
|
| 5-Feb-07 |
121 |
|
|
|
|
|
|
|
|
|
|
|
|
|
|
|
|
|
|
| 6-Feb-07 |
121 |
|
|
|
|
|
|
|
|
|
|
|
|
|
|
|
|
|
|
| 7-Feb-07 |
117 |
|
|
|
|
|
|
|
|
|
|
|
|
|
|
|
|
|
|
| 8-Feb-07 |
123 |
|
|
|
|
|
|
|
|
|
|
|
|
|
|
|
|
|
|
| 9-Feb-07 |
125 |
|
|
|
|
|
|
|
|
|
|
|
|
|
|
|
|
|
|
| 10-Feb-07 |
118 |
|
|
|
|
|
|
|
|
|
|
|
|
|
|
|
|
|
|
| 11-Feb-07 |
108 |
|
|
|
|
|
|
|
|
|
|
|
|
|
|
|
|
|
|
| 12-Feb-07 |
103 |
|
|
|
|
|
|
|
|
|
|
|
|
|
|
|
|
|
|
| 13-Feb-07 |
99 |
|
|
|
|
|
|
|
|
|
|
|
|
|
|
|
|
|
|
| 14-Feb-07 |
91 |
|
|
|
|
|
|
|
|
|
|
|
|
|
|
|
|
|
|
| 15-Feb-07 |
114 |
|
|
|
|
|
|
|
|
|
|
|
|
|
|
|
|
|
|
| 16-Feb-07 |
116 |
|
|
|
|
|
|
|
|
|
|
|
|
|
|
|
|
|
|
| 17-Feb-07 |
119 |
|
|
|
|
|
|
|
|
|
|
|
|
|
|
|
|
|
|
| 18-Feb-07 |
131 |
|
|
|
|
|
|
|
|
|
|
|
|
|
|
|
|
|
|
| 19-Feb-07 |
123 |
|
|
|
|
|
|
|
|
|
|
|
|
|
|
|
|
|
|
| 20-Feb-07 |
126 |
|
|
|
|
|
|
|
|
|
|
|
|
|
|
|
|
|
|
| 21-Feb-07 |
120 |
|
|
|
|
|
|
|
|
|
|
|
|
|
|
|
|
|
|
| 22-Feb-07 |
120 |
|
|
|
|
|
|
|
|
|
|
|
|
|
|
|
|
|
|
| 23-Feb-07 |
127 |
|
|
|
|
|
|
|
|
|
|
|
|
|
|
|
|
|
|
| 24-Feb-07 |
109 |
|
|
|
|
|
|
|
|
|
|
|
|
|
|
|
|
|
|
| 25-Feb-07 |
117 |
|
|
|
|
|
|
|
|
|
|
|
|
|
|
|
|
|
|
| 26-Feb-07 |
119 |
|
|
|
|
|
|
|
|
|
|
|
|
|
|
|
|
|
|
| 27-Feb-07 |
123 |
|
|
|
|
|
|
|
|
|
|
|
|
|
|
|
|
|
|
| 28-Feb-07 |
135 |
|
|
|
|
|
|
|
|
|
|
|
|
|
|
|
|
|
|
| 1-Mar-07 |
129 |
|
|
|
|
|
|
|
|
|
|
|
|
|
|
|
|
|
|
| 2-Mar-07 |
132 |
|
|
|
|
|
|
|
|
|
|
|
|
|
|
|
|
|
|
| 3-Mar-07 |
151 |
|
|
|
|
|
|
|
|
|
|
|
|
|
|
|
|
|
|
| 4-Mar-07 |
150 |
|
|
|
|
|
|
|
|
|
|
|
|
|
|
|
|
|
|
| 5-Mar-07 |
196 |
|
|
|
|
|
|
|
|
|
|
|
|
|
|
|
|
|
|
| 6-Mar-07 |
205 |
|
|
|
|
|
|
|
|
|
|
|
|
|
|
|
|
|
|
| 7-Mar-07 |
200 |
|
|
|
|
|
|
|
|
|
|
|
|
|
|
|
|
|
|
| 8-Mar-07 |
209 |
|
|
|
|
|
|
|
|
|
|
|
|
|
|
|
|
|
|
| 9-Mar-07 |
187 |
|
|
|
|
|
|
|
|
|
|
|
|
|
|
|
|
|
|
| 10-Mar-07 |
179 |
|
|
|
|
|
|
|
|
|
|
|
|
|
|
|
|
|
|
| 11-Mar-07 |
166 |
|
|
|
|
|
|
|
|
|
|
|
|
|
|
|
|
|
|
| 12-Mar-07 |
167 |
|
|
|
|
|
|
|
|
|
|
|
|
|
|
|
|
|
|
| 13-Mar-07 |
164 |
|
|
|
|
|
|
|
|
|
|
|
|
|
|
|
|
|
|
| 14-Mar-07 |
169 |
|
|
|
|
|
|
|
|
|
|
|
|
|
|
|
|
|
|
| 15-Mar-07 |
174 |
|
|
|
|
|
|
|
|
|
|
|
|
|
|
|
|
|
|
| 16-Mar-07 |
172 |
|
|
|
|
|
|
|
|
|
|
|
|
|
|
|
|
|
|
| 17-Mar-07 |
171 |
|
|
|
|
|
|
|
|
|
|
|
|
|
|
|
|
|
|
| 18-Mar-07 |
178 |
|
|
|
|
|
|
|
|
|
|
|
|
|
|
|
|
|
|
| 19-Mar-07 |
180 |
|
|
|
|
|
|
|
|
|
|
|
|
|
|
|
|
|
|
| 20-Mar-07 |
186 |
|
|
|
|
|
|
|
|
|
|
|
|
|
|
|
|
|
|
| 21-Mar-07 |
197 |
|
|
|
|
|
|
|
|
|
|
|
|
|
|
|
|
|
|
| 22-Mar-07 |
193 |
|
|
|
|
|
|
|
|
|
|
|
|
|
|
|
|
|
|
| 23-Mar-07 |
195 |
|
|
|
|
|
|
|
|
|
|
|
|
|
|
|
|
|
|
| 24-Mar-07 |
200 |
|
|
|
|
|
|
|
|
|
|
|
|
|
|
|
|
|
|
| 25-Mar-07 |
193 |
|
|
|
|
|
|
|
|
|
|
|
|
|
|
|
|
|
|
| 26-Mar-07 |
191 |
|
|
|
|
|
|
|
|
|
|
|
|
|
|
|
|
|
|
| 27-Mar-07 |
190 |
|
|
|
|
|
|
|
|
|
|
|
|
|
|
|
|
|
|
| 28-Mar-07 |
177 |
|
|
|
|
|
|
|
|
|
|
|
|
|
|
|
|
|
|
| 29-Mar-07 |
179 |
|
|
|
|
|
|
|
|
|
|
|
|
|
|
|
|
|
|
| 30-Mar-07 |
206 |
|
|
|
|
|
|
|
|
|
|
|
|
|
|
|
|
|
|
| 31-Mar-07 |
192 |
|
|
|
|
|
|
|
|
|
|
|
|
|
|
|
|
|
|
| 1-Apr-07 |
198 |
|
|
|
|
|
|
|
|
|
|
|
|
|
|
|
|
|
|
| 2-Apr-07 |
197 |
|
|
|
|
|
|
|
|
|
|
|
|
|
|
|
|
|
|
| 3-Apr-07 |
179 |
|
|
|
|
|
|
|
|
|
|
|
|
|
|
|
|
|
|
| 4-Apr-07 |
195 |
|
|
|
|
|
|
|
|
|
|
|
|
|
|
|
|
|
|
| 5-Apr-07 |
194 |
|
|
|
|
|
|
|
|
|
|
|
|
|
|
|
|
|
|
| 6-Apr-07 |
199 |
|
|
|
|
|
|
|
|
|
|
|
|
|
|
|
|
|
|
| 7-Apr-07 |
195 |
|
|
|
|
|
|
|
|
|
|
|
|
|
|
|
|
|
|
| 8-Apr-07 |
198 |
|
|
|
|
|
|
|
|
|
|
|
|
|
|
|
|
|
|
| 9-Apr-07 |
202 |
|
|
|
|
|
|
|
|
|
|
|
|
|
|
|
|
|
|
| 10-Apr-07 |
202 |
|
|
|
|
|
|
|
|
|
|
|
|
|
|
|
|
|
|
| 11-Apr-07 |
191 |
|
|
|
|
|
|
|
|
|
|
|
|
|
|
|
|
|
|
| 12-Apr-07 |
210 |
|
|
|
|
|
|
|
|
|
|
|
|
|
|
|
|
|
|
| 13-Apr-07 |
208 |
|
|
|
|
|
|
|
|
|
|
|
|
|
|
|
|
|
|
| 14-Apr-07 |
215 |
|
|
|
|
|
|
|
|
|
|
|
|
|
|
|
|
|
|
| 15-Apr-07 |
224 |
|
|
|
|
|
|
|
|
|
|
|
|
|
|
|
|
|
|
| 16-Apr-07 |
223 |
|
|
|
|
|
|
|
|
|
|
|
|
|
|
|
|
|
|
| 17-Apr-07 |
237 |
|
|
|
|
|
|
|
|
|
|
|
|
|
|
|
|
|
|
| 18-Apr-07 |
233 |
|
|
|
|
|
|
|
|
|
|
|
|
|
|
|
|
|
|
| 19-Apr-07 |
231 |
|
|
|
|
|
|
|
|
|
|
|
|
|
|
|
|
|
|
| 20-Apr-07 |
215 |
|
|
|
|
|
|
|
|
|
|
|
|
|
|
|
|
|
|
| 21-Apr-07 |
213 |
|
|
|
|
|
|
|
|
|
|
|
|
|
|
|
|
|
|
| 22-Apr-07 |
206 |
|
|
|
|
|
|
|
|
|
|
|
|
|
|
|
|
|
|
| 23-Apr-07 |
220 |
|
|
|
|
|
|
|
|
|
|
|
|
|
|
|
|
|
|
| 24-Apr-07 |
236 |
|
|
|
|
|
|
|
|
|
|
|
|
|
|
|
|
|
|
| 25-Apr-07 |
238 |
|
|
|
|
|
|
|
|
|
|
|
|
|
|
|
|
|
|
| 26-Apr-07 |
248 |
|
|
|
|
|
|
|
|
|
|
|
|
|
|
|
|
|
|
| 27-Apr-07 |
251 |
|
|
|
|
|
|
|
|
|
|
|
|
|
|
|
|
|
|
| 28-Apr-07 |
266 |
|
|
|
|
|
|
|
|
|
|
|
|
|
|
|
|
|
|
| 29-Apr-07 |
268 |
|
|
|
|
|
|
|
|
|
|
|
|
|
|
|
|
|
|
| 30-Apr-07 |
265 |
|
|
|
|
|
|
|
|
|
|
|
|
|
|
|
|
|
|
| 1-May-07 |
251 |
|
|
|
|
|
|
|
|
|
|
|
|
|
|
|
|
|
|
| 2-May-07 |
250 |
|
|
|
|
|
|
|
|
|
|
|
|
|
|
|
|
|
|
| 3-May-07 |
250 |
|
|
|
|
|
|
|
|
|
|
|
|
|
|
|
|
|
|
| 4-May-07 |
242 |
|
|
|
|
|
|
|
|
|
|
|
|
|
|
|
|
|
|
| 5-May-07 |
214 |
|
|
|
|
|
|
|
|
|
|
|
|
|
|
|
|
|
|
| 6-May-07 |
222 |
|
|
|
|
|
|
|
|
|
|
|
|
|
|
|
|
|
|
| 7-May-07 |
212 |
|
|
|
|
|
|
|
|
|
|
|
|
|
|
|
|
|
|
| 8-May-07 |
218 |
|
|
|
|
|
|
|
|
|
|
|
|
|
|
|
|
|
|
| 9-May-07 |
234 |
|
|
|
|
|
|
|
|
|
|
|
|
|
|
|
|
|
|
| 10-May-07 |
229 |
|
|
|
|
|
|
|
|
|
|
|
|
|
|
|
|
|
|
| 11-May-07 |
245 |
|
|
|
|
|
|
|
|
|
|
|
|
|
|
|
|
|
|
| 12-May-07 |
232 |
|
|
|
|
|
|
|
|
|
|
|
|
|
|
|
|
|
|
| 13-May-07 |
202 |
|
|
|
|
|
|
|
|
|
|
|
|
|
|
|
|
|
|
| 14-May-07 |
195 |
|
|
|
|
|
|
|
|
|
|
|
|
|
|
|
|
|
|
| 15-May-07 |
193 |
|
|
|
|
|
|
|
|
|
|
|
|
|
|
|
|
|
|
| 16-May-07 |
209 |
|
|
|
|
|
|
|
|
|
|
|
|
|
|
|
|
|
|
| 17-May-07 |
229 |
|
|
|
|
|
|
|
|
|
|
|
|
|
|
|
|
|
|
| 18-May-07 |
224 |
|
|
|
|
|
|
|
|
|
|
|
|
|
|
|
|
|
|
| 19-May-07 |
221 |
|
|
|
|
|
|
|
|
|
|
|
|
|
|
|
|
|
|
| 20-May-07 |
226 |
|
|
|
|
|
|
|
|
|
|
|
|
|
|
|
|
|
|
| 21-May-07 |
230 |
|
|
|
|
|
|
|
|
|
|
|
|
|
|
|
|
|
|
| 22-May-07 |
236 |
|
|
|
|
|
|
|
|
|
|
|
|
|
|
|
|
|
|
| 23-May-07 |
217 |
|
|
|
|
|
|
|
|
|
|
|
|
|
|
|
|
|
|
| 24-May-07 |
198 |
|
|
|
|
|
|
|
|
|
|
|
|
|
|
|
|
|
|
| 25-May-07 |
201 |
|
|
|
|
|
|
|
|
|
|
|
|
|
|
|
|
|
|
| 26-May-07 |
210 |
|
|
|
|
|
|
|
|
|
|
|
|
|
|
|
|
|
|
| 27-May-07 |
222 |
|
|
|
|
|
|
|
|
|
|
|
|
|
|
|
|
|
|
| 28-May-07 |
207 |
|
|
|
|
|
|
|
|
|
|
|
|
|
|
|
|
|
|
| 29-May-07 |
213 |
|
|
|
|
|
|
|
|
|
|
|
|
|
|
|
|
|
|
| 30-May-07 |
211 |
|
|
|
|
|
|
|
|
|
|
|
|
|
|
|
|
|
|
| 31-May-07 |
221 |
|
|
|
|
|
|
|
|
|
|
|
|
|
|
|
|
|
|
| 1-Jun-07 |
233 |
|
|
|
|
|
|
|
|
|
|
|
|
|
|
|
|
|
|
| 2-Jun-07 |
223 |
|
|
|
|
|
|
|
|
|
|
|
|
|
|
|
|
|
|
| 3-Jun-07 |
226 |
|
|
|
|
|
|
|
|
|
|
|
|
|
|
|
|
|
|
| 4-Jun-07 |
217 |
|
|
|
|
|
|
|
|
|
|
|
|
|
|
|
|
|
|
| 5-Jun-07 |
225 |
|
|
|
|
|
|
|
|
|
|
|
|
|
|
|
|
|
|
| 6-Jun-07 |
234 |
|
|
|
|
|
|
|
|
|
|
|
|
|
|
|
|
|
|
| 7-Jun-07 |
209 |
|
|
|
|
|
|
|
|
|
|
|
|
|
|
|
|
|
|
| 8-Jun-07 |
222 |
|
|
|
|
|
|
|
|
|
|
|
|
|
|
|
|
|
|
| 9-Jun-07 |
214 |
|
|
|
|
|
|
|
|
|
|
|
|
|
|
|
|
|
|
| 10-Jun-07 |
219 |
|
|
|
|
|
|
|
|
|
|
|
|
|
|
|
|
|
|
| 11-Jun-07 |
232 |
|
|
|
|
|
|
|
|
|
|
|
|
|
|
|
|
|
|
| 12-Jun-07 |
233 |
|
|
|
|
|
|
|
|
|
|
|
|
|
|
|
|
|
|
| 13-Jun-07 |
233 |
|
|
|
|
|
|
|
|
|
|
|
|
|
|
|
|
|
|
| 14-Jun-07 |
232 |
|
|
|
|
|
|
|
|
|
|
|
|
|
|
|
|
|
|
| 15-Jun-07 |
239 |
|
|
|
|
|
|
|
|
|
|
|
|
|
|
|
|
|
|
| 16-Jun-07 |
237 |
|
|
|
|
|
|
|
|
|
|
|
|
|
|
|
|
|
|
| 17-Jun-07 |
251 |
|
|
|
|
|
|
|
|
|
|
|
|
|
|
|
|
|
|
| 18-Jun-07 |
268 |
|
|
|
|
|
|
|
|
|
|
|
|
|
|
|
|
|
|
| 19-Jun-07 |
291 |
|
|
|
|
|
|
|
|
|
|
|
|
|
|
|
|
|
|
| 20-Jun-07 |
302 |
|
|
|
|
|
|
|
|
|
|
|
|
|
|
|
|
|
|
| 21-Jun-07 |
275 |
|
|
|
|
|
|
|
|
|
|
|
|
|
|
|
|
|
|
| 22-Jun-07 |
250 |
|
|
|
|
|
|
|
|
|
|
|
|
|
|
|
|
|
|
| 23-Jun-07 |
223 |
|
|
|
|
|
|
|
|
|
|
|
|
|
|
|
|
|
|
| 24-Jun-07 |
224 |
|
|
|
|
|
|
|
|
|
|
|
|
|
|
|
|
|
|
| 25-Jun-07 |
234 |
|
|
|
|
|
|
|
|
|
|
|
|
|
|
|
|
|
|
| 26-Jun-07 |
231 |
|
|
|
|
|
|
|
|
|
|
|
|
|
|
|
|
|
|
| 27-Jun-07 |
227 |
|
|
|
|
|
|
|
|
|
|
|
|
|
|
|
|
|
|
| 28-Jun-07 |
231 |
|
|
|
|
|
|
|
|
|
|
|
|
|
|
|
|
|
|
| 29-Jun-07 |
226 |
|
|
|
|
|
|
|
|
|
|
|
|
|
|
|
|
|
|
| 30-Jun-07 |
211 |
|
|
|
|
|
|
|
|
|
|
|
|
|
|
|
|
|
|
| 1-Jul-07 |
221 |
|
|
|
|
|
|
|
|
|
|
|
|
|
|
|
|
|
|
| 2-Jul-07 |
225 |
|
|
|
|
|
|
|
|
|
|
|
|
|
|
|
|
|
|
| 3-Jul-07 |
199 |
|
|
|
|
|
|
|
|
|
|
|
|
|
|
|
|
|
|
| 4-Jul-07 |
206 |
|
|
|
|
|
|
|
|
|
|
|
|
|
|
|
|
|
|
| 5-Jul-07 |
192 |
|
|
|
|
|
|
|
|
|
|
|
|
|
|
|
|
|
|
| 6-Jul-07 |
171 |
|
|
|
|
|
|
|
|
|
|
|
|
|
|
|
|
|
|
| 7-Jul-07 |
225 |
|
|
|
|
|
|
|
|
|
|
|
|
|
|
|
|
|
|
| 8-Jul-07 |
252 |
|
|
|
|
|
|
|
|
|
|
|
|
|
|
|
|
|
|
| 9-Jul-07 |
267 |
|
|
|
|
|
|
|
|
|
|
|
|
|
|
|
|
|
|
| 10-Jul-07 |
255 |
|
|
|
|
|
|
|
|
|
|
|
|
|
|
|
|
|
|
| 11-Jul-07 |
235 |
|
|
|
|
|
|
|
|
|
|
|
|
|
|
|
|
|
|
| 12-Jul-07 |
228 |
|
|
|
|
|
|
|
|
|
|
|
|
|
|
|
|
|
|
| 13-Jul-07 |
245 |
|
|
|
|
|
|
|
|
|
|
|
|
|
|
|
|
|
|
| 14-Jul-07 |
225 |
|
|
|
|
|
|
|
|
|
|
|
|
|
|
|
|
|
|
| 15-Jul-07 |
205 |
|
|
|
|
|
|
|
|
|
|
|
|
|
|
|
|
|
|
| 16-Jul-07 |
180 |
|
|
|
|
|
|
|
|
|
|
|
|
|
|
|
|
|
|
| 17-Jul-07 |
185 |
|
|
|
|
|
|
|
|
|
|
|
|
|
|
|
|
|
|
| 18-Jul-07 |
191 |
|
|
|
|
|
|
|
|
|
|
|
|
|
|
|
|
|
|
| 19-Jul-07 |
193 |
|
|
|
|
|
|
|
|
|
|
|
|
|
|
|
|
|
|
| 20-Jul-07 |
198 |
|
|
|
|
|
|
|
|
|
|
|
|
|
|
|
|
|
|
| 21-Jul-07 |
202 |
|
|
|
|
|
|
|
|
|
|
|
|
|
|
|
|
|
|
| 22-Jul-07 |
194 |
|
|
|
|
|
|
|
|
|
|
|
|
|
|
|
|
|
|
| 23-Jul-07 |
195 |
|
|
|
|
|
|
|
|
|
|
|
|
|
|
|
|
|
|
| 24-Jul-07 |
164 |
|
|
|
|
|
|
|
|
|
|
|
|
|
|
|
|
|
|
| 25-Jul-07 |
174 |
|
|
|
|
|
|
|
|
|
|
|
|
|
|
|
|
|
|
| 26-Jul-07 |
176 |
|
|
|
|
|
|
|
|
|
|
|
|
|
|
|
|
|
|
| 27-Jul-07 |
186 |
|
|
|
|
|
|
|
|
|
|
|
|
|
|
|
|
|
|
| 28-Jul-07 |
189 |
|
|
|
|
|
|
|
|
|
|
|
|
|
|
|
|
|
|
| 29-Jul-07 |
193 |
|
|
|
|
|
|
|
|
|
|
|
|
|
|
|
|
|
|
| 30-Jul-07 |
191 |
|
|
|
|
|
|
|
|
|
|
|
|
|
|
|
|
|
|
| 31-Jul-07 |
175 |
|
|
|
|
|
|
|
|
|
|
|
|
|
|
|
|
|
|
| 1-Aug-07 |
182 |
|
|
|
|
|
|
|
|
|
|
|
|
|
|
|
|
|
|
| 2-Aug-07 |
162 |
|
|
|
|
|
|
|
|
|
|
|
|
|
|
|
|
|
|
| 3-Aug-07 |
169 |
|
|
|
|
|
|
|
|
|
|
|
|
|
|
|
|
|
|
| 4-Aug-07 |
177 |
|
|
|
|
|
|
|
|
|
|
|
|
|
|
|
|
|
|
| 5-Aug-07 |
183 |
|
|
|
|
|
|
|
|
|
|
|
|
|
|
|
|
|
|
| 6-Aug-07 |
200 |
|
|
|
|
|
|
|
|
|
|
|
|
|
|
|
|
|
|
| 7-Aug-07 |
201 |
|
|
|
|
|
|
|
|
|
|
|
|
|
|
|
|
|
|
| 8-Aug-07 |
185 |
|
|
|
|
|
|
|
|
|
|
|
|
|
|
|
|
|
|
| 9-Aug-07 |
190 |
|
|
|
|
|
|
|
|
|
|
|
|
|
|
|
|
|
|
| 10-Aug-07 |
169 |
|
|
|
|
|
|
|
|
|
|
|
|
|
|
|
|
|
|
| 11-Aug-07 |
164 |
|
|
|
|
|
|
|
|
|
|
|
|
|
|
|
|
|
|
| 12-Aug-07 |
178 |
|
|
|
|
|
|
|
|
|
|
|
|
|
|
|
|
|
|
| 13-Aug-07 |
170 |
|
|
|
|
|
|
|
|
|
|
|
|
|
|
|
|
|
|
| 14-Aug-07 |
181 |
|
|
|
|
|
|
|
|
|
|
|
|
|
|
|
|
|
|
| 15-Aug-07 |
173 |
|
|
|
|
|
|
|
|
|
|
|
|
|
|
|
|
|
|
| 16-Aug-07 |
156 |
|
|
|
|
|
|
|
|
|
|
|
|
|
|
|
|
|
|
| 17-Aug-07 |
160 |
|
|
|
|
|
|
|
|
|
|
|
|
|
|
|
|
|
|
| 18-Aug-07 |
156 |
|
|
|
|
|
|
|
|
|
|
|
|
|
|
|
|
|
|
| 19-Aug-07 |
174 |
|
|
|
|
|
|
|
|
|
|
|
|
|
|
|
|
|
|
| 20-Aug-07 |
171 |
|
|
|
|
|
|
|
|
|
|
|
|
|
|
|
|
|
|
| 21-Aug-07 |
168 |
|
|
|
|
|
|
|
|
|
|
|
|
|
|
|
|
|
|
| 22-Aug-07 |
158 |
|
|
|
|
|
|
|
|
|
|
|
|
|
|
|
|
|
|
| 23-Aug-07 |
147 |
|
|
|
|
|
|
|
|
|
|
|
|
|
|
|
|
|
|
| 24-Aug-07 |
156 |
|
|
|
|
|
|
|
|
|
|
|
|
|
|
|
|
|
|
| 25-Aug-07 |
139 |
|
|
|
|
|
|
|
|
|
|
|
|
|
|
|
|
|
|
| 26-Aug-07 |
163 |
|
|
|
|
|
|
|
|
|
|
|
|
|
|
|
|
|
|
| 27-Aug-07 |
154 |
|
|
|
|
|
|
|
|
|
|
|
|
|
|
|
|
|
|
| 28-Aug-07 |
156 |
|
|
|
|
|
|
|
|
|
|
|
|
|
|
|
|
|
|
| 29-Aug-07 |
159 |
|
|
|
|
|
|
|
|
|
|
|
|
|
|
|
|
|
|
| 30-Aug-07 |
143 |
|
|
|
|
|
|
|
|
|
|
|
|
|
|
|
|
|
|
| 31-Aug-07 |
161 |
|
|
|
|
|
|
|
|
|
|
|
|
|
|
|
|
|
|
| 1-Sep-07 |
146 |
|
|
|
|
|
|
|
|
|
|
|
|
|
|
|
|
|
|
| 2-Sep-07 |
156 |
|
|
|
|
|
|
|
|
|
|
|
|
|
|
|
|
|
|
| 3-Sep-07 |
158 |
|
|
|
|
|
|
|
|
|
|
|
|
|
|
|
|
|
|
| 4-Sep-07 |
133 |
|
|
|
|
|
|
|
|
|
|
|
|
|
|
|
|
|
|
| 5-Sep-07 |
139 |
|
|
|
|
|
|
|
|
|
|
|
|
|
|
|
|
|
|
| 6-Sep-07 |
121 |
|
|
|
|
|
|
|
|
|
|
|
|
|
|
|
|
|
|
| 7-Sep-07 |
133 |
|
|
|
|
|
|
|
|
|
|
|
|
|
|
|
|
|
|
| 8-Sep-07 |
146 |
|
|
|
|
|
|
|
|
|
|
|
|
|
|
|
|
|
|
| 9-Sep-07 |
158 |
|
|
|
|
|
|
|
|
|
|
|
|
|
|
|
|
|
|
| 10-Sep-07 |
180 |
|
|
|
|
|
|
|
|
|
|
|
|
|
|
|
|
|
|
| 11-Sep-07 |
164 |
|
|
|
|
|
|
|
|
|
|
|
|
|
|
|
|
|
|
| 12-Sep-07 |
166 |
|
|
|
|
|
|
|
|
|
|
|
|
|
|
|
|
|
|
| 13-Sep-07 |
152 |
|
|
|
|
|
|
|
|
|
|
|
|
|
|
|
|
|
|
| 14-Sep-07 |
147 |
|
|
|
|
|
|
|
|
|
|
|
|
|
|
|
|
|
|
| 15-Sep-07 |
147 |
|
|
|
|
|
|
|
|
|
|
|
|
|
|
|
|
|
|
| 16-Sep-07 |
150 |
|
|
|
|
|
|
|
|
|
|
|
|
|
|
|
|
|
|
| 17-Sep-07 |
162 |
|
|
|
|
|
|
|
|
|
|
|
|
|
|
|
|
|
|
| 18-Sep-07 |
154 |
|
|
|
|
|
|
|
|
|
|
|
|
|
|
|
|
|
|
| 19-Sep-07 |
156 |
|
|
|
|
|
|
|
|
|
|
|
|
|
|
|
|
|
|
| 20-Sep-07 |
146 |
|
|
|
|
|
|
|
|
|
|
|
|
|
|
|
|
|
|
| 21-Sep-07 |
152 |
|
|
|
|
|
|
|
|
|
|
|
|
|
|
|
|
|
|
| 22-Sep-07 |
168 |
|
|
|
|
|
|
|
|
|
|
|
|
|
|
|
|
|
|
| 23-Sep-07 |
158 |
|
|
|
|
|
|
|
|
|
|
|
|
|
|
|
|
|
|
| 24-Sep-07 |
164 |
|
|
|
|
|
|
|
|
|
|
|
|
|
|
|
|
|
|
| 25-Sep-07 |
146 |
|
|
|
|
|
|
|
|
|
|
|
|
|
|
|
|
|
|
| 26-Sep-07 |
130 |
|
|
|
|
|
|
|
|
|
|
|
|
|
|
|
|
|
|
| 27-Sep-07 |
124 |
|
|
|
|
|
|
|
|
|
|
|
|
|
|
|
|
|
|
| 28-Sep-07 |
122 |
|
|
|
|
|
|
|
|
|
|
|
|
|
|
|
|
|
|
| 29-Sep-07 |
122 |
|
|
|
|
|
|
|
|
|
|
|
|
|
|
|
|
|
|
| 30-Sep-07 |
133 |
|
|
|
|
|
|
|
|
|
|
|
|
|
|
|
|
|
|
| 1-Oct-07 |
140 |
|
|
|
|
|
|
|
|
|
|
|
|
|
|
|
|
|
|
| 2-Oct-07 |
135 |
|
|
|
|
|
|
|
|
|
|
|
|
|
|
|
|
|
|
| 3-Oct-07 |
123 |
|
|
|
|
|
|
|
|
|
|
|
|
|
|
|
|
|
|
| 4-Oct-07 |
108 |
|
|
|
|
|
|
|
|
|
|
|
|
|
|
|
|
|
|
| 5-Oct-07 |
109 |
|
|
|
|
|
|
|
|
|
|
|
|
|
|
|
|
|
|
| 6-Oct-07 |
113 |
|
|
|
|
|
|
|
|
|
|
|
|
|
|
|
|
|
|
| 7-Oct-07 |
141 |
|
|
|
|
|
|
|
|
|
|
|
|
|
|
|
|
|
|
| 8-Oct-07 |
150 |
|
|
|
|
|
|
|
|
|
|
|
|
|
|
|
|
|
|
| 9-Oct-07 |
154 |
|
|
|
|
|
|
|
|
|
|
|
|
|
|
|
|
|
|
| 10-Oct-07 |
168 |
|
|
|
|
|
|
|
|
|
|
|
|
|
|
|
|
|
|
| 11-Oct-07 |
140 |
|
|
|
|
|
|
|
|
|
|
|
|
|
|
|
|
|
|
| 12-Oct-07 |
126 |
|
|
|
|
|
|
|
|
|
|
|
|
|
|
|
|
|
|
| 13-Oct-07 |
113 |
|
|
|
|
|
|
|
|
|
|
|
|
|
|
|
|
|
|
| 14-Oct-07 |
116 |
|
|
|
|
|
|
|
|
|
|
|
|
|
|
|
|
|
|
| 15-Oct-07 |
129 |
|
|
|
|
|
|
|
|
|
|
|
|
|
|
|
|
|
|
| 16-Oct-07 |
137 |
|
|
|
|
|
|
|
|
|
|
|
|
|
|
|
|
|
|
| 17-Oct-07 |
135 |
|
|
|
|
|
|
|
|
|
|
|
|
|
|
|
|
|
|
| 18-Oct-07 |
131 |
|
|
|
|
|
|
|
|
|
|
|
|
|
|
|
|
|
|
| 19-Oct-07 |
120 |
|
|
|
|
|
|
|
|
|
|
|
|
|
|
|
|
|
|
| 20-Oct-07 |
116 |
|
|
|
|
|
|
|
|
|
|
|
|
|
|
|
|
|
|
| 21-Oct-07 |
124 |
|
|
|
|
|
|
|
|
|
|
|
|
|
|
|
|
|
|
| 22-Oct-07 |
127 |
|
|
|
|
|
|
|
|
|
|
|
|
|
|
|
|
|
|
| 23-Oct-07 |
119 |
|
|
|
|
|
|
|
|
|
|
|
|
|
|
|
|
|
|
| 24-Oct-07 |
117 |
|
|
|
|
|
|
|
|
|
|
|
|
|
|
|
|
|
|
| 25-Oct-07 |
120 |
|
|
|
|
|
|
|
|
|
|
|
|
|
|
|
|
|
|
| 26-Oct-07 |
117 |
|
|
|
|
|
|
|
|
|
|
|
|
|
|
|
|
|
|
| 27-Oct-07 |
111 |
|
|
|
|
|
|
|
|
|
|
|
|
|
|
|
|
|
|
| 28-Oct-07 |
107 |
|
|
|
|
|
|
|
|
|
|
|
|
|
|
|
|
|
|
| 29-Oct-07 |
98 |
|
|
|
|
|
|
|
|
|
|
|
|
|
|
|
|
|
|
| 30-Oct-07 |
82 |
|
|
|
|
|
|
|
|
|
|
|
|
|
|
|
|
|
|
| 31-Oct-07 |
88 |
|
|
|
|
|
|
|
|
|
|
|
|
|
|
|
|
|
|
| 1-Nov-07 |
91 |
|
|
|
|
|
|
|
|
|
|
|
|
|
|
|
|
|
|
| 2-Nov-07 |
126 |
|
|
|
|
|
|
|
|
|
|
|
|
|
|
|
|
|
|
| 3-Nov-07 |
127 |
|
|
|
|
|
|
|
|
|
|
|
|
|
|
|
|
|
|
| 4-Nov-07 |
110 |
|
|
|
|
|
|
|
|
|
|
|
|
|
|
|
|
|
|
| 5-Nov-07 |
103 |
|
|
|
|
|
|
|
|
|
|
|
|
|
|
|
|
|
|
| 6-Nov-07 |
95 |
|
|
|
|
|
|
|
|
|
|
|
|
|
|
|
|
|
|
| 7-Nov-07 |
96 |
|
|
|
|
|
|
|
|
|
|
|
|
|
|
|
|
|
|
| 8-Nov-07 |
95 |
|
|
|
|
|
|
|
|
|
|
|
|
|
|
|
|
|
|
| 9-Nov-07 |
94 |
|
|
|
|
|
|
|
|
|
|
|
|
|
|
|
|
|
|
| 10-Nov-07 |
93 |
|
|
|
|
|
|
|
|
|
|
|
|
|
|
|
|
|
|
| 11-Nov-07 |
93 |
|
|
|
|
|
|
|
|
|
|
|
|
|
|
|
|
|
|
| 12-Nov-07 |
109 |
|
|
|
|
|
|
|
|
|
|
|
|
|
|
|
|
|
|
| 13-Nov-07 |
107 |
|
|
|
|
|
|
|
|
|
|
|
|
|
|
|
|
|
|
| 14-Nov-07 |
92 |
|
|
|
|
|
|
|
|
|
|
|
|
|
|
|
|
|
|
| 15-Nov-07 |
94 |
|
|
|
|
|
|
|
|
|
|
|
|
|
|
|
|
|
|
| 16-Nov-07 |
87 |
|
|
|
|
|
|
|
|
|
|
|
|
|
|
|
|
|
|
| 17-Nov-07 |
86 |
|
|
|
|
|
|
|
|
|
|
|
|
|
|
|
|
|
|
| 18-Nov-07 |
91 |
|
|
|
|
|
|
|
|
|
|
|
|
|
|
|
|
|
|
| 19-Nov-07 |
69 |
|
|
|
|
|
|
|
|
|
|
|
|
|
|
|
|
|
|
| 20-Nov-07 |
57 |
|
|
|
|
|
|
|
|
|
|
|
|
|
|
|
|
|
|
| 21-Nov-07 |
55 |
|
|
|
|
|
|
|
|
|
|
|
|
|
|
|
|
|
|
| 22-Nov-07 |
91 |
|
|
|
|
|
|
|
|
|
|
|
|
|
|
|
|
|
|
| 23-Nov-07 |
103 |
|
|
|
|
|
|
|
|
|
|
|
|
|
|
|
|
|
|
| 24-Nov-07 |
108 |
|
|
|
|
|
|
|
|
|
|
|
|
|
|
|
|
|
|
| 25-Nov-07 |
95 |
|
|
|
|
|
|
|
|
|
|
|
|
|
|
|
|
|
|
| 26-Nov-07 |
111 |
|
|
|
|
|
|
|
|
|
|
|
|
|
|
|
|
|
|
| 27-Nov-07 |
119 |
|
|
|
|
|
|
|
|
|
|
|
|
|
|
|
|
|
|
| 28-Nov-07 |
132 |
|
|
|
|
|
|
|
|
|
|
|
|
|
|
|
|
|
|
| 29-Nov-07 |
157 |
|
|
|
|
|
|
|
|
|
|
|
|
|
|
|
|
|
|
| 30-Nov-07 |
128 |
|
|
|
|
|
|
|
|
|
|
|
|
|
|
|
|
|
|
| 1-Dec-07 |
107 |
|
|
|
|
|
|
|
|
|
|
|
|
|
|
|
|
|
|
| 2-Dec-07 |
107 |
|
|
|
|
|
|
|
|
|
|
|
|
|
|
|
|
|
|
| 3-Dec-07 |
107 |
|
|
|
|
|
|
|
|
|
|
|
|
|
|
|
|
|
|
| 4-Dec-07 |
87 |
|
|
|
|
|
|
|
|
|
|
|
|
|
|
|
|
|
|
| 5-Dec-07 |
|
|
|
|
|
|
|
|
|
|
|
|
|
|
|
|
|
|
|
| 6-Dec-07 |
37 |
|
|
|
|
|
|
|
|
|
|
|
|
|
|
|
|
|
|
| 7-Dec-07 |
15 |
|
|
|
|
|
|
|
|
|
|
|
|
|
|
|
|
|
|
| 8-Dec-07 |
15 |
|
|
|
|
|
|
|
|
|
|
|
|
|
|
|
|
|
|
| 9-Dec-07 |
27 |
|
|
|
|
|
|
|
|
|
|
|
|
|
|
|
|
|
|
| 10-Dec-07 |
22 |
|
|
|
|
|
|
|
|
|
|
|
|
|
|
|
|
|
|
| 11-Dec-07 |
71 |
|
|
|
|
|
|
|
|
|
|
|
|
|
|
|
|
|
|
| 12-Dec-07 |
94 |
|
|
|
|
|
|
|
|
|
|
|
|
|
|
|
|
|
|
| 13-Dec-07 |
115 |
|
|
|
|
|
|
|
|
|
|
|
|
|
|
|
|
|
|
| 14-Dec-07 |
112 |
|
|
|
|
|
|
|
|
|
|
|
|
|
|
|
|
|
|
| 15-Dec-07 |
112 |
|
|
|
|
|
|
|
|
|
|
|
|
|
|
|
|
|
|
| 16-Dec-07 |
92 |
|
|
|
|
|
|
|
|
|
|
|
|
|
|
|
|
|
|
| 17-Dec-07 |
88 |
|
|
|
|
|
|
|
|
|
|
|
|
|
|
|
|
|
|
| 18-Dec-07 |
83 |
|
|
|
|
|
|
|
|
|
|
|
|
|
|
|
|
|
|
| 19-Dec-07 |
84 |
|
|
|
|
|
|
|
|
|
|
|
|
|
|
|
|
|
|
| 20-Dec-07 |
84 |
|
|
|
|
|
|
|
|
|
|
|
|
|
|
|
|
|
|
| 21-Dec-07 |
82 |
|
|
|
|
|
|
|
|
|
|
|
|
|
|
|
|
|
|
| 22-Dec-07 |
82 |
|
|
|
|
|
|
|
|
|
|
|
|
|
|
|
|
|
|
| 23-Dec-07 |
69 |
|
|
|
|
|
|
|
|
|
|
|
|
|
|
|
|
|
|
| 24-Dec-07 |
86 |
|
|
|
|
|
|
|
|
|
|
|
|
|
|
|
|
|
|
| 25-Dec-07 |
86 |
|
|
|
|
|
|
|
|
|
|
|
|
|
|
|
|
|
|
| 26-Dec-07 |
89 |
|
|
|
|
|
|
|
|
|
|
|
|
|
|
|
|
|
|
| 27-Dec-07 |
86 |
|
|
|
|
|
|
|
|
|
|
|
|
|
|
|
|
|
|
| 28-Dec-07 |
82 |
|
|
|
|
|
|
|
|
|
|
|
|
|
|
|
|
|
|
| 29-Dec-07 |
84 |
|
|
|
|
|
|
|
|
|
|
|
|
|
|
|
|
|
|
| 30-Dec-07 |
63 |
|
|
|
|
|
|
|
|
|
|
|
|
|
|
|
|
|
|
| 31-Dec-07 |
64 |
|
|
|
|
|
|
|
|
|
|
|
|
|
|
|
|
|
|
| 1-Jan-08 |
53 |
|
|
|
|
|
|
|
|
|
|
|
|
|
|
|
|
|
|
| 2-Jan-08 |
67 |
|
|
|
|
|
|
|
|
|
|
|
|
|
|
|
|
|
|
| 3-Jan-08 |
69 |
|
|
|
|
|
|
|
|
|
|
|
|
|
|
|
|
|
|
| 4-Jan-08 |
61 |
|
|
|
|
|
|
|
|
|
|
|
|
|
|
|
|
|
|
| 5-Jan-08 |
77 |
|
|
|
|
|
|
|
|
|
|
|
|
|
|
|
|
|
|
| 6-Jan-08 |
64 |
|
|
|
|
|
|
|
|
|
|
|
|
|
|
|
|
|
|
| 7-Jan-08 |
74 |
|
|
|
|
|
|
|
|
|
|
|
|
|
|
|
|
|
|
| 8-Jan-08 |
103 |
|
|
|
|
|
|
|
|
|
|
|
|
|
|
|
|
|
|
| 9-Jan-08 |
88 |
|
|
|
|
|
|
|
|
|
|
|
|
|
|
|
|
|
|
| 10-Jan-08 |
105 |
|
|
|
|
|
|
|
|
|
|
|
|
|
|
|
|
|
|
| 11-Jan-08 |
91 |
|
|
|
|
|
|
|
|
|
|
|
|
|
|
|
|
|
|
| 12-Jan-08 |
73 |
|
|
|
|
|
|
|
|
|
|
|
|
|
|
|
|
|
|
| 13-Jan-08 |
79 |
|
|
|
|
|
|
|
|
|
|
|
|
|
|
|
|
|
|
| 14-Jan-08 |
61 |
|
|
|
|
|
|
|
|
|
|
|
|
|
|
|
|
|
|
| 15-Jan-08 |
44 |
|
|
|
|
|
|
|
|
|
|
|
|
|
|
|
|
|
|
| 16-Jan-08 |
51 |
|
|
|
|
|
|
|
|
|
|
|
|
|
|
|
|
|
|
| 17-Jan-08 |
42 |
|
|
|
|
|
|
|
|
|
|
|
|
|
|
|
|
|
|
| 18-Jan-08 |
35 |
|
|
|
|
|
|
|
|
|
|
|
|
|
|
|
|
|
|
| 19-Jan-08 |
34 |
|
|
|
|
|
|
|
|
|
|
|
|
|
|
|
|
|
|
| 20-Jan-08 |
23 |
|
|
|
|
|
|
|
|
|
|
|
|
|
|
|
|
|
|
| 21-Jan-08 |
10 |
|
|
|
|
|
|
|
|
|
|
|
|
|
|
|
|
|
|
| 22-Jan-08 |
4 |
|
|
|
|
|
|
|
|
|
|
|
|
|
|
|
|
|
|
| 23-Jan-08 |
20 |
|
|
|
|
|
|
|
|
|
|
|
|
|
|
|
|
|
|
| 24-Jan-08 |
45 |
|
|
|
|
|
|
|
|
|
|
|
|
|
|
|
|
|
|
| 25-Jan-08 |
48 |
|
|
|
|
|
|
|
|
|
|
|
|
|
|
|
|
|
|
| 26-Jan-08 |
71 |
|
|
|
|
|
|
|
|
|
|
|
|
|
|
|
|
|
|
| 27-Jan-08 |
72 |
|
|
|
|
|
|
|
|
|
|
|
|
|
|
|
|
|
|
| 28-Jan-08 |
67 |
|
|
|
|
|
|
|
|
|
|
|
|
|
|
|
|
|
|
| 29-Jan-08 |
65 |
|
|
|
|
|
|
|
|
|
|
|
|
|
|
|
|
|
|
| 30-Jan-08 |
59 |
|
|
|
|
|
|
|
|
|
|
|
|
|
|
|
|
|
|
| 31-Jan-08 |
70 |
|
|
|
|
|
|
|
|
|
|
|
|
|
|
|
|
|
|
| 1-Feb-08 |
65 |
|
|
|
|
|
|
|
|
|
|
|
|
|
|
|
|
|
|
| 2-Feb-08 |
72 |
|
|
|
|
|
|
|
|
|
|
|
|
|
|
|
|
|
|
| 3-Feb-08 |
81 |
|
|
|
|
|
|
|
|
|
|
|
|
|
|
|
|
|
|
| 4-Feb-08 |
81 |
|
|
|
|
|
|
|
|
|
|
|
|
|
|
|
|
|
|
| 5-Feb-08 |
82 |
|
|
|
|
|
|
|
|
|
|
|
|
|
|
|
|
|
|
| 6-Feb-08 |
104 |
|
|
|
|
|
|
|
|
|
|
|
|
|
|
|
|
|
|
| 7-Feb-08 |
93 |
|
|
|
|
|
|
|
|
|
|
|
|
|
|
|
|
|
|
| 8-Feb-08 |
96 |
|
|
|
|
|
|
|
|
|
|
|
|
|
|
|
|
|
|
| 9-Feb-08 |
107 |
|
|
|
|
|
|
|
|
|
|
|
|
|
|
|
|
|
|
| 10-Feb-08 |
104 |
|
|
|
|
|
|
|
|
|
|
|
|
|
|
|
|
|
|
| 11-Feb-08 |
111 |
|
|
|
|
|
|
|
|
|
|
|
|
|
|
|
|
|
|
| 12-Feb-08 |
113 |
|
|
|
|
|
|
|
|
|
|
|
|
|
|
|
|
|
|
| 13-Feb-08 |
117 |
|
|
|
|
|
|
|
|
|
|
|
|
|
|
|
|
|
|
| 14-Feb-08 |
107 |
|
|
|
|
|
|
|
|
|
|
|
|
|
|
|
|
|
|
| 15-Feb-08 |
111 |
|
|
|
|
|
|
|
|
|
|
|
|
|
|
|
|
|
|
| 16-Feb-08 |
119 |
|
|
|
|
|
|
|
|
|
|
|
|
|
|
|
|
|
|
| 17-Feb-08 |
113 |
|
|
|
|
|
|
|
|
|
|
|
|
|
|
|
|
|
|
| 18-Feb-08 |
112 |
|
|
|
|
|
|
|
|
|
|
|
|
|
|
|
|
|
|
| 19-Feb-08 |
115 |
|
|
|
|
|
|
|
|
|
|
|
|
|
|
|
|
|
|
| 20-Feb-08 |
111 |
|
|
|
|
|
|
|
|
|
|
|
|
|
|
|
|
|
|
| 21-Feb-08 |
115 |
|
|
|
|
|
|
|
|
|
|
|
|
|
|
|
|
|
|
| 22-Feb-08 |
124 |
|
|
|
|
|
|
|
|
|
|
|
|
|
|
|
|
|
|
| 23-Feb-08 |
124 |
|
|
|
|
|
|
|
|
|
|
|
|
|
|
|
|
|
|
| 24-Feb-08 |
118 |
|
|
|
|
|
|
|
|
|
|
|
|
|
|
|
|
|
|
| 25-Feb-08 |
117 |
|
|
|
|
|
|
|
|
|
|
|
|
|
|
|
|
|
|
| 26-Feb-08 |
114 |
|
|
|
|
|
|
|
|
|
|
|
|
|
|
|
|
|
|
| 27-Feb-08 |
113 |
|
|
|
|
|
|
|
|
|
|
|
|
|
|
|
|
|
|
| 28-Feb-08 |
108 |
|
|
|
|
|
|
|
|
|
|
|
|
|
|
|
|
|
|
| 29-Feb-08 |
109 |
|
|
|
|
|
|
|
|
|
|
|
|
|
|
|
|
|
|
| 1-Mar-08 |
103 |
|
|
|
|
|
|
|
|
|
|
|
|
|
|
|
|
|
|
| 2-Mar-08 |
98 |
|
|
|
|
|
|
|
|
|
|
|
|
|
|
|
|
|
|
| 3-Mar-08 |
117 |
|
|
|
|
|
|
|
|
|
|
|
|
|
|
|
|
|
|
| 4-Mar-08 |
106 |
|
|
|
|
|
|
|
|
|
|
|
|
|
|
|
|
|
|
| 5-Mar-08 |
117 |
|
|
|
|
|
|
|
|
|
|
|
|
|
|
|
|
|
|
| 6-Mar-08 |
115 |
|
|
|
|
|
|
|
|
|
|
|
|
|
|
|
|
|
|
| 7-Mar-08 |
114 |
|
|
|
|
|
|
|
|
|
|
|
|
|
|
|
|
|
|
| 8-Mar-08 |
123 |
|
|
|
|
|
|
|
|
|
|
|
|
|
|
|
|
|
|
| 9-Mar-08 |
119 |
|
|
|
|
|
|
|
|
|
|
|
|
|
|
|
|
|
|
| 10-Mar-08 |
129 |
|
|
|
|
|
|
|
|
|
|
|
|
|
|
|
|
|
|
| 11-Mar-08 |
117 |
|
|
|
|
|
|
|
|
|
|
|
|
|
|
|
|
|
|
| 12-Mar-08 |
121 |
|
|
|
|
|
|
|
|
|
|
|
|
|
|
|
|
|
|
| 13-Mar-08 |
121 |
|
|
|
|
|
|
|
|
|
|
|
|
|
|
|
|
|
|
| 14-Mar-08 |
107 |
|
|
|
|
|
|
|
|
|
|
|
|
|
|
|
|
|
|
| 15-Mar-08 |
119 |
|
|
|
|
|
|
|
|
|
|
|
|
|
|
|
|
|
|
| 16-Mar-08 |
121 |
|
|
|
|
|
|
|
|
|
|
|
|
|
|
|
|
|
|
| 17-Mar-08 |
119 |
|
|
|
|
|
|
|
|
|
|
|
|
|
|
|
|
|
|
| 18-Mar-08 |
129 |
|
|
|
|
|
|
|
|
|
|
|
|
|
|
|
|
|
|
| 19-Mar-08 |
135 |
|
|
|
|
|
|
|
|
|
|
|
|
|
|
|
|
|
|
| 20-Mar-08 |
132 |
|
|
|
|
|
|
|
|
|
|
|
|
|
|
|
|
|
|
| 21-Mar-08 |
156 |
|
|
|
|
|
|
|
|
|
|
|
|
|
|
|
|
|
|
| 22-Mar-08 |
146 |
|
|
|
|
|
|
|
|
|
|
|
|
|
|
|
|
|
|
| 23-Mar-08 |
153 |
|
|
|
|
|
|
|
|
|
|
|
|
|
|
|
|
|
|
| 24-Mar-08 |
160 |
|
|
|
|
|
|
|
|
|
|
|
|
|
|
|
|
|
|
| 25-Mar-08 |
151 |
|
|
|
|
|
|
|
|
|
|
|
|
|
|
|
|
|
|
| 26-Mar-08 |
151 |
|
|
|
|
|
|
|
|
|
|
|
|
|
|
|
|
|
|
| 27-Mar-08 |
147 |
|
|
|
|
|
|
|
|
|
|
|
|
|
|
|
|
|
|
| 28-Mar-08 |
141 |
|
|
|
|
|
|
|
|
|
|
|
|
|
|
|
|
|
|
| 29-Mar-08 |
141 |
|
|
|
|
|
|
|
|
|
|
|
|
|
|
|
|
|
|
| 30-Mar-08 |
145 |
|
|
|
|
|
|
|
|
|
|
|
|
|
|
|
|
|
|
| 31-Mar-08 |
136 |
|
|
|
|
|
|
|
|
|
|
|
|
|
|
|
|
|
|
| 1-Apr-08 |
140 |
|
|
|
|
|
|
|
|
|
|
|
|
|
|
|
|
|
|
| 2-Apr-08 |
144 |
|
|
|
|
|
|
|
|
|
|
|
|
|
|
|
|
|
|
| 3-Apr-08 |
149 |
|
|
|
|
|
|
|
|
|
|
|
|
|
|
|
|
|
|
| 4-Apr-08 |
151 |
|
|
|
|
|
|
|
|
|
|
|
|
|
|
|
|
|
|
| 5-Apr-08 |
145 |
|
|
|
|
|
|
|
|
|
|
|
|
|
|
|
|
|
|
| 6-Apr-08 |
143 |
|
|
|
|
|
|
|
|
|
|
|
|
|
|
|
|
|
|
| 7-Apr-08 |
156 |
|
|
|
|
|
|
|
|
|
|
|
|
|
|
|
|
|
|
| 8-Apr-08 |
182 |
|
|
|
|
|
|
|
|
|
|
|
|
|
|
|
|
|
|
| 9-Apr-08 |
183 |
|
|
|
|
|
|
|
|
|
|
|
|
|
|
|
|
|
|
| 10-Apr-08 |
201 |
|
|
|
|
|
|
|
|
|
|
|
|
|
|
|
|
|
|
| 11-Apr-08 |
195 |
|
|
|
|
|
|
|
|
|
|
|
|
|
|
|
|
|
|
| 12-Apr-08 |
170 |
|
|
|
|
|
|
|
|
|
|
|
|
|
|
|
|
|
|
| 13-Apr-08 |
175 |
|
|
|
|
|
|
|
|
|
|
|
|
|
|
|
|
|
|
| 14-Apr-08 |
179 |
|
|
|
|
|
|
|
|
|
|
|
|
|
|
|
|
|
|
| 15-Apr-08 |
170 |
|
|
|
|
|
|
|
|
|
|
|
|
|
|
|
|
|
|
| 16-Apr-08 |
176 |
|
|
|
|
|
|
|
|
|
|
|
|
|
|
|
|
|
|
| 17-Apr-08 |
192 |
|
|
|
|
|
|
|
|
|
|
|
|
|
|
|
|
|
|
| 18-Apr-08 |
188 |
|
|
|
|
|
|
|
|
|
|
|
|
|
|
|
|
|
|
| 19-Apr-08 |
197 |
|
|
|
|
|
|
|
|
|
|
|
|
|
|
|
|
|
|
| 20-Apr-08 |
208 |
|
|
|
|
|
|
|
|
|
|
|
|
|
|
|
|
|
|
| 21-Apr-08 |
206 |
|
|
|
|
|
|
|
|
|
|
|
|
|
|
|
|
|
|
| 22-Apr-08 |
220 |
|
|
|
|
|
|
|
|
|
|
|
|
|
|
|
|
|
|
| 23-Apr-08 |
219 |
|
|
|
|
|
|
|
|
|
|
|
|
|
|
|
|
|
|
| 24-Apr-08 |
218 |
|
|
|
|
|
|
|
|
|
|
|
|
|
|
|
|
|
|
| 25-Apr-08 |
225 |
|
|
|
|
|
|
|
|
|
|
|
|
|
|
|
|
|
|
| 26-Apr-08 |
225 |
|
|
|
|
|
|
|
|
|
|
|
|
|
|
|
|
|
|
| 27-Apr-08 |
234 |
|
|
|
|
|
|
|
|
|
|
|
|
|
|
|
|
|
|
| 28-Apr-08 |
205 |
|
|
|
|
|
|
|
|
|
|
|
|
|
|
|
|
|
|
| 29-Apr-08 |
193 |
|
|
|
|
|
|
|
|
|
|
|
|
|
|
|
|
|
|
| 30-Apr-08 |
206 |
|
|
|
|
|
|
|
|
|
|
|
|
|
|
|
|
|
|
| 1-May-08 |
197 |
|
|
|
|
|
|
|
|
|
|
|
|
|
|
|
|
|
|
| 2-May-08 |
202 |
|
|
|
|
|
|
|
|
|
|
|
|
|
|
|
|
|
|
| 3-May-08 |
216 |
|
|
|
|
|
|
|
|
|
|
|
|
|
|
|
|
|
|
| 4-May-08 |
209 |
|
|
|
|
|
|
|
|
|
|
|
|
|
|
|
|
|
|
| 5-May-08 |
218 |
|
|
|
|
|
|
|
|
|
|
|
|
|
|
|
|
|
|
| 6-May-08 |
224 |
|
|
|
|
|
|
|
|
|
|
|
|
|
|
|
|
|
|
| 7-May-08 |
210 |
|
|
|
|
|
|
|
|
|
|
|
|
|
|
|
|
|
|
| 8-May-08 |
191 |
|
|
|
|
|
|
|
|
|
|
|
|
|
|
|
|
|
|
| 9-May-08 |
199 |
|
|
|
|
|
|
|
|
|
|
|
|
|
|
|
|
|
|
| 10-May-08 |
206 |
|
|
|
|
|
|
|
|
|
|
|
|
|
|
|
|
|
|
| 11-May-08 |
215 |
|
|
|
|
|
|
|
|
|
|
|
|
|
|
|
|
|
|
| 12-May-08 |
231 |
|
|
|
|
|
|
|
|
|
|
|
|
|
|
|
|
|
|
| 13-May-08 |
226 |
|
|
|
|
|
|
|
|
|
|
|
|
|
|
|
|
|
|
| 14-May-08 |
219 |
|
|
|
|
|
|
|
|
|
|
|
|
|
|
|
|
|
|
| 15-May-08 |
212 |
|
|
|
|
|
|
|
|
|
|
|
|
|
|
|
|
|
|
| 16-May-08 |
198 |
|
|
|
|
|
|
|
|
|
|
|
|
|
|
|
|
|
|
| 17-May-08 |
196 |
|
|
|
|
|
|
|
|
|
|
|
|
|
|
|
|
|
|
| 18-May-08 |
189 |
|
|
|
|
|
|
|
|
|
|
|
|
|
|
|
|
|
|
| 19-May-08 |
185 |
|
|
|
|
|
|
|
|
|
|
|
|
|
|
|
|
|
|
| 20-May-08 |
194 |
|
|
|
|
|
|
|
|
|
|
|
|
|
|
|
|
|
|
| 21-May-08 |
197 |
|
|
|
|
|
|
|
|
|
|
|
|
|
|
|
|
|
|
| 22-May-08 |
221 |
|
|
|
|
|
|
|
|
|
|
|
|
|
|
|
|
|
|
| 23-May-08 |
222 |
|
|
|
|
|
|
|
|
|
|
|
|
|
|
|
|
|
|
| 24-May-08 |
203 |
|
|
|
|
|
|
|
|
|
|
|
|
|
|
|
|
|
|
| 25-May-08 |
212 |
|
|
|
|
|
|
|
|
|
|
|
|
|
|
|
|
|
|
| 26-May-08 |
205 |
|
|
|
|
|
|
|
|
|
|
|
|
|
|
|
|
|
|
| 27-May-08 |
213 |
|
|
|
|
|
|
|
|
|
|
|
|
|
|
|
|
|
|
| 28-May-08 |
240 |
|
|
|
|
|
|
|
|
|
|
|
|
|
|
|
|
|
|
| 29-May-08 |
238 |
|
|
|
|
|
|
|
|
|
|
|
|
|
|
|
|
|
|
| 30-May-08 |
249 |
|
|
|
|
|
|
|
|
|
|
|
|
|
|
|
|
|
|
| 31-May-08 |
252 |
|
|
|
|
|
|
|
|
|
|
|
|
|
|
|
|
|
|
| 1-Jun-08 |
255 |
|
|
|
|
|
|
|
|
|
|
|
|
|
|
|
|
|
|
| 2-Jun-08 |
262 |
|
|
|
|
|
|
|
|
|
|
|
|
|
|
|
|
|
|
| 3-Jun-08 |
255 |
|
|
|
|
|
|
|
|
|
|
|
|
|
|
|
|
|
|
| 4-Jun-08 |
263 |
|
|
|
|
|
|
|
|
|
|
|
|
|
|
|
|
|
|
| 5-Jun-08 |
259 |
|
|
|
|
|
|
|
|
|
|
|
|
|
|
|
|
|
|
| 6-Jun-08 |
244 |
|
|
|
|
|
|
|
|
|
|
|
|
|
|
|
|
|
|
| 7-Jun-08 |
291 |
|
|
|
|
|
|
|
|
|
|
|
|
|
|
|
|
|
|
| 8-Jun-08 |
211 |
|
|
|
|
|
|
|
|
|
|
|
|
|
|
|
|
|
|
| 9-Jun-08 |
217 |
|
|
|
|
|
|
|
|
|
|
|
|
|
|
|
|
|
|
| 10-Jun-08 |
220 |
|
|
|
|
|
|
|
|
|
|
|
|
|
|
|
|
|
|
| 11-Jun-08 |
246 |
|
|
|
|
|
|
|
|
|
|
|
|
|
|
|
|
|
|
| 12-Jun-08 |
269 |
|
|
|
|
|
|
|
|
|
|
|
|
|
|
|
|
|
|
| 13-Jun-08 |
232 |
|
|
|
|
|
|
|
|
|
|
|
|
|
|
|
|
|
|
| 14-Jun-08 |
247 |
|
|
|
|
|
|
|
|
|
|
|
|
|
|
|
|
|
|
| 15-Jun-08 |
234 |
|
|
|
|
|
|
|
|
|
|
|
|
|
|
|
|
|
|
| 16-Jun-08 |
230 |
|
|
|
|
|
|
|
|
|
|
|
|
|
|
|
|
|
|
| 17-Jun-08 |
264 |
|
|
|
|
|
|
|
|
|
|
|
|
|
|
|
|
|
|
| 18-Jun-08 |
266 |
|
|
|
|
|
|
|
|
|
|
|
|
|
|
|
|
|
|
| 19-Jun-08 |
261 |
|
|
|
|
|
|
|
|
|
|
|
|
|
|
|
|
|
|
| 20-Jun-08 |
251 |
|
|
|
|
|
|
|
|
|
|
|
|
|
|
|
|
|
|
| 21-Jun-08 |
228 |
|
|
|
|
|
|
|
|
|
|
|
|
|
|
|
|
|
|
| 22-Jun-08 |
229 |
|
|
|
|
|
|
|
|
|
|
|
|
|
|
|
|
|
|
| 23-Jun-08 |
270 |
|
|
|
|
|
|
|
|
|
|
|
|
|
|
|
|
|
|
| 24-Jun-08 |
292 |
|
|
|
|
|
|
|
|
|
|
|
|
|
|
|
|
|
|
| 25-Jun-08 |
313 |
|
|
|
|
|
|
|
|
|
|
|
|
|
|
|
|
|
|
| 26-Jun-08 |
297 |
|
|
|
|
|
|
|
|
|
|
|
|
|
|
|
|
|
|
| 27-Jun-08 |
275 |
|
|
|
|
|
|
|
|
|
|
|
|
|
|
|
|
|
|
| 28-Jun-08 |
258 |
|
|
|
|
|
|
|
|
|
|
|
|
|
|
|
|
|
|
| 29-Jun-08 |
266 |
|
|
|
|
|
|
|
|
|
|
|
|
|
|
|
|
|
|
| 30-Jun-08 |
266 |
|
|
|
|
|
|
|
|
|
|
|
|
|
|
|
|
|
|
| 1-Jul-08 |
260 |
|
|
|
|
|
|
|
|
|
|
|
|
|
|
|
|
|
|
| 2-Jul-08 |
259 |
|
|
|
|
|
|
|
|
|
|
|
|
|
|
|
|
|
|
| 3-Jul-08 |
260 |
|
|
|
|
|
|
|
|
|
|
|
|
|
|
|
|
|
|
| 4-Jul-08 |
275 |
|
|
|
|
|
|
|
|
|
|
|
|
|
|
|
|
|
|
| 5-Jul-08 |
269 |
|
|
|
|
|
|
|
|
|
|
|
|
|
|
|
|
|
|
| 6-Jul-08 |
261 |
|
|
|
|
|
|
|
|
|
|
|
|
|
|
|
|
|
|
| 7-Jul-08 |
265 |
|
|
|
|
|
|
|
|
|
|
|
|
|
|
|
|
|
|
| 8-Jul-08 |
250 |
|
|
|
|
|
|
|
|
|
|
|
|
|
|
|
|
|
|
| 9-Jul-08 |
253 |
|
|
|
|
|
|
|
|
|
|
|
|
|
|
|
|
|
|
| 10-Jul-08 |
266 |
|
|
|
|
|
|
|
|
|
|
|
|
|
|
|
|
|
|
| 11-Jul-08 |
258 |
|
|
|
|
|
|
|
|
|
|
|
|
|
|
|
|
|
|
| 12-Jul-08 |
258 |
|
|
|
|
|
|
|
|
|
|
|
|
|
|
|
|
|
|
| 13-Jul-08 |
261 |
|
|
|
|
|
|
|
|
|
|
|
|
|
|
|
|
|
|
| 14-Jul-08 |
224 |
|
|
|
|
|
|
|
|
|
|
|
|
|
|
|
|
|
|
| 15-Jul-08 |
263 |
|
|
|
|
|
|
|
|
|
|
|
|
|
|
|
|
|
|
| 16-Jul-08 |
238 |
|
|
|
|
|
|
|
|
|
|
|
|
|
|
|
|
|
|
| 17-Jul-08 |
228 |
|
|
|
|
|
|
|
|
|
|
|
|
|
|
|
|
|
|
| 18-Jul-08 |
218 |
|
|
|
|
|
|
|
|
|
|
|
|
|
|
|
|
|
|
| 19-Jul-08 |
223 |
|
|
|
|
|
|
|
|
|
|
|
|
|
|
|
|
|
|
| 20-Jul-08 |
206 |
|
|
|
|
|
|
|
|
|
|
|
|
|
|
|
|
|
|
| 21-Jul-08 |
192 |
|
|
|
|
|
|
|
|
|
|
|
|
|
|
|
|
|
|
| 22-Jul-08 |
195 |
|
|
|
|
|
|
|
|
|
|
|
|
|
|
|
|
|
|
| 23-Jul-08 |
200 |
|
|
|
|
|
|
|
|
|
|
|
|
|
|
|
|
|
|
| 24-Jul-08 |
205 |
|
|
|
|
|
|
|
|
|
|
|
|
|
|
|
|
|
|
| 25-Jul-08 |
216 |
|
|
|
|
|
|
|
|
|
|
|
|
|
|
|
|
|
|
| 26-Jul-08 |
212 |
|
|
|
|
|
|
|
|
|
|
|
|
|
|
|
|
|
|
| 27-Jul-08 |
194 |
|
|
|
|
|
|
|
|
|
|
|
|
|
|
|
|
|
|
| 28-Jul-08 |
193 |
|
|
|
|
|
|
|
|
|
|
|
|
|
|
|
|
|
|
| 29-Jul-08 |
175 |
|
|
|
|
|
|
|
|
|
|
|
|
|
|
|
|
|
|
| 30-Jul-08 |
178 |
|
|
|
|
|
|
|
|
|
|
|
|
|
|
|
|
|
|
| 31-Jul-08 |
203 |
|
|
|
|
|
|
|
|
|
|
|
|
|
|
|
|
|
|
| 1-Aug-08 |
205 |
|
|
|
|
|
|
|
|
|
|
|
|
|
|
|
|
|
|
| 2-Aug-08 |
208 |
|
|
|
|
|
|
|
|
|
|
|
|
|
|
|
|
|
|
| 3-Aug-08 |
192 |
|
|
|
|
|
|
|
|
|
|
|
|
|
|
|
|
|
|
| 4-Aug-08 |
173 |
|
|
|
|
|
|
|
|
|
|
|
|
|
|
|
|
|
|
| 5-Aug-08 |
188 |
|
|
|
|
|
|
|
|
|
|
|
|
|
|
|
|
|
|
| 6-Aug-08 |
217 |
|
|
|
|
|
|
|
|
|
|
|
|
|
|
|
|
|
|
| 7-Aug-08 |
107 |
|
|
|
|
|
|
|
|
|
|
|
|
|
|
|
|
|
|
| 8-Aug-08 |
73 |
|
|
|
|
|
|
|
|
|
|
|
|
|
|
|
|
|
|
| 9-Aug-08 |
26 |
|
|
|
|
|
|
|
|
|
|
|
|
|
|
|
|
|
|
| 10-Aug-08 |
15 |
|
|
|
|
|
|
|
|
|
|
|
|
|
|
|
|
|
|
| 11-Aug-08 |
134 |
|
|
|
|
|
|
|
|
|
|
|
|
|
|
|
|
|
|
| 12-Aug-08 |
169 |
|
|
|
|
|
|
|
|
|
|
|
|
|
|
|
|
|
|
| 13-Aug-08 |
148 |
|
|
|
|
|
|
|
|
|
|
|
|
|
|
|
|
|
|
| 14-Aug-08 |
144 |
|
|
|
|
|
|
|
|
|
|
|
|
|
|
|
|
|
|
| 15-Aug-08 |
135 |
|
|
|
|
|
|
|
|
|
|
|
|
|
|
|
|
|
|
| 16-Aug-08 |
133 |
|
|
|
|
|
|
|
|
|
|
|
|
|
|
|
|
|
|
| 17-Aug-08 |
137 |
|
|
|
|
|
|
|
|
|
|
|
|
|
|
|
|
|
|
| 18-Aug-08 |
117 |
|
|
|
|
|
|
|
|
|
|
|
|
|
|
|
|
|
|
| 19-Aug-08 |
92 |
|
|
|
|
|
|
|
|
|
|
|
|
|
|
|
|
|
|
| 20-Aug-08 |
118 |
|
|
|
|
|
|
|
|
|
|
|
|
|
|
|
|
|
|
| 21-Aug-08 |
124 |
|
|
|
|
|
|
|
|
|
|
|
|
|
|
|
|
|
|
| 22-Aug-08 |
135 |
|
|
|
|
|
|
|
|
|
|
|
|
|
|
|
|
|
|
| 23-Aug-08 |
155 |
|
|
|
|
|
|
|
|
|
|
|
|
|
|
|
|
|
|
| 24-Aug-08 |
161 |
|
|
|
|
|
|
|
|
|
|
|
|
|
|
|
|
|
|
| 25-Aug-08 |
163 |
|
|
|
|
|
|
|
|
|
|
|
|
|
|
|
|
|
|
| 26-Aug-08 |
167 |
|
|
|
|
|
|
|
|
|
|
|
|
|
|
|
|
|
|
| 27-Aug-08 |
169 |
|
|
|
|
|
|
|
|
|
|
|
|
|
|
|
|
|
|
| 28-Aug-08 |
162 |
|
|
|
|
|
|
|
|
|
|
|
|
|
|
|
|
|
|
| 29-Aug-08 |
157 |
|
|
|
|
|
|
|
|
|
|
|
|
|
|
|
|
|
|
| 30-Aug-08 |
151 |
|
|
|
|
|
|
|
|
|
|
|
|
|
|
|
|
|
|
| 31-Aug-08 |
153 |
|
|
|
|
|
|
|
|
|
|
|
|
|
|
|
|
|
|
| 1-Sep-08 |
159 |
|
|
|
|
|
|
|
|
|
|
|
|
|
|
|
|
|
|
| 2-Sep-08 |
169 |
|
|
|
|
|
|
|
|
|
|
|
|
|
|
|
|
|
|
| 3-Sep-08 |
180 |
|
|
|
|
|
|
|
|
|
|
|
|
|
|
|
|
|
|
| 4-Sep-08 |
173 |
|
|
|
|
|
|
|
|
|
|
|
|
|
|
|
|
|
|
| 5-Sep-08 |
168 |
|
|
|
|
|
|
|
|
|
|
|
|
|
|
|
|
|
|
| 6-Sep-08 |
134 |
|
|
|
|
|
|
|
|
|
|
|
|
|
|
|
|
|
|
| 7-Sep-08 |
117 |
|
|
|
|
|
|
|
|
|
|
|
|
|
|
|
|
|
|
| 8-Sep-08 |
101 |
|
|
|
|
|
|
|
|
|
|
|
|
|
|
|
|
|
|
| 9-Sep-08 |
105 |
|
|
|
|
|
|
|
|
|
|
|
|
|
|
|
|
|
|
| 10-Sep-08 |
125 |
|
|
|
|
|
|
|
|
|
|
|
|
|
|
|
|
|
|
| 11-Sep-08 |
139 |
|
|
|
|
|
|
|
|
|
|
|
|
|
|
|
|
|
|
| 12-Sep-08 |
158 |
|
|
|
|
|
|
|
|
|
|
|
|
|
|
|
|
|
|
| 13-Sep-08 |
171 |
|
|
|
|
|
|
|
|
|
|
|
|
|
|
|
|
|
|
| 14-Sep-08 |
159 |
|
|
|
|
|
|
|
|
|
|
|
|
|
|
|
|
|
|
| 15-Sep-08 |
156 |
|
|
|
|
|
|
|
|
|
|
|
|
|
|
|
|
|
|
| 16-Sep-08 |
146 |
|
|
|
|
|
|
|
|
|
|
|
|
|
|
|
|
|
|
| 17-Sep-08 |
122 |
|
|
|
|
|
|
|
|
|
|
|
|
|
|
|
|
|
|
| 18-Sep-08 |
133 |
|
|
|
|
|
|
|
|
|
|
|
|
|
|
|
|
|
|
| 19-Sep-08 |
135 |
|
|
|
|
|
|
|
|
|
|
|
|
|
|
|
|
|
|
| 20-Sep-08 |
149 |
|
|
|
|
|
|
|
|
|
|
|
|
|
|
|
|
|
|
| 21-Sep-08 |
146 |
|
|
|
|
|
|
|
|
|
|
|
|
|
|
|
|
|
|
| 22-Sep-08 |
128 |
|
|
|
|
|
|
|
|
|
|
|
|
|
|
|
|
|
|
| 23-Sep-08 |
121 |
|
|
|
|
|
|
|
|
|
|
|
|
|
|
|
|
|
|
| 24-Sep-08 |
105 |
|
|
|
|
|
|
|
|
|
|
|
|
|
|
|
|
|
|
| 25-Sep-08 |
117 |
|
|
|
|
|
|
|
|
|
|
|
|
|
|
|
|
|
|
| 26-Sep-08 |
123 |
|
|
|
|
|
|
|
|
|
|
|
|
|
|
|
|
|
|
| 27-Sep-08 |
112 |
|
|
|
|
|
|
|
|
|
|
|
|
|
|
|
|
|
|
| 28-Sep-08 |
127 |
|
|
|
|
|
|
|
|
|
|
|
|
|
|
|
|
|
|
| 29-Sep-08 |
120 |
|
|
|
|
|
|
|
|
|
|
|
|
|
|
|
|
|
|
| 30-Sep-08 |
130 |
|
|
|
|
|
|
|
|
|
|
|
|
|
|
|
|
|
|
| 1-Oct-08 |
136 |
|
|
|
|
|
|
|
|
|
|
|
|
|
|
|
|
|
|
| 2-Oct-08 |
145 |
|
|
|
|
|
|
|
|
|
|
|
|
|
|
|
|
|
|
| 3-Oct-08 |
123 |
|
|
|
|
|
|
|
|
|
|
|
|
|
|
|
|
|
|
| 4-Oct-08 |
115 |
|
|
|
|
|
|
|
|
|
|
|
|
|
|
|
|
|
|
| 5-Oct-08 |
113 |
|
|
|
|
|
|
|
|
|
|
|
|
|
|
|
|
|
|
| 6-Oct-08 |
106 |
|
|
|
|
|
|
|
|
|
|
|
|
|
|
|
|
|
|
| 7-Oct-08 |
106 |
|
|
|
|
|
|
|
|
|
|
|
|
|
|
|
|
|
|
| 8-Oct-08 |
103 |
|
|
|
|
|
|
|
|
|
|
|
|
|
|
|
|
|
|
| 9-Oct-08 |
115 |
|
|
|
|
|
|
|
|
|
|
|
|
|
|
|
|
|
|
| 10-Oct-08 |
112 |
|
|
|
|
|
|
|
|
|
|
|
|
|
|
|
|
|
|
| 11-Oct-08 |
132 |
|
|
|
|
|
|
|
|
|
|
|
|
|
|
|
|
|
|
| 12-Oct-08 |
147 |
|
|
|
|
|
|
|
|
|
|
|
|
|
|
|
|
|
|
| 13-Oct-08 |
143 |
|
|
|
|
|
|
|
|
|
|
|
|
|
|
|
|
|
|
| 14-Oct-08 |
144 |
|
|
|
|
|
|
|
|
|
|
|
|
|
|
|
|
|
|
| 15-Oct-08 |
134 |
|
|
|
|
|
|
|
|
|
|
|
|
|
|
|
|
|
|
| 16-Oct-08 |
154 |
|
|
|
|
|
|
|
|
|
|
|
|
|
|
|
|
|
|
| 17-Oct-08 |
153 |
|
|
|
|
|
|
|
|
|
|
|
|
|
|
|
|
|
|
| 18-Oct-08 |
147 |
|
|
|
|
|
|
|
|
|
|
|
|
|
|
|
|
|
|
| 19-Oct-08 |
128 |
|
|
|
|
|
|
|
|
|
|
|
|
|
|
|
|
|
|
| 20-Oct-08 |
109 |
|
|
|
|
|
|
|
|
|
|
|
|
|
|
|
|
|
|
| 21-Oct-08 |
96 |
|
|
|
|
|
|
|
|
|
|
|
|
|
|
|
|
|
|
| 22-Oct-08 |
74 |
|
|
|
|
|
|
|
|
|
|
|
|
|
|
|
|
|
|
| 23-Oct-08 |
96 |
|
|
|
|
|
|
|
|
|
|
|
|
|
|
|
|
|
|
| 24-Oct-08 |
97 |
|
|
|
|
|
|
|
|
|
|
|
|
|
|
|
|
|
|
| 25-Oct-08 |
102 |
|
|
|
|
|
|
|
|
|
|
|
|
|
|
|
|
|
|
| 26-Oct-08 |
112 |
|
|
|
|
|
|
|
|
|
|
|
|
|
|
|
|
|
|
| 27-Oct-08 |
129 |
|
|
|
|
|
|
|
|
|
|
|
|
|
|
|
|
|
|
| 28-Oct-08 |
132 |
|
|
|
|
|
|
|
|
|
|
|
|
|
|
|
|
|
|
| 29-Oct-08 |
129 |
|
|
|
|
|
|
|
|
|
|
|
|
|
|
|
|
|
|
| 30-Oct-08 |
132 |
|
|
|
|
|
|
|
|
|
|
|
|
|
|
|
|
|
|
| 31-Oct-08 |
98 |
|
|
|
|
|
|
|
|
|
|
|
|
|
|
|
|
|
|
| 1-Nov-08 |
87 |
|
|
|
|
|
|
|
|
|
|
|
|
|
|
|
|
|
|
| 2-Nov-08 |
72 |
|
|
|
|
|
|
|
|
|
|
|
|
|
|
|
|
|
|
| 3-Nov-08 |
70 |
|
|
|
|
|
|
|
|
|
|
|
|
|
|
|
|
|
|
| 4-Nov-08 |
65 |
|
|
|
|
|
|
|
|
|
|
|
|
|
|
|
|
|
|
| 5-Nov-08 |
78 |
|
|
|
|
|
|
|
|
|
|
|
|
|
|
|
|
|
|
| 6-Nov-08 |
77 |
|
|
|
|
|
|
|
|
|
|
|
|
|
|
|
|
|
|
| 7-Nov-08 |
80 |
|
|
|
|
|
|
|
|
|
|
|
|
|
|
|
|
|
|
| 8-Nov-08 |
87 |
|
|
|
|
|
|
|
|
|
|
|
|
|
|
|
|
|
|
| 9-Nov-08 |
89 |
|
|
|
|
|
|
|
|
|
|
|
|
|
|
|
|
|
|
| 10-Nov-08 |
91 |
|
|
|
|
|
|
|
|
|
|
|
|
|
|
|
|
|
|
| 11-Nov-08 |
83 |
|
|
|
|
|
|
|
|
|
|
|
|
|
|
|
|
|
|
| 12-Nov-08 |
87 |
|
|
|
|
|
|
|
|
|
|
|
|
|
|
|
|
|
|
| 13-Nov-08 |
82 |
|
|
|
|
|
|
|
|
|
|
|
|
|
|
|
|
|
|
| 14-Nov-08 |
86 |
|
|
|
|
|
|
|
|
|
|
|
|
|
|
|
|
|
|
| 15-Nov-08 |
98 |
|
|
|
|
|
|
|
|
|
|
|
|
|
|
|
|
|
|
| 16-Nov-08 |
109 |
|
|
|
|
|
|
|
|
|
|
|
|
|
|
|
|
|
|
| 17-Nov-08 |
108 |
|
|
|
|
|
|
|
|
|
|
|
|
|
|
|
|
|
|
| 18-Nov-08 |
95 |
|
|
|
|
|
|
|
|
|
|
|
|
|
|
|
|
|
|
| 19-Nov-08 |
94 |
|
|
|
|
|
|
|
|
|
|
|
|
|
|
|
|
|
|
| 20-Nov-08 |
82 |
|
|
|
|
|
|
|
|
|
|
|
|
|
|
|
|
|
|
| 21-Nov-08 |
85 |
|
|
|
|
|
|
|
|
|
|
|
|
|
|
|
|
|
|
| 22-Nov-08 |
109 |
|
|
|
|
|
|
|
|
|
|
|
|
|
|
|
|
|
|
| 23-Nov-08 |
116 |
|
|
|
|
|
|
|
|
|
|
|
|
|
|
|
|
|
|
| 24-Nov-08 |
88 |
|
|
|
|
|
|
|
|
|
|
|
|
|
|
|
|
|
|
| 25-Nov-08 |
83 |
|
|
|
|
|
|
|
|
|
|
|
|
|
|
|
|
|
|
| 26-Nov-08 |
88 |
|
|
|
|
|
|
|
|
|
|
|
|
|
|
|
|
|
|
| 27-Nov-08 |
88 |
|
|
|
|
|
|
|
|
|
|
|
|
|
|
|
|
|
|
| 28-Nov-08 |
101 |
|
|
|
|
|
|
|
|
|
|
|
|
|
|
|
|
|
|
| 29-Nov-08 |
109 |
|
|
|
|
|
|
|
|
|
|
|
|
|
|
|
|
|
|
| 30-Nov-08 |
124 |
|
|
|
|
|
|
|
|
|
|
|
|
|
|
|
|
|
|
| 1-Dec-08 |
133 |
|
|
|
|
|
|
|
|
|
|
|
|
|
|
|
|
|
|
| 2-Dec-08 |
132 |
|
|
|
|
|
|
|
|
|
|
|
|
|
|
|
|
|
|
| 3-Dec-08 |
120 |
|
|
|
|
|
|
|
|
|
|
|
|
|
|
|
|
|
|
| 4-Dec-08 |
123 |
|
|
|
|
|
|
|
|
|
|
|
|
|
|
|
|
|
|
| 5-Dec-08 |
118 |
|
|
|
|
|
|
|
|
|
|
|
|
|
|
|
|
|
|
| 6-Dec-08 |
104 |
|
|
|
|
|
|
|
|
|
|
|
|
|
|
|
|
|
|
| 7-Dec-08 |
111 |
|
|
|
|
|
|
|
|
|
|
|
|
|
|
|
|
|
|
| 8-Dec-08 |
102 |
|
|
|
|
|
|
|
|
|
|
|
|
|
|
|
|
|
|
| 9-Dec-08 |
100 |
|
|
|
|
|
|
|
|
|
|
|
|
|
|
|
|
|
|
| 10-Dec-08 |
97 |
|
|
|
|
|
|
|
|
|
|
|
|
|
|
|
|
|
|
| 11-Dec-08 |
101 |
|
|
|
|
|
|
|
|
|
|
|
|
|
|
|
|
|
|
| 12-Dec-08 |
100 |
|
|
|
|
|
|
|
|
|
|
|
|
|
|
|
|
|
|
| 13-Dec-08 |
89 |
|
|
|
|
|
|
|
|
|
|
|
|
|
|
|
|
|
|
| 14-Dec-08 |
92 |
|
|
|
|
|
|
|
|
|
|
|
|
|
|
|
|
|
|
| 15-Dec-08 |
83 |
|
|
|
|
|
|
|
|
|
|
|
|
|
|
|
|
|
|
| 16-Dec-08 |
84 |
|
|
|
|
|
|
|
|
|
|
|
|
|
|
|
|
|
|
| 17-Dec-08 |
104 |
|
|
|
|
|
|
|
|
|
|
|
|
|
|
|
|
|
|
| 18-Dec-08 |
108 |
|
|
|
|
|
|
|
|
|
|
|
|
|
|
|
|
|
|
| 19-Dec-08 |
114 |
|
|
|
|
|
|
|
|
|
|
|
|
|
|
|
|
|
|
| 20-Dec-08 |
107 |
|
|
|
|
|
|
|
|
|
|
|
|
|
|
|
|
|
|
| 21-Dec-08 |
107 |
|
|
|
|
|
|
|
|
|
|
|
|
|
|
|
|
|
|
| 22-Dec-08 |
116 |
|
|
|
|
|
|
|
|
|
|
|
|
|
|
|
|
|
|
| 23-Dec-08 |
106 |
|
|
|
|
|
|
|
|
|
|
|
|
|
|
|
|
|
|
| 24-Dec-08 |
102 |
|
|
|
|
|
|
|
|
|
|
|
|
|
|
|
|
|
|
| 25-Dec-08 |
95 |
|
|
|
|
|
|
|
|
|
|
|
|
|
|
|
|
|
|
| 26-Dec-08 |
98 |
|
|
|
|
|
|
|
|
|
|
|
|
|
|
|
|
|
|
| 27-Dec-08 |
96 |
|
|
|
|
|
|
|
|
|
|
|
|
|
|
|
|
|
|
| 28-Dec-08 |
99 |
|
|
|
|
|
|
|
|
|
|
|
|
|
|
|
|
|
|
| 29-Dec-08 |
108 |
|
|
|
|
|
|
|
|
|
|
|
|
|
|
|
|
|
|
| 30-Dec-08 |
105 |
|
|
|
|
|
|
|
|
|
|
|
|
|
|
|
|
|
|
| 31-Dec-08 |
113 |
|
|
|
|
|
|
|
|
|
|
|
|
|
|
|
|
|
|
| 1-Jan-09 |
93 |
|
|
|
|
|
|
|
|
|
|
|
|
|
|
|
|
|
|
| 2-Jan-09 |
100 |
|
|
|
|
|
|
|
|
|
|
|
|
|
|
|
|
|
|
| 3-Jan-09 |
92 |
|
|
|
|
|
|
|
|
|
|
|
|
|
|
|
|
|
|
| 4-Jan-09 |
90 |
|
|
|
|
|
|
|
|
|
|
|
|
|
|
|
|
|
|
| 5-Jan-09 |
92 |
|
|
|
|
|
|
|
|
|
|
|
|
|
|
|
|
|
|
| 6-Jan-09 |
98 |
|
|
|
|
|
|
|
|
|
|
|
|
|
|
|
|
|
|
| 7-Jan-09 |
103 |
|
|
|
|
|
|
|
|
|
|
|
|
|
|
|
|
|
|
| 8-Jan-09 |
90 |
|
|
|
|
|
|
|
|
|
|
|
|
|
|
|
|
|
|
| 9-Jan-09 |
83 |
|
|
|
|
|
|
|
|
|
|
|
|
|
|
|
|
|
|
| 10-Jan-09 |
69 |
|
|
|
|
|
|
|
|
|
|
|
|
|
|
|
|
|
|
| 11-Jan-09 |
70 |
|
|
|
|
|
|
|
|
|
|
|
|
|
|
|
|
|
|
| 12-Jan-09 |
87 |
|
|
|
|
|
|
|
|
|
|
|
|
|
|
|
|
|
|
| 13-Jan-09 |
92 |
|
|
|
|
|
|
|
|
|
|
|
|
|
|
|
|
|
|
| 14-Jan-09 |
87 |
|
|
|
|
|
|
|
|
|
|
|
|
|
|
|
|
|
|
| 15-Jan-09 |
86 |
|
|
|
|
|
|
|
|
|
|
|
|
|
|
|
|
|
|
| 16-Jan-09 |
79 |
|
|
|
|
|
|
|
|
|
|
|
|
|
|
|
|
|
|
| 17-Jan-09 |
64 |
|
|
|
|
|
|
|
|
|
|
|
|
|
|
|
|
|
|
| 18-Jan-09 |
63 |
|
|
|
|
|
|
|
|
|
|
|
|
|
|
|
|
|
|
| 19-Jan-09 |
31 |
|
|
|
|
|
|
|
|
|
|
|
|
|
|
|
|
|
|
| 20-Jan-09 |
41 |
|
|
|
|
|
|
|
|
|
|
|
|
|
|
|
|
|
|
| 21-Jan-09 |
61 |
|
|
|
|
|
|
|
|
|
|
|
|
|
|
|
|
|
|
| 22-Jan-09 |
67 |
|
|
|
|
|
|
|
|
|
|
|
|
|
|
|
|
|
|
| 23-Jan-09 |
93 |
|
|
|
|
|
|
|
|
|
|
|
|
|
|
|
|
|
|
| 24-Jan-09 |
89 |
|
|
|
|
|
|
|
|
|
|
|
|
|
|
|
|
|
|
| 25-Jan-09 |
91 |
|
|
|
|
|
|
|
|
|
|
|
|
|
|
|
|
|
|
| 26-Jan-09 |
79 |
|
|
|
|
|
|
|
|
|
|
|
|
|
|
|
|
|
|
| 27-Jan-09 |
66 |
|
|
|
|
|
|
|
|
|
|
|
|
|
|
|
|
|
|
| 28-Jan-09 |
63 |
|
|
|
|
|
|
|
|
|
|
|
|
|
|
|
|
|
|
| 29-Jan-09 |
60 |
|
|
|
|
|
|
|
|
|
|
|
|
|
|
|
|
|
|
| 30-Jan-09 |
75 |
|
|
|
|
|
|
|
|
|
|
|
|
|
|
|
|
|
|
| 31-Jan-09 |
81 |
|
|
|
|
|
|
|
|
|
|
|
|
|
|
|
|
|
|
| 1-Feb-09 |
96 |
|
|
|
|
|
|
|
|
|
|
|
|
|
|
|
|
|
|
| 2-Feb-09 |
100 |
|
|
|
|
|
|
|
|
|
|
|
|
|
|
|
|
|
|
| 3-Feb-09 |
118 |
|
|
|
|
|
|
|
|
|
|
|
|
|
|
|
|
|
|
| 4-Feb-09 |
123 |
|
|
|
|
|
|
|
|
|
|
|
|
|
|
|
|
|
|
| 5-Feb-09 |
131 |
|
|
|
|
|
|
|
|
|
|
|
|
|
|
|
|
|
|
| 6-Feb-09 |
134 |
|
|
|
|
|
|
|
|
|
|
|
|
|
|
|
|
|
|
| 7-Feb-09 |
120 |
|
|
|
|
|
|
|
|
|
|
|
|
|
|
|
|
|
|
| 8-Feb-09 |
134 |
|
|
|
|
|
|
|
|
|
|
|
|
|
|
|
|
|
|
| 9-Feb-09 |
127 |
|
|
|
|
|
|
|
|
|
|
|
|
|
|
|
|
|
|
| 10-Feb-09 |
139 |
|
|
|
|
|
|
|
|
|
|
|
|
|
|
|
|
|
|
| 11-Feb-09 |
126 |
|
|
|
|
|
|
|
|
|
|
|
|
|
|
|
|
|
|
| 12-Feb-09 |
133 |
|
|
|
|
|
|
|
|
|
|
|
|
|
|
|
|
|
|
| 13-Feb-09 |
128 |
|
|
|
|
|
|
|
|
|
|
|
|
|
|
|
|
|
|
| 14-Feb-09 |
113 |
|
|
|
|
|
|
|
|
|
|
|
|
|
|
|
|
|
|
| 15-Feb-09 |
121 |
|
|
|
|
|
|
|
|
|
|
|
|
|
|
|
|
|
|
| 16-Feb-09 |
99 |
|
|
|
|
|
|
|
|
|
|
|
|
|
|
|
|
|
|
| 17-Feb-09 |
97 |
|
|
|
|
|
|
|
|
|
|
|
|
|
|
|
|
|
|
| 18-Feb-09 |
91 |
|
|
|
|
|
|
|
|
|
|
|
|
|
|
|
|
|
|
| 19-Feb-09 |
94 |
|
|
|
|
|
|
|
|
|
|
|
|
|
|
|
|
|
|
| 20-Feb-09 |
92 |
|
|
|
|
|
|
|
|
|
|
|
|
|
|
|
|
|
|
| 21-Feb-09 |
96 |
|
|
|
|
|
|
|
|
|
|
|
|
|
|
|
|
|
|
| 22-Feb-09 |
114 |
|
|
|
|
|
|
|
|
|
|
|
|
|
|
|
|
|
|
| 23-Feb-09 |
114 |
|
|
|
|
|
|
|
|
|
|
|
|
|
|
|
|
|
|
| 24-Feb-09 |
120 |
|
|
|
|
|
|
|
|
|
|
|
|
|
|
|
|
|
|
| 25-Feb-09 |
135 |
|
|
|
|
|
|
|
|
|
|
|
|
|
|
|
|
|
|
| 26-Feb-09 |
127 |
|
|
|
|
|
|
|
|
|
|
|
|
|
|
|
|
|
|
| 27-Feb-09 |
127 |
|
|
|
|
|
|
|
|
|
|
|
|
|
|
|
|
|
|
| 28-Feb-09 |
135 |
|
|
|
|
|
|
|
|
|
|
|
|
|
|
|
|
|
|
| 1-Mar-09 |
128 |
|
|
|
|
|
|
|
|
|
|
|
|
|
|
|
|
|
|
| 2-Mar-09 |
124 |
|
|
|
|
|
|
|
|
|
|
|
|
|
|
|
|
|
|
| 3-Mar-09 |
126 |
|
|
|
|
|
|
|
|
|
|
|
|
|
|
|
|
|
|
| 4-Mar-09 |
121 |
|
|
|
|
|
|
|
|
|
|
|
|
|
|
|
|
|
|
| 5-Mar-09 |
115 |
|
|
|
|
|
|
|
|
|
|
|
|
|
|
|
|
|
|
| 6-Mar-09 |
105 |
|
|
|
|
|
|
|
|
|
|
|
|
|
|
|
|
|
|
| 7-Mar-09 |
115 |
|
|
|
|
|
|
|
|
|
|
|
|
|
|
|
|
|
|
| 8-Mar-09 |
112 |
|
|
|
|
|
|
|
|
|
|
|
|
|
|
|
|
|
|
| 9-Mar-09 |
95 |
|
|
|
|
|
|
|
|
|
|
|
|
|
|
|
|
|
|
| 10-Mar-09 |
86 |
|
|
|
|
|
|
|
|
|
|
|
|
|
|
|
|
|
|
| 11-Mar-09 |
70 |
|
|
|
|
|
|
|
|
|
|
|
|
|
|
|
|
|
|
| 12-Mar-09 |
61 |
|
|
|
|
|
|
|
|
|
|
|
|
|
|
|
|
|
|
| 13-Mar-09 |
58 |
|
|
|
|
|
|
|
|
|
|
|
|
|
|
|
|
|
|
| 14-Mar-09 |
70 |
|
|
|
|
|
|
|
|
|
|
|
|
|
|
|
|
|
|
| 15-Mar-09 |
66 |
|
|
|
|
|
|
|
|
|
|
|
|
|
|
|
|
|
|
| 16-Mar-09 |
86 |
|
|
|
|
|
|
|
|
|
|
|
|
|
|
|
|
|
|
| 17-Mar-09 |
95 |
|
|
|
|
|
|
|
|
|
|
|
|
|
|
|
|
|
|
| 18-Mar-09 |
91 |
|
|
|
|
|
|
|
|
|
|
|
|
|
|
|
|
|
|
| 19-Mar-09 |
104 |
|
|
|
|
|
|
|
|
|
|
|
|
|
|
|
|
|
|
| 20-Mar-09 |
106 |
|
|
|
|
|
|
|
|
|
|
|
|
|
|
|
|
|
|
| 21-Mar-09 |
104 |
|
|
|
|
|
|
|
|
|
|
|
|
|
|
|
|
|
|
| 22-Mar-09 |
113 |
|
|
|
|
|
|
|
|
|
|
|
|
|
|
|
|
|
|
| 23-Mar-09 |
106 |
|
|
|
|
|
|
|
|
|
|
|
|
|
|
|
|
|
|
| 24-Mar-09 |
140 |
|
|
|
|
|
|
|
|
|
|
|
|
|
|
|
|
|
|
| 25-Mar-09 |
131 |
|
|
|
|
|
|
|
|
|
|
|
|
|
|
|
|
|
|
| 26-Mar-09 |
129 |
|
|
|
|
|
|
|
|
|
|
|
|
|
|
|
|
|
|
| 27-Mar-09 |
154 |
|
|
|
|
|
|
|
|
|
|
|
|
|
|
|
|
|
|
| 28-Mar-09 |
141 |
|
|
|
|
|
|
|
|
|
|
|
|
|
|
|
|
|
|
| 29-Mar-09 |
152 |
|
|
|
|
|
|
|
|
|
|
|
|
|
|
|
|
|
|
| 30-Mar-09 |
164 |
|
|
|
|
|
|
|
|
|
|
|
|
|
|
|
|
|
|
| 31-Mar-09 |
159 |
|
|
|
|
|
|
|
|
|
|
|
|
|
|
|
|
|
|
| 1-Apr-09 |
134 |
|
|
|
|
|
|
|
|
|
|
|
|
|
|
|
|
|
|
| 2-Apr-09 |
132 |
|
|
|
|
|
|
|
|
|
|
|
|
|
|
|
|
|
|
| 3-Apr-09 |
137 |
|
|
|
|
|
|
|
|
|
|
|
|
|
|
|
|
|
|
| 4-Apr-09 |
134 |
|
|
|
|
|
|
|
|
|
|
|
|
|
|
|
|
|
|
| 5-Apr-09 |
141 |
|
|
|
|
|
|
|
|
|
|
|
|
|
|
|
|
|
|
| 6-Apr-09 |
147 |
|
|
|
|
|
|
|
|
|
|
|
|
|
|
|
|
|
|
| 7-Apr-09 |
162 |
|
|
|
|
|
|
|
|
|
|
|
|
|
|
|
|
|
|
| 8-Apr-09 |
166 |
|
|
|
|
|
|
|
|
|
|
|
|
|
|
|
|
|
|
| 9-Apr-09 |
163 |
|
|
|
|
|
|
|
|
|
|
|
|
|
|
|
|
|
|
| 10-Apr-09 |
161 |
|
|
|
|
|
|
|
|
|
|
|
|
|
|
|
|
|
|
| 11-Apr-09 |
155 |
|
|
|
|
|
|
|
|
|
|
|
|
|
|
|
|
|
|
| 12-Apr-09 |
154 |
|
|
|
|
|
|
|
|
|
|
|
|
|
|
|
|
|
|
| 13-Apr-09 |
165 |
|
|
|
|
|
|
|
|
|
|
|
|
|
|
|
|
|
|
| 14-Apr-09 |
159 |
|
|
|
|
|
|
|
|
|
|
|
|
|
|
|
|
|
|
| 15-Apr-09 |
153 |
|
|
|
|
|
|
|
|
|
|
|
|
|
|
|
|
|
|
| 16-Apr-09 |
157 |
|
|
|
|
|
|
|
|
|
|
|
|
|
|
|
|
|
|
| 17-Apr-09 |
160 |
|
|
|
|
|
|
|
|
|
|
|
|
|
|
|
|
|
|
| 18-Apr-09 |
175 |
|
|
|
|
|
|
|
|
|
|
|
|
|
|
|
|
|
|
| 19-Apr-09 |
181 |
|
|
|
|
|
|
|
|
|
|
|
|
|
|
|
|
|
|
| 20-Apr-09 |
198 |
|
|
|
|
|
|
|
|
|
|
|
|
|
|
|
|
|
|
| 21-Apr-09 |
210 |
|
|
|
|
|
|
|
|
|
|
|
|
|
|
|
|
|
|
| 22-Apr-09 |
216 |
|
|
|
|
|
|
|
|
|
|
|
|
|
|
|
|
|
|
| 23-Apr-09 |
217 |
|
|
|
|
|
|
|
|
|
|
|
|
|
|
|
|
|
|
| 24-Apr-09 |
220 |
|
|
|
|
|
|
|
|
|
|
|
|
|
|
|
|
|
|
| 25-Apr-09 |
242 |
|
|
|
|
|
|
|
|
|
|
|
|
|
|
|
|
|
|
| 26-Apr-09 |
238 |
|
|
|
|
|
|
|
|
|
|
|
|
|
|
|
|
|
|
| 27-Apr-09 |
242 |
|
|
|
|
|
|
|
|
|
|
|
|
|
|
|
|
|
|
| 28-Apr-09 |
233 |
|
|
|
|
|
|
|
|
|
|
|
|
|
|
|
|
|
|
| 29-Apr-09 |
215 |
|
|
|
|
|
|
|
|
|
|
|
|
|
|
|
|
|
|
| 30-Apr-09 |
228 |
|
|
|
|
|
|
|
|
|
|
|
|
|
|
|
|
|
|
| 1-May-09 |
227 |
|
|
|
|
|
|
|
|
|
|
|
|
|
|
|
|
|
|
| 2-May-09 |
228 |
|
|
|
|
|
|
|
|
|
|
|
|
|
|
|
|
|
|
| 3-May-09 |
228 |
|
|
|
|
|
|
|
|
|
|
|
|
|
|
|
|
|
|
| 4-May-09 |
218 |
|
|
|
|
|
|
|
|
|
|
|
|
|
|
|
|
|
|
| 5-May-09 |
217 |
|
|
|
|
|
|
|
|
|
|
|
|
|
|
|
|
|
|
| 6-May-09 |
220 |
|
|
|
|
|
|
|
|
|
|
|
|
|
|
|
|
|
|
| 7-May-09 |
230 |
|
|
|
|
|
|
|
|
|
|
|
|
|
|
|
|
|
|
| 8-May-09 |
231 |
|
|
|
|
|
|
|
|
|
|
|
|
|
|
|
|
|
|
| 9-May-09 |
258 |
|
|
|
|
|
|
|
|
|
|
|
|
|
|
|
|
|
|
| 10-May-09 |
270 |
|
|
|
|
|
|
|
|
|
|
|
|
|
|
|
|
|
|
| 11-May-09 |
273 |
|
|
|
|
|
|
|
|
|
|
|
|
|
|
|
|
|
|
| 12-May-09 |
255 |
|
|
|
|
|
|
|
|
|
|
|
|
|
|
|
|
|
|
| 13-May-09 |
256 |
|
|
|
|
|
|
|
|
|
|
|
|
|
|
|
|
|
|
| 14-May-09 |
196 |
|
|
|
|
|
|
|
|
|
|
|
|
|
|
|
|
|
|
| 15-May-09 |
201 |
|
|
|
|
|
|
|
|
|
|
|
|
|
|
|
|
|
|
| 16-May-09 |
207 |
|
|
|
|
|
|
|
|
|
|
|
|
|
|
|
|
|
|
| 17-May-09 |
208 |
|
|
|
|
|
|
|
|
|
|
|
|
|
|
|
|
|
|
| 18-May-09 |
269 |
|
|
|
|
|
|
|
|
|
|
|
|
|
|
|
|
|
|
| 19-May-09 |
259 |
|
|
|
|
|
|
|
|
|
|
|
|
|
|
|
|
|
|
| 20-May-09 |
279 |
|
|
|
|
|
|
|
|
|
|
|
|
|
|
|
|
|
|
| 21-May-09 |
287 |
|
|
|
|
|
|
|
|
|
|
|
|
|
|
|
|
|
|
| 22-May-09 |
292 |
|
|
|
|
|
|
|
|
|
|
|
|
|
|
|
|
|
|
| 23-May-09 |
295 |
|
|
|
|
|
|
|
|
|
|
|
|
|
|
|
|
|
|
| 24-May-09 |
289 |
|
|
|
|
|
|
|
|
|
|
|
|
|
|
|
|
|
|
| 25-May-09 |
242 |
|
|
|
|
|
|
|
|
|
|
|
|
|
|
|
|
|
|
| 26-May-09 |
220 |
|
|
|
|
|
|
|
|
|
|
|
|
|
|
|
|
|
|
| 27-May-09 |
227 |
|
|
|
|
|
|
|
|
|
|
|
|
|
|
|
|
|
|
| 28-May-09 |
218 |
|
|
|
|
|
|
|
|
|
|
|
|
|
|
|
|
|
|
| 29-May-09 |
224 |
|
|
|
|
|
|
|
|
|
|
|
|
|
|
|
|
|
|
| 30-May-09 |
210 |
|
|
|
|
|
|
|
|
|
|
|
|
|
|
|
|
|
|
| 31-May-09 |
194 |
|
|
|
|
|
|
|
|
|
|
|
|
|
|
|
|
|
|
| 1-Jun-09 |
195 |
|
|
|
|
|
|
|
|
|
|
|
|
|
|
|
|
|
|
| 2-Jun-09 |
195 |
|
|
|
|
|
|
|
|
|
|
|
|
|
|
|
|
|
|
| 3-Jun-09 |
203 |
|
|
|
|
|
|
|
|
|
|
|
|
|
|
|
|
|
|
| 4-Jun-09 |
196 |
|
|
|
|
|
|
|
|
|
|
|
|
|
|
|
|
|
|
| 5-Jun-09 |
204 |
|
|
|
|
|
|
|
|
|
|
|
|
|
|
|
|
|
|
| 6-Jun-09 |
203 |
|
|
|
|
|
|
|
|
|
|
|
|
|
|
|
|
|
|
| 7-Jun-09 |
201 |
|
|
|
|
|
|
|
|
|
|
|
|
|
|
|
|
|
|
| 8-Jun-09 |
219 |
|
|
|
|
|
|
|
|
|
|
|
|
|
|
|
|
|
|
| 9-Jun-09 |
216 |
|
|
|
|
|
|
|
|
|
|
|
|
|
|
|
|
|
|
| 10-Jun-09 |
228 |
|
|
|
|
|
|
|
|
|
|
|
|
|
|
|
|
|
|
| 11-Jun-09 |
245 |
|
|
|
|
|
|
|
|
|
|
|
|
|
|
|
|
|
|
| 12-Jun-09 |
236 |
|
|
|
|
|
|
|
|
|
|
|
|
|
|
|
|
|
|
| 13-Jun-09 |
231 |
|
|
|
|
|
|
|
|
|
|
|
|
|
|
|
|
|
|
| 14-Jun-09 |
233 |
|
|
|
|
|
|
|
|
|
|
|
|
|
|
|
|
|
|
| 15-Jun-09 |
225 |
|
|
|
|
|
|
|
|
|
|
|
|
|
|
|
|
|
|
| 16-Jun-09 |
220 |
|
|
|
|
|
|
|
|
|
|
|
|
|
|
|
|
|
|
| 17-Jun-09 |
224 |
|
|
|
|
|
|
|
|
|
|
|
|
|
|
|
|
|
|
| 18-Jun-09 |
214 |
|
|
|
|
|
|
|
|
|
|
|
|
|
|
|
|
|
|
| 19-Jun-09 |
228 |
|
|
|
|
|
|
|
|
|
|
|
|
|
|
|
|
|
|
| 20-Jun-09 |
235 |
|
|
|
|
|
|
|
|
|
|
|
|
|
|
|
|
|
|
| 21-Jun-09 |
244 |
|
|
|
|
|
|
|
|
|
|
|
|
|
|
|
|
|
|
| 22-Jun-09 |
242 |
|
|
|
|
|
|
|
|
|
|
|
|
|
|
|
|
|
|
| 23-Jun-09 |
220 |
|
|
|
|
|
|
|
|
|
|
|
|
|
|
|
|
|
|
| 24-Jun-09 |
211 |
|
|
|
|
|
|
|
|
|
|
|
|
|
|
|
|
|
|
| 25-Jun-09 |
195 |
|
|
|
|
|
|
|
|
|
|
|
|
|
|
|
|
|
|
| 26-Jun-09 |
208 |
|
|
|
|
|
|
|
|
|
|
|
|
|
|
|
|
|
|
| 27-Jun-09 |
229 |
|
|
|
|
|
|
|
|
|
|
|
|
|
|
|
|
|
|
| 28-Jun-09 |
256 |
|
|
|
|
|
|
|
|
|
|
|
|
|
|
|
|
|
|
| 29-Jun-09 |
258 |
|
|
|
|
|
|
|
|
|
|
|
|
|
|
|
|
|
|
| 30-Jun-09 |
263 |
|
|
|
|
|
|
|
|
|
|
|
|
|
|
|
|
|
|
| 1-Jul-09 |
267 |
|
|
|
|
|
|
|
|
|
|
|
|
|
|
|
|
|
|
| 2-Jul-09 |
260 |
|
|
|
|
|
|
|
|
|
|
|
|
|
|
|
|
|
|
| 3-Jul-09 |
267 |
|
|
|
|
|
|
|
|
|
|
|
|
|
|
|
|
|
|
| 4-Jul-09 |
250 |
|
|
|
|
|
|
|
|
|
|
|
|
|
|
|
|
|
|
| 5-Jul-09 |
238 |
|
|
|
|
|
|
|
|
|
|
|
|
|
|
|
|
|
|
| 6-Jul-09 |
236 |
|
|
|
|
|
|
|
|
|
|
|
|
|
|
|
|
|
|
| 7-Jul-09 |
226 |
|
|
|
|
|
|
|
|
|
|
|
|
|
|
|
|
|
|
| 8-Jul-09 |
239 |
|
|
|
|
|
|
|
|
|
|
|
|
|
|
|
|
|
|
| 9-Jul-09 |
249 |
|
|
|
|
|
|
|
|
|
|
|
|
|
|
|
|
|
|
| 10-Jul-09 |
237 |
|
|
|
|
|
|
|
|
|
|
|
|
|
|
|
|
|
|
| 11-Jul-09 |
233 |
|
|
|
|
|
|
|
|
|
|
|
|
|
|
|
|
|
|
| 12-Jul-09 |
208 |
|
|
|
|
|
|
|
|
|
|
|
|
|
|
|
|
|
|
| 13-Jul-09 |
245 |
|
|
|
|
|
|
|
|
|
|
|
|
|
|
|
|
|
|
| 14-Jul-09 |
265 |
|
|
|
|
|
|
|
|
|
|
|
|
|
|
|
|
|
|
| 15-Jul-09 |
261 |
|
|
|
|
|
|
|
|
|
|
|
|
|
|
|
|
|
|
| 16-Jul-09 |
268 |
|
|
|
|
|
|
|
|
|
|
|
|
|
|
|
|
|
|
| 17-Jul-09 |
226 |
|
|
|
|
|
|
|
|
|
|
|
|
|
|
|
|
|
|
| 18-Jul-09 |
189 |
|
|
|
|
|
|
|
|
|
|
|
|
|
|
|
|
|
|
| 19-Jul-09 |
171 |
|
|
|
|
|
|
|
|
|
|
|
|
|
|
|
|
|
|
| 20-Jul-09 |
168 |
|
|
|
|
|
|
|
|
|
|
|
|
|
|
|
|
|
|
| 21-Jul-09 |
158 |
|
|
|
|
|
|
|
|
|
|
|
|
|
|
|
|
|
|
| 22-Jul-09 |
156 |
|
|
|
|
|
|
|
|
|
|
|
|
|
|
|
|
|
|
| 23-Jul-09 |
125 |
|
|
|
|
|
|
|
|
|
|
|
|
|
|
|
|
|
|
| 24-Jul-09 |
107 |
|
|
|
|
|
|
|
|
|
|
|
|
|
|
|
|
|
|
| 25-Jul-09 |
109 |
|
|
|
|
|
|
|
|
|
|
|
|
|
|
|
|
|
|
| 26-Jul-09 |
145 |
|
|
|
|
|
|
|
|
|
|
|
|
|
|
|
|
|
|
| 27-Jul-09 |
174 |
|
|
|
|
|
|
|
|
|
|
|
|
|
|
|
|
|
|
| 28-Jul-09 |
190 |
|
|
|
|
|
|
|
|
|
|
|
|
|
|
|
|
|
|
| 29-Jul-09 |
204 |
|
|
|
|
|
|
|
|
|
|
|
|
|
|
|
|
|
|
| 30-Jul-09 |
178 |
|
|
|
|
|
|
|
|
|
|
|
|
|
|
|
|
|
|
| 31-Jul-09 |
174 |
|
|
|
|
|
|
|
|
|
|
|
|
|
|
|
|
|
|
| 1-Aug-09 |
170 |
|
|
|
|
|
|
|
|
|
|
|
|
|
|
|
|
|
|
| 2-Aug-09 |
147 |
|
|
|
|
|
|
|
|
|
|
|
|
|
|
|
|
|
|
| 3-Aug-09 |
153 |
|
|
|
|
|
|
|
|
|
|
|
|
|
|
|
|
|
|
| 4-Aug-09 |
149 |
|
|
|
|
|
|
|
|
|
|
|
|
|
|
|
|
|
|
| 5-Aug-09 |
148 |
|
|
|
|
|
|
|
|
|
|
|
|
|
|
|
|
|
|
| 6-Aug-09 |
152 |
|
|
|
|
|
|
|
|
|
|
|
|
|
|
|
|
|
|
| 7-Aug-09 |
138 |
|
|
|
|
|
|
|
|
|
|
|
|
|
|
|
|
|
|
| 8-Aug-09 |
145 |
|
|
|
|
|
|
|
|
|
|
|
|
|
|
|
|
|
|
| 9-Aug-09 |
154 |
|
|
|
|
|
|
|
|
|
|
|
|
|
|
|
|
|
|
| 10-Aug-09 |
154 |
|
|
|
|
|
|
|
|
|
|
|
|
|
|
|
|
|
|
| 11-Aug-09 |
151 |
|
|
|
|
|
|
|
|
|
|
|
|
|
|
|
|
|
|
| 12-Aug-09 |
138 |
|
|
|
|
|
|
|
|
|
|
|
|
|
|
|
|
|
|
| 13-Aug-09 |
135 |
|
|
|
|
|
|
|
|
|
|
|
|
|
|
|
|
|
|
| 14-Aug-09 |
153 |
|
|
|
|
|
|
|
|
|
|
|
|
|
|
|
|
|
|
| 15-Aug-09 |
199 |
|
|
|
|
|
|
|
|
|
|
|
|
|
|
|
|
|
|
| 16-Aug-09 |
188 |
|
|
|
|
|
|
|
|
|
|
|
|
|
|
|
|
|
|
| 17-Aug-09 |
180 |
|
|
|
|
|
|
|
|
|
|
|
|
|
|
|
|
|
|
| 18-Aug-09 |
179 |
|
|
|
|
|
|
|
|
|
|
|
|
|
|
|
|
|
|
| 19-Aug-09 |
173 |
|
|
|
|
|
|
|
|
|
|
|
|
|
|
|
|
|
|
| 20-Aug-09 |
164 |
|
|
|
|
|
|
|
|
|
|
|
|
|
|
|
|
|
|
| 21-Aug-09 |
156 |
|
|
|
|
|
|
|
|
|
|
|
|
|
|
|
|
|
|
| 22-Aug-09 |
147 |
|
|
|
|
|
|
|
|
|
|
|
|
|
|
|
|
|
|
| 23-Aug-09 |
134 |
|
|
|
|
|
|
|
|
|
|
|
|
|
|
|
|
|
|
| 24-Aug-09 |
142 |
|
|
|
|
|
|
|
|
|
|
|
|
|
|
|
|
|
|
| 25-Aug-09 |
152 |
|
|
|
|
|
|
|
|
|
|
|
|
|
|
|
|
|
|
| 26-Aug-09 |
144 |
|
|
|
|
|
|
|
|
|
|
|
|
|
|
|
|
|
|
| 27-Aug-09 |
145 |
|
|
|
|
|
|
|
|
|
|
|
|
|
|
|
|
|
|
| 28-Aug-09 |
145 |
|
|
|
|
|
|
|
|
|
|
|
|
|
|
|
|
|
|
| 29-Aug-09 |
150 |
|
|
|
|
|
|
|
|
|
|
|
|
|
|
|
|
|
|
| 30-Aug-09 |
155 |
|
|
|
|
|
|
|
|
|
|
|
|
|
|
|
|
|
|
| 31-Aug-09 |
146 |
|
|
|
|
|
|
|
|
|
|
|
|
|
|
|
|
|
|
| 1-Sep-09 |
133 |
|
|
|
|
|
|
|
|
|
|
|
|
|
|
|
|
|
|
| 2-Sep-09 |
107 |
|
|
|
|
|
|
|
|
|
|
|
|
|
|
|
|
|
|
| 3-Sep-09 |
115 |
|
|
|
|
|
|
|
|
|
|
|
|
|
|
|
|
|
|
| 4-Sep-09 |
130 |
|
|
|
|
|
|
|
|
|
|
|
|
|
|
|
|
|
|
| 5-Sep-09 |
136 |
|
|
|
|
|
|
|
|
|
|
|
|
|
|
|
|
|
|
| 6-Sep-09 |
156 |
|
|
|
|
|
|
|
|
|
|
|
|
|
|
|
|
|
|
| 7-Sep-09 |
153 |
|
|
|
|
|
|
|
|
|
|
|
|
|
|
|
|
|
|
| 8-Sep-09 |
144 |
|
|
|
|
|
|
|
|
|
|
|
|
|
|
|
|
|
|
| 9-Sep-09 |
146 |
|
|
|
|
|
|
|
|
|
|
|
|
|
|
|
|
|
|
| 10-Sep-09 |
141 |
|
|
|
|
|
|
|
|
|
|
|
|
|
|
|
|
|
|
| 11-Sep-09 |
131 |
|
|
|
|
|
|
|
|
|
|
|
|
|
|
|
|
|
|
| 12-Sep-09 |
124 |
|
|
|
|
|
|
|
|
|
|
|
|
|
|
|
|
|
|
| 13-Sep-09 |
125 |
|
|
|
|
|
|
|
|
|
|
|
|
|
|
|
|
|
|
| 14-Sep-09 |
111 |
|
|
|
|
|
|
|
|
|
|
|
|
|
|
|
|
|
|
| 15-Sep-09 |
112 |
|
|
|
|
|
|
|
|
|
|
|
|
|
|
|
|
|
|
| 16-Sep-09 |
93 |
|
|
|
|
|
|
|
|
|
|
|
|
|
|
|
|
|
|
| 17-Sep-09 |
97 |
|
|
|
|
|
|
|
|
|
|
|
|
|
|
|
|
|
|
| 18-Sep-09 |
86 |
|
|
|
|
|
|
|
|
|
|
|
|
|
|
|
|
|
|
| 19-Sep-09 |
91 |
|
|
|
|
|
|
|
|
|
|
|
|
|
|
|
|
|
|
| 20-Sep-09 |
107 |
|
|
|
|
|
|
|
|
|
|
|
|
|
|
|
|
|
|
| 21-Sep-09 |
118 |
|
|
|
|
|
|
|
|
|
|
|
|
|
|
|
|
|
|
| 22-Sep-09 |
142 |
|
|
|
|
|
|
|
|
|
|
|
|
|
|
|
|
|
|
| 23-Sep-09 |
141 |
|
|
|
|
|
|
|
|
|
|
|
|
|
|
|
|
|
|
| 24-Sep-09 |
139 |
|
|
|
|
|
|
|
|
|
|
|
|
|
|
|
|
|
|
| 25-Sep-09 |
142 |
|
|
|
|
|
|
|
|
|
|
|
|
|
|
|
|
|
|
| 26-Sep-09 |
144 |
|
|
|
|
|
|
|
|
|
|
|
|
|
|
|
|
|
|
| 27-Sep-09 |
143 |
|
|
|
|
|
|
|
|
|
|
|
|
|
|
|
|
|
|
| 28-Sep-09 |
149 |
|
|
|
|
|
|
|
|
|
|
|
|
|
|
|
|
|
|
| 29-Sep-09 |
144 |
|
|
|
|
|
|
|
|
|
|
|
|
|
|
|
|
|
|
| 30-Sep-09 |
138 |
|
|
|
|
|
|
|
|
|
|
|
|
|
|
|
|
|
|
| 1-Oct-09 |
140 |
|
|
|
|
|
|
|
|
|
|
|
|
|
|
|
|
|
|
| 2-Oct-09 |
132 |
|
|
|
|
|
|
|
|
|
|
|
|
|
|
|
|
|
|
| 3-Oct-09 |
141 |
|
|
|
|
|
|
|
|
|
|
|
|
|
|
|
|
|
|
| 4-Oct-09 |
137 |
|
|
|
|
|
|
|
|
|
|
|
|
|
|
|
|
|
|
| 5-Oct-09 |
126 |
|
|
|
|
|
|
|
|
|
|
|
|
|
|
|
|
|
|
| 6-Oct-09 |
132 |
|
|
|
|
|
|
|
|
|
|
|
|
|
|
|
|
|
|
| 7-Oct-09 |
125 |
|
|
|
|
|
|
|
|
|
|
|
|
|
|
|
|
|
|
| 8-Oct-09 |
133 |
|
|
|
|
|
|
|
|
|
|
|
|
|
|
|
|
|
|
| 9-Oct-09 |
137 |
|
|
|
|
|
|
|
|
|
|
|
|
|
|
|
|
|
|
| 10-Oct-09 |
135 |
|
|
|
|
|
|
|
|
|
|
|
|
|
|
|
|
|
|
| 11-Oct-09 |
118 |
|
|
|
|
|
|
|
|
|
|
|
|
|
|
|
|
|
|
| 12-Oct-09 |
111 |
|
|
|
|
|
|
|
|
|
|
|
|
|
|
|
|
|
|
| 13-Oct-09 |
112 |
|
|
|
|
|
|
|
|
|
|
|
|
|
|
|
|
|
|
| 14-Oct-09 |
103 |
|
|
|
|
|
|
|
|
|
|
|
|
|
|
|
|
|
|
| 15-Oct-09 |
110 |
|
|
|
|
|
|
|
|
|
|
|
|
|
|
|
|
|
|
| 16-Oct-09 |
106 |
|
|
|
|
|
|
|
|
|
|
|
|
|
|
|
|
|
|
| 17-Oct-09 |
107 |
|
|
|
|
|
|
|
|
|
|
|
|
|
|
|
|
|
|
| 18-Oct-09 |
107 |
|
|
|
|
|
|
|
|
|
|
|
|
|
|
|
|
|
|
| 19-Oct-09 |
113 |
|
|
|
|
|
|
|
|
|
|
|
|
|
|
|
|
|
|
| 20-Oct-09 |
106 |
|
|
|
|
|
|
|
|
|
|
|
|
|
|
|
|
|
|
| 21-Oct-09 |
111 |
|
|
|
|
|
|
|
|
|
|
|
|
|
|
|
|
|
|
| 22-Oct-09 |
114 |
|
|
|
|
|
|
|
|
|
|
|
|
|
|
|
|
|
|
| 23-Oct-09 |
106 |
|
|
|
|
|
|
|
|
|
|
|
|
|
|
|
|
|
|
| 24-Oct-09 |
99 |
|
|
|
|
|
|
|
|
|
|
|
|
|
|
|
|
|
|
| 25-Oct-09 |
95 |
|
|
|
|
|
|
|
|
|
|
|
|
|
|
|
|
|
|
| 26-Oct-09 |
103 |
|
|
|
|
|
|
|
|
|
|
|
|
|
|
|
|
|
|
| 27-Oct-09 |
108 |
|
|
|
|
|
|
|
|
|
|
|
|
|
|
|
|
|
|
| 28-Oct-09 |
123 |
|
|
|
|
|
|
|
|
|
|
|
|
|
|
|
|
|
|
| 29-Oct-09 |
122 |
|
|
|
|
|
|
|
|
|
|
|
|
|
|
|
|
|
|
| 30-Oct-09 |
119 |
|
|
|
|
|
|
|
|
|
|
|
|
|
|
|
|
|
|
| 31-Oct-09 |
117 |
|
|
|
|
|
|
|
|
|
|
|
|
|
|
|
|
|
|
| 1-Nov-09 |
104 |
|
|
|
|
|
|
|
|
|
|
|
|
|
|
|
|
|
|
| 2-Nov-09 |
99 |
|
|
|
|
|
|
|
|
|
|
|
|
|
|
|
|
|
|
| 3-Nov-09 |
89 |
|
|
|
|
|
|
|
|
|
|
|
|
|
|
|
|
|
|
| 4-Nov-09 |
83 |
|
|
|
|
|
|
|
|
|
|
|
|
|
|
|
|
|
|
| 5-Nov-09 |
85 |
|
|
|
|
|
|
|
|
|
|
|
|
|
|
|
|
|
|
| 6-Nov-09 |
76 |
|
|
|
|
|
|
|
|
|
|
|
|
|
|
|
|
|
|
| 7-Nov-09 |
73 |
|
|
|
|
|
|
|
|
|
|
|
|
|
|
|
|
|
|
| 8-Nov-09 |
78 |
|
|
|
|
|
|
|
|
|
|
|
|
|
|
|
|
|
|
| 9-Nov-09 |
72 |
|
|
|
|
|
|
|
|
|
|
|
|
|
|
|
|
|
|
| 10-Nov-09 |
76 |
|
|
|
|
|
|
|
|
|
|
|
|
|
|
|
|
|
|
| 11-Nov-09 |
87 |
|
|
|
|
|
|
|
|
|
|
|
|
|
|
|
|
|
|
| 12-Nov-09 |
89 |
|
|
|
|
|
|
|
|
|
|
|
|
|
|
|
|
|
|
| 13-Nov-09 |
90 |
|
|
|
|
|
|
|
|
|
|
|
|
|
|
|
|
|
|
| 14-Nov-09 |
88 |
|
|
|
|
|
|
|
|
|
|
|
|
|
|
|
|
|
|
| 15-Nov-09 |
71 |
|
|
|
|
|
|
|
|
|
|
|
|
|
|
|
|
|
|
| 16-Nov-09 |
61 |
|
|
|
|
|
|
|
|
|
|
|
|
|
|
|
|
|
|
| 17-Nov-09 |
69 |
|
|
|
|
|
|
|
|
|
|
|
|
|
|
|
|
|
|
| 18-Nov-09 |
72 |
|
|
|
|
|
|
|
|
|
|
|
|
|
|
|
|
|
|
| 19-Nov-09 |
90 |
|
|
|
|
|
|
|
|
|
|
|
|
|
|
|
|
|
|
| 20-Nov-09 |
90 |
|
|
|
|
|
|
|
|
|
|
|
|
|
|
|
|
|
|
| 21-Nov-09 |
92 |
|
|
|
|
|
|
|
|
|
|
|
|
|
|
|
|
|
|
| 22-Nov-09 |
93 |
|
|
|
|
|
|
|
|
|
|
|
|
|
|
|
|
|
|
| 23-Nov-09 |
95 |
|
|
|
|
|
|
|
|
|
|
|
|
|
|
|
|
|
|
| 24-Nov-09 |
83 |
|
|
|
|
|
|
|
|
|
|
|
|
|
|
|
|
|
|
| 25-Nov-09 |
85 |
|
|
|
|
|
|
|
|
|
|
|
|
|
|
|
|
|
|
| 26-Nov-09 |
90 |
|
|
|
|
|
|
|
|
|
|
|
|
|
|
|
|
|
|
| 27-Nov-09 |
77 |
|
|
|
|
|
|
|
|
|
|
|
|
|
|
|
|
|
|
| 28-Nov-09 |
67 |
|
|
|
|
|
|
|
|
|
|
|
|
|
|
|
|
|
|
| 29-Nov-09 |
68 |
|
|
|
|
|
|
|
|
|
|
|
|
|
|
|
|
|
|
| 30-Nov-09 |
68 |
|
|
|
|
|
|
|
|
|
|
|
|
|
|
|
|
|
|
| 1-Dec-09 |
67 |
|
|
|
|
|
|
|
|
|
|
|
|
|
|
|
|
|
|
| 2-Dec-09 |
75 |
|
|
|
|
|
|
|
|
|
|
|
|
|
|
|
|
|
|
| 3-Dec-09 |
79 |
|
|
|
|
|
|
|
|
|
|
|
|
|
|
|
|
|
|
| 4-Dec-09 |
90 |
|
|
|
|
|
|
|
|
|
|
|
|
|
|
|
|
|
|
| 5-Dec-09 |
81 |
|
|
|
|
|
|
|
|
|
|
|
|
|
|
|
|
|
|
| 6-Dec-09 |
86 |
|
|
|
|
|
|
|
|
|
|
|
|
|
|
|
|
|
|
| 7-Dec-09 |
84 |
|
|
|
|
|
|
|
|
|
|
|
|
|
|
|
|
|
|
| 8-Dec-09 |
82 |
|
|
|
|
|
|
|
|
|
|
|
|
|
|
|
|
|
|
| 9-Dec-09 |
82 |
|
|
|
|
|
|
|
|
|
|
|
|
|
|
|
|
|
|
| 10-Dec-09 |
87 |
|
|
|
|
|
|
|
|
|
|
|
|
|
|
|
|
|
|
| 11-Dec-09 |
94 |
|
|
|
|
|
|
|
|
|
|
|
|
|
|
|
|
|
|
| 12-Dec-09 |
97 |
|
|
|
|
|
|
|
|
|
|
|
|
|
|
|
|
|
|
| 13-Dec-09 |
100 |
|
|
|
|
|
|
|
|
|
|
|
|
|
|
|
|
|
|
| 14-Dec-09 |
91 |
|
|
|
|
|
|
|
|
|
|
|
|
|
|
|
|
|
|
| 15-Dec-09 |
93 |
|
|
|
|
|
|
|
|
|
|
|
|
|
|
|
|
|
|
| 16-Dec-09 |
95 |
|
|
|
|
|
|
|
|
|
|
|
|
|
|
|
|
|
|
| 17-Dec-09 |
102 |
|
|
|
|
|
|
|
|
|
|
|
|
|
|
|
|
|
|
| 18-Dec-09 |
108 |
|
|
|
|
|
|
|
|
|
|
|
|
|
|
|
|
|
|
| 19-Dec-09 |
130 |
|
|
|
|
|
|
|
|
|
|
|
|
|
|
|
|
|
|
| 20-Dec-09 |
147 |
|
|
|
|
|
|
|
|
|
|
|
|
|
|
|
|
|
|
| 21-Dec-09 |
132 |
|
|
|
|
|
|
|
|
|
|
|
|
|
|
|
|
|
|
| 22-Dec-09 |
116 |
|
|
|
|
|
|
|
|
|
|
|
|
|
|
|
|
|
|
| 23-Dec-09 |
98 |
|
|
|
|
|
|
|
|
|
|
|
|
|
|
|
|
|
|
| 24-Dec-09 |
87 |
|
|
|
|
|
|
|
|
|
|
|
|
|
|
|
|
|
|
| 25-Dec-09 |
107 |
|
|
|
|
|
|
|
|
|
|
|
|
|
|
|
|
|
|
| 26-Dec-09 |
125 |
|
|
|
|
|
|
|
|
|
|
|
|
|
|
|
|
|
|
| 27-Dec-09 |
130 |
|
|
|
|
|
|
|
|
|
|
|
|
|
|
|
|
|
|
| 28-Dec-09 |
127 |
|
|
|
|
|
|
|
|
|
|
|
|
|
|
|
|
|
|
| 29-Dec-09 |
121 |
|
|
|
|
|
|
|
|
|
|
|
|
|
|
|
|
|
|
| 30-Dec-09 |
106 |
|
|
|
|
|
|
|
|
|
|
|
|
|
|
|
|
|
|
| 31-Dec-09 |
98 |
|
|
|
|
|
|
|
|
|
|
|
|
|
|
|
|
|
|
| 1-Jan-10 |
89 |
|
|
|
|
|
|
|
|
|
|
|
|
|
|
|
|
|
|
| 2-Jan-10 |
105 |
|
|
|
|
|
|
|
|
|
|
|
|
|
|
|
|
|
|
| 3-Jan-10 |
114 |
|
|
|
|
|
|
|
|
|
|
|
|
|
|
|
|
|
|
| 4-Jan-10 |
133 |
|
|
|
|
|
|
|
|
|
|
|
|
|
|
|
|
|
|
| 5-Jan-10 |
145 |
|
|
|
|
|
|
|
|
|
|
|
|
|
|
|
|
|
|
| 6-Jan-10 |
143 |
|
|
|
|
|
|
|
|
|
|
|
|
|
|
|
|
|
|
| 7-Jan-10 |
141 |
|
|
|
|
|
|
|
|
|
|
|
|
|
|
|
|
|
|
| 8-Jan-10 |
140 |
|
|
|
|
|
|
|
|
|
|
|
|
|
|
|
|
|
|
| 9-Jan-10 |
141 |
|
|
|
|
|
|
|
|
|
|
|
|
|
|
|
|
|
|
| 10-Jan-10 |
137 |
|
|
|
|
|
|
|
|
|
|
|
|
|
|
|
|
|
|
| 11-Jan-10 |
70 |
|
|
|
|
|
|
|
|
|
|
|
|
|
|
|
|
|
|
| 12-Jan-10 |
13 |
|
|
|
|
|
|
|
|
|
|
|
|
|
|
|
|
|
|
| 13-Jan-10 |
4 |
|
|
|
|
|
|
|
|
|
|
|
|
|
|
|
|
|
|
| 14-Jan-10 |
4 |
|
|
|
|
|
|
|
|
|
|
|
|
|
|
|
|
|
|
| 15-Jan-10 |
24 |
|
|
|
|
|
|
|
|
|
|
|
|
|
|
|
|
|
|
| 16-Jan-10 |
73 |
|
|
|
|
|
|
|
|
|
|
|
|
|
|
|
|
|
|
| 17-Jan-10 |
97 |
|
|
|
|
|
|
|
|
|
|
|
|
|
|
|
|
|
|
| 18-Jan-10 |
96 |
|
|
|
|
|
|
|
|
|
|
|
|
|
|
|
|
|
|
| 19-Jan-10 |
98 |
|
|
|
|
|
|
|
|
|
|
|
|
|
|
|
|
|
|
| 20-Jan-10 |
98 |
|
|
|
|
|
|
|
|
|
|
|
|
|
|
|
|
|
|
| 21-Jan-10 |
100 |
|
|
|
|
|
|
|
|
|
|
|
|
|
|
|
|
|
|
| 22-Jan-10 |
100 |
|
|
|
|
|
|
|
|
|
|
|
|
|
|
|
|
|
|
| 23-Jan-10 |
103 |
|
|
|
|
|
|
|
|
|
|
|
|
|
|
|
|
|
|
| 24-Jan-10 |
101 |
|
|
|
|
|
|
|
|
|
|
|
|
|
|
|
|
|
|
| 25-Jan-10 |
99 |
|
|
|
|
|
|
|
|
|
|
|
|
|
|
|
|
|
|
| 26-Jan-10 |
101 |
|
|
|
|
|
|
|
|
|
|
|
|
|
|
|
|
|
|
| 27-Jan-10 |
101 |
|
|
|
|
|
|
|
|
|
|
|
|
|
|
|
|
|
|
| 28-Jan-10 |
106 |
|
|
|
|
|
|
|
|
|
|
|
|
|
|
|
|
|
|
| 29-Jan-10 |
124 |
|
|
|
|
|
|
|
|
|
|
|
|
|
|
|
|
|
|
| 30-Jan-10 |
121 |
|
|
|
|
|
|
|
|
|
|
|
|
|
|
|
|
|
|
| 31-Jan-10 |
96 |
|
|
|
|
|
|
|
|
|
|
|
|
|
|
|
|
|
|
| 1-Feb-10 |
95 |
|
|
|
|
|
|
|
|
|
|
|
|
|
|
|
|
|
|
| 2-Feb-10 |
92 |
|
|
|
|
|
|
|
|
|
|
|
|
|
|
|
|
|
|
| 3-Feb-10 |
89 |
|
|
|
|
|
|
|
|
|
|
|
|
|
|
|
|
|
|
| 4-Feb-10 |
123 |
|
|
|
|
|
|
|
|
|
|
|
|
|
|
|
|
|
|
| 5-Feb-10 |
158 |
|
|
|
|
|
|
|
|
|
|
|
|
|
|
|
|
|
|
| 6-Feb-10 |
57 |
|
|
|
|
|
|
|
|
|
|
|
|
|
|
|
|
|
|
| 7-Feb-10 |
63 |
|
|
|
|
|
|
|
|
|
|
|
|
|
|
|
|
|
|
| 8-Feb-10 |
74 |
|
|
|
|
|
|
|
|
|
|
|
|
|
|
|
|
|
|
| 9-Feb-10 |
75 |
|
|
|
|
|
|
|
|
|
|
|
|
|
|
|
|
|
|
| 10-Feb-10 |
97 |
|
|
|
|
|
|
|
|
|
|
|
|
|
|
|
|
|
|
| 11-Feb-10 |
115 |
|
|
|
|
|
|
|
|
|
|
|
|
|
|
|
|
|
|
| 12-Feb-10 |
125 |
|
|
|
|
|
|
|
|
|
|
|
|
|
|
|
|
|
|
| 13-Feb-10 |
119 |
|
|
|
|
|
|
|
|
|
|
|
|
|
|
|
|
|
|
| 14-Feb-10 |
104 |
|
|
|
|
|
|
|
|
|
|
|
|
|
|
|
|
|
|
| 15-Feb-10 |
105 |
|
|
|
|
|
|
|
|
|
|
|
|
|
|
|
|
|
|
| 16-Feb-10 |
93 |
|
|
|
|
|
|
|
|
|
|
|
|
|
|
|
|
|
|
| 17-Feb-10 |
99 |
|
|
|
|
|
|
|
|
|
|
|
|
|
|
|
|
|
|
| 18-Feb-10 |
96 |
|
|
|
|
|
|
|
|
|
|
|
|
|
|
|
|
|
|
| 19-Feb-10 |
73 |
|
|
|
|
|
|
|
|
|
|
|
|
|
|
|
|
|
|
| 20-Feb-10 |
70 |
|
|
|
|
|
|
|
|
|
|
|
|
|
|
|
|
|
|
| 21-Feb-10 |
74 |
|
|
|
|
|
|
|
|
|
|
|
|
|
|
|
|
|
|
| 22-Feb-10 |
87 |
|
|
|
|
|
|
|
|
|
|
|
|
|
|
|
|
|
|
| 23-Feb-10 |
95 |
|
|
|
|
|
|
|
|
|
|
|
|
|
|
|
|
|
|
| 24-Feb-10 |
88 |
|
|
|
|
|
|
|
|
|
|
|
|
|
|
|
|
|
|
| 25-Feb-10 |
83 |
|
|
|
|
|
|
|
|
|
|
|
|
|
|
|
|
|
|
| 26-Feb-10 |
70 |
|
|
|
|
|
|
|
|
|
|
|
|
|
|
|
|
|
|
| 27-Feb-10 |
74 |
|
|
|
|
|
|
|
|
|
|
|
|
|
|
|
|
|
|
| 28-Feb-10 |
76 |
|
|
|
|
|
|
|
|
|
|
|
|
|
|
|
|
|
|
| 1-Mar-10 |
74 |
|
|
|
|
|
|
|
|
|
|
|
|
|
|
|
|
|
|
| 2-Mar-10 |
83 |
|
|
|
|
|
|
|
|
|
|
|
|
|
|
|
|
|
|
| 3-Mar-10 |
75 |
|
|
|
|
|
|
|
|
|
|
|
|
|
|
|
|
|
|
| 4-Mar-10 |
82 |
|
|
|
|
|
|
|
|
|
|
|
|
|
|
|
|
|
|
| 5-Mar-10 |
91 |
|
|
|
|
|
|
|
|
|
|
|
|
|
|
|
|
|
|
| 6-Mar-10 |
92 |
|
|
|
|
|
|
|
|
|
|
|
|
|
|
|
|
|
|
| 7-Mar-10 |
98 |
|
|
|
|
|
|
|
|
|
|
|
|
|
|
|
|
|
|
| 8-Mar-10 |
94 |
|
|
|
|
|
|
|
|
|
|
|
|
|
|
|
|
|
|
| 9-Mar-10 |
87 |
|
|
|
|
|
|
|
|
|
|
|
|
|
|
|
|
|
|
| 10-Mar-10 |
81 |
|
|
|
|
|
|
|
|
|
|
|
|
|
|
|
|
|
|
| 11-Mar-10 |
80 |
|
|
|
|
|
|
|
|
|
|
|
|
|
|
|
|
|
|
| 12-Mar-10 |
74 |
|
|
|
|
|
|
|
|
|
|
|
|
|
|
|
|
|
|
| 13-Mar-10 |
75 |
|
|
|
|
|
|
|
|
|
|
|
|
|
|
|
|
|
|
| 14-Mar-10 |
82 |
|
|
|
|
|
|
|
|
|
|
|
|
|
|
|
|
|
|
| 15-Mar-10 |
104 |
|
|
|
|
|
|
|
|
|
|
|
|
|
|
|
|
|
|
| 16-Mar-10 |
121 |
|
|
|
|
|
|
|
|
|
|
|
|
|
|
|
|
|
|
| 17-Mar-10 |
126 |
|
|
|
|
|
|
|
|
|
|
|
|
|
|
|
|
|
|
| 18-Mar-10 |
126 |
|
|
|
|
|
|
|
|
|
|
|
|
|
|
|
|
|
|
| 19-Mar-10 |
112 |
|
|
|
|
|
|
|
|
|
|
|
|
|
|
|
|
|
|
| 20-Mar-10 |
110 |
|
|
|
|
|
|
|
|
|
|
|
|
|
|
|
|
|
|
| 21-Mar-10 |
116 |
|
|
|
|
|
|
|
|
|
|
|
|
|
|
|
|
|
|
| 22-Mar-10 |
120 |
|
|
|
|
|
|
|
|
|
|
|
|
|
|
|
|
|
|
| 23-Mar-10 |
122 |
|
|
|
|
|
|
|
|
|
|
|
|
|
|
|
|
|
|
| 24-Mar-10 |
123 |
|
|
|
|
|
|
|
|
|
|
|
|
|
|
|
|
|
|
| 25-Mar-10 |
105 |
|
|
|
|
|
|
|
|
|
|
|
|
|
|
|
|
|
|
| 26-Mar-10 |
95 |
|
|
|
|
|
|
|
|
|
|
|
|
|
|
|
|
|
|
| 27-Mar-10 |
104 |
|
|
|
|
|
|
|
|
|
|
|
|
|
|
|
|
|
|
| 28-Mar-10 |
129 |
|
|
|
|
|
|
|
|
|
|
|
|
|
|
|
|
|
|
| 29-Mar-10 |
146 |
|
|
|
|
|
|
|
|
|
|
|
|
|
|
|
|
|
|
| 30-Mar-10 |
125 |
|
|
|
|
|
|
|
|
|
|
|
|
|
|
|
|
|
|
| 31-Mar-10 |
129 |
|
|
|
|
|
|
|
|
|
|
|
|
|
|
|
|
|
|
| 1-Apr-10 |
118 |
|
|
|
|
|
|
|
|
|
|
|
|
|
|
|
|
|
|
| 2-Apr-10 |
112 |
|
|
|
|
|
|
|
|
|
|
|
|
|
|
|
|
|
|
| 3-Apr-10 |
124 |
|
|
|
|
|
|
|
|
|
|
|
|
|
|
|
|
|
|
| 4-Apr-10 |
111 |
|
|
|
|
|
|
|
|
|
|
|
|
|
|
|
|
|
|
| 5-Apr-10 |
109 |
|
|
|
|
|
|
|
|
|
|
|
|
|
|
|
|
|
|
| 6-Apr-10 |
119 |
|
|
|
|
|
|
|
|
|
|
|
|
|
|
|
|
|
|
| 7-Apr-10 |
128 |
|
|
|
|
|
|
|
|
|
|
|
|
|
|
|
|
|
|
| 8-Apr-10 |
136 |
|
|
|
|
|
|
|
|
|
|
|
|
|
|
|
|
|
|
| 9-Apr-10 |
139 |
|
|
|
|
|
|
|
|
|
|
|
|
|
|
|
|
|
|
| 10-Apr-10 |
144 |
|
|
|
|
|
|
|
|
|
|
|
|
|
|
|
|
|
|
| 11-Apr-10 |
139 |
|
|
|
|
|
|
|
|
|
|
|
|
|
|
|
|
|
|
| 12-Apr-10 |
144 |
|
|
|
|
|
|
|
|
|
|
|
|
|
|
|
|
|
|
| 13-Apr-10 |
150 |
|
|
|
|
|
|
|
|
|
|
|
|
|
|
|
|
|
|
| 14-Apr-10 |
159 |
|
|
|
|
|
|
|
|
|
|
|
|
|
|
|
|
|
|
| 15-Apr-10 |
166 |
|
|
|
|
|
|
|
|
|
|
|
|
|
|
|
|
|
|
| 16-Apr-10 |
166 |
|
|
|
|
|
|
|
|
|
|
|
|
|
|
|
|
|
|
| 17-Apr-10 |
154 |
|
|
|
|
|
|
|
|
|
|
|
|
|
|
|
|
|
|
| 18-Apr-10 |
153 |
|
|
|
|
|
|
|
|
|
|
|
|
|
|
|
|
|
|
| 19-Apr-10 |
155 |
|
|
|
|
|
|
|
|
|
|
|
|
|
|
|
|
|
|
| 20-Apr-10 |
180 |
|
|
|
|
|
|
|
|
|
|
|
|
|
|
|
|
|
|
| 21-Apr-10 |
194 |
|
|
|
|
|
|
|
|
|
|
|
|
|
|
|
|
|
|
| 22-Apr-10 |
182 |
|
|
|
|
|
|
|
|
|
|
|
|
|
|
|
|
|
|
| 23-Apr-10 |
177 |
|
|
|
|
|
|
|
|
|
|
|
|
|
|
|
|
|
|
| 24-Apr-10 |
174 |
|
|
|
|
|
|
|
|
|
|
|
|
|
|
|
|
|
|
| 25-Apr-10 |
172 |
|
|
|
|
|
|
|
|
|
|
|
|
|
|
|
|
|
|
| 26-Apr-10 |
199 |
|
|
|
|
|
|
|
|
|
|
|
|
|
|
|
|
|
|
| 27-Apr-10 |
216 |
|
|
|
|
|
|
|
|
|
|
|
|
|
|
|
|
|
|
| 28-Apr-10 |
229 |
|
|
|
|
|
|
|
|
|
|
|
|
|
|
|
|
|
|
| 29-Apr-10 |
218 |
|
|
|
|
|
|
|
|
|
|
|
|
|
|
|
|
|
|
| 30-Apr-10 |
222 |
|
|
|
|
|
|
|
|
|
|
|
|
|
|
|
|
|
|
| 1-May-10 |
229 |
|
|
|
|
|
|
|
|
|
|
|
|
|
|
|
|
|
|
| 2-May-10 |
226 |
|
|
|
|
|
|
|
|
|
|
|
|
|
|
|
|
|
|
| 3-May-10 |
255 |
|
|
|
|
|
|
|
|
|
|
|
|
|
|
|
|
|
|
| 4-May-10 |
252 |
|
|
|
|
|
|
|
|
|
|
|
|
|
|
|
|
|
|
| 5-May-10 |
188 |
|
|
|
|
|
|
|
|
|
|
|
|
|
|
|
|
|
|
| 6-May-10 |
175 |
|
|
|
|
|
|
|
|
|
|
|
|
|
|
|
|
|
|
| 7-May-10 |
170 |
|
|
|
|
|
|
|
|
|
|
|
|
|
|
|
|
|
|
| 8-May-10 |
161 |
|
|
|
|
|
|
|
|
|
|
|
|
|
|
|
|
|
|
| 9-May-10 |
219 |
|
|
|
|
|
|
|
|
|
|
|
|
|
|
|
|
|
|
| 10-May-10 |
233 |
|
|
|
|
|
|
|
|
|
|
|
|
|
|
|
|
|
|
| 11-May-10 |
220 |
|
|
|
|
|
|
|
|
|
|
|
|
|
|
|
|
|
|
| 12-May-10 |
243 |
|
|
|
|
|
|
|
|
|
|
|
|
|
|
|
|
|
|
| 13-May-10 |
225 |
|
|
|
|
|
|
|
|
|
|
|
|
|
|
|
|
|
|
| 14-May-10 |
204 |
|
|
|
|
|
|
|
|
|
|
|
|
|
|
|
|
|
|
| 15-May-10 |
224 |
|
|
|
|
|
|
|
|
|
|
|
|
|
|
|
|
|
|
| 16-May-10 |
242 |
|
|
|
|
|
|
|
|
|
|
|
|
|
|
|
|
|
|
| 17-May-10 |
251 |
|
|
|
|
|
|
|
|
|
|
|
|
|
|
|
|
|
|
| 18-May-10 |
267 |
|
|
|
|
|
|
|
|
|
|
|
|
|
|
|
|
|
|
| 19-May-10 |
248 |
|
|
|
|
|
|
|
|
|
|
|
|
|
|
|
|
|
|
| 20-May-10 |
228 |
|
|
|
|
|
|
|
|
|
|
|
|
|
|
|
|
|
|
| 21-May-10 |
237 |
|
|
|
|
|
|
|
|
|
|
|
|
|
|
|
|
|
|
| 22-May-10 |
245 |
|
|
|
|
|
|
|
|
|
|
|
|
|
|
|
|
|
|
| 23-May-10 |
259 |
|
|
|
|
|
|
|
|
|
|
|
|
|
|
|
|
|
|
| 24-May-10 |
261 |
|
|
|
|
|
|
|
|
|
|
|
|
|
|
|
|
|
|
| 25-May-10 |
264 |
|
|
|
|
|
|
|
|
|
|
|
|
|
|
|
|
|
|
| 26-May-10 |
255 |
|
|
|
|
|
|
|
|
|
|
|
|
|
|
|
|
|
|
| 27-May-10 |
251 |
|
|
|
|
|
|
|
|
|
|
|
|
|
|
|
|
|
|
| 28-May-10 |
232 |
|
|
|
|
|
|
|
|
|
|
|
|
|
|
|
|
|
|
| 29-May-10 |
225 |
|
|
|
|
|
|
|
|
|
|
|
|
|
|
|
|
|
|
| 30-May-10 |
231 |
|
|
|
|
|
|
|
|
|
|
|
|
|
|
|
|
|
|
| 31-May-10 |
234 |
|
|
|
|
|
|
|
|
|
|
|
|
|
|
|
|
|
|
| 1-Jun-10 |
254 |
|
|
|
|
|
|
|
|
|
|
|
|
|
|
|
|
|
|
| 2-Jun-10 |
261 |
|
|
|
|
|
|
|
|
|
|
|
|
|
|
|
|
|
|
| 3-Jun-10 |
255 |
|
|
|
|
|
|
|
|
|
|
|
|
|
|
|
|
|
|
| 4-Jun-10 |
252 |
|
|
|
|
|
|
|
|
|
|
|
|
|
|
|
|
|
|
| 5-Jun-10 |
239 |
|
|
|
|
|
|
|
|
|
|
|
|
|
|
|
|
|
|
| 6-Jun-10 |
220 |
|
|
|
|
|
|
|
|
|
|
|
|
|
|
|
|
|
|
| 7-Jun-10 |
224 |
|
|
|
|
|
|
|
|
|
|
|
|
|
|
|
|
|
|
| 8-Jun-10 |
226 |
|
|
|
|
|
|
|
|
|
|
|
|
|
|
|
|
|
|
| 9-Jun-10 |
221 |
|
|
|
|
|
|
|
|
|
|
|
|
|
|
|
|
|
|
| 10-Jun-10 |
219 |
|
|
|
|
|
|
|
|
|
|
|
|
|
|
|
|
|
|
| 11-Jun-10 |
223 |
|
|
|
|
|
|
|
|
|
|
|
|
|
|
|
|
|
|
| 12-Jun-10 |
219 |
|
|
|
|
|
|
|
|
|
|
|
|
|
|
|
|
|
|
| 13-Jun-10 |
232 |
|
|
|
|
|
|
|
|
|
|
|
|
|
|
|
|
|
|
| 14-Jun-10 |
251 |
|
|
|
|
|
|
|
|
|
|
|
|
|
|
|
|
|
|
| 15-Jun-10 |
218 |
|
|
|
|
|
|
|
|
|
|
|
|
|
|
|
|
|
|
| 16-Jun-10 |
228 |
|
|
|
|
|
|
|
|
|
|
|
|
|
|
|
|
|
|
| 17-Jun-10 |
231 |
|
|
|
|
|
|
|
|
|
|
|
|
|
|
|
|
|
|
| 18-Jun-10 |
218 |
|
|
|
|
|
|
|
|
|
|
|
|
|
|
|
|
|
|
| 19-Jun-10 |
237 |
|
|
|
|
|
|
|
|
|
|
|
|
|
|
|
|
|
|
| 20-Jun-10 |
217 |
|
|
|
|
|
|
|
|
|
|
|
|
|
|
|
|
|
|
| 21-Jun-10 |
223 |
|
|
|
|
|
|
|
|
|
|
|
|
|
|
|
|
|
|
| 22-Jun-10 |
226 |
|
|
|
|
|
|
|
|
|
|
|
|
|
|
|
|
|
|
| 23-Jun-10 |
216 |
|
|
|
|
|
|
|
|
|
|
|
|
|
|
|
|
|
|
| 24-Jun-10 |
227 |
|
|
|
|
|
|
|
|
|
|
|
|
|
|
|
|
|
|
| 25-Jun-10 |
211 |
|
|
|
|
|
|
|
|
|
|
|
|
|
|
|
|
|
|
| 26-Jun-10 |
210 |
|
|
|
|
|
|
|
|
|
|
|
|
|
|
|
|
|
|
| 27-Jun-10 |
211 |
|
|
|
|
|
|
|
|
|
|
|
|
|
|
|
|
|
|
| 28-Jun-10 |
207 |
|
|
|
|
|
|
|
|
|
|
|
|
|
|
|
|
|
|
| 29-Jun-10 |
196 |
|
|
|
|
|
|
|
|
|
|
|
|
|
|
|
|
|
|
| 30-Jun-10 |
217 |
|
|
|
|
|
|
|
|
|
|
|
|
|
|
|
|
|
|
| 1-Jul-10 |
216 |
|
|
|
|
|
|
|
|
|
|
|
|
|
|
|
|
|
|
| 2-Jul-10 |
213 |
|
|
|
|
|
|
|
|
|
|
|
|
|
|
|
|
|
|
| 3-Jul-10 |
221 |
|
|
|
|
|
|
|
|
|
|
|
|
|
|
|
|
|
|
| 4-Jul-10 |
217 |
|
|
|
|
|
|
|
|
|
|
|
|
|
|
|
|
|
|
| 5-Jul-10 |
248 |
|
|
|
|
|
|
|
|
|
|
|
|
|
|
|
|
|
|
| 6-Jul-10 |
256 |
|
|
|
|
|
|
|
|
|
|
|
|
|
|
|
|
|
|
| 7-Jul-10 |
262 |
|
|
|
|
|
|
|
|
|
|
|
|
|
|
|
|
|
|
| 8-Jul-10 |
252 |
|
|
|
|
|
|
|
|
|
|
|
|
|
|
|
|
|
|
| 9-Jul-10 |
523 |
|
|
|
|
|
|
|
|
|
|
|
|
|
|
|
|
|
|
| 10-Jul-10 |
525 |
|
|
|
|
|
|
|
|
|
|
|
|
|
|
|
|
|
|
| 11-Jul-10 |
527 |
|
|
|
|
|
|
|
|
|
|
|
|
|
|
|
|
|
|
| 12-Jul-10 |
549 |
|
|
|
|
|
|
|
|
|
|
|
|
|
|
|
|
|
|
| 13-Jul-10 |
231 |
|
|
|
|
|
|
|
|
|
|
|
|
|
|
|
|
|
|
| 14-Jul-10 |
237 |
|
|
|
|
|
|
|
|
|
|
|
|
|
|
|
|
|
|
| 15-Jul-10 |
223 |
|
|
|
|
|
|
|
|
|
|
|
|
|
|
|
|
|
|
| 16-Jul-10 |
202 |
|
|
|
|
|
|
|
|
|
|
|
|
|
|
|
|
|
|
| 17-Jul-10 |
197 |
|
|
|
|
|
|
|
|
|
|
|
|
|
|
|
|
|
|
| 18-Jul-10 |
196 |
|
|
|
|
|
|
|
|
|
|
|
|
|
|
|
|
|
|
| 19-Jul-10 |
194 |
|
|
|
|
|
|
|
|
|
|
|
|
|
|
|
|
|
|
| 20-Jul-10 |
196 |
|
|
|
|
|
|
|
|
|
|
|
|
|
|
|
|
|
|
| 21-Jul-10 |
217 |
|
|
|
|
|
|
|
|
|
|
|
|
|
|
|
|
|
|
| 22-Jul-10 |
198 |
|
|
|
|
|
|
|
|
|
|
|
|
|
|
|
|
|
|
| 23-Jul-10 |
212 |
|
|
|
|
|
|
|
|
|
|
|
|
|
|
|
|
|
|
| 24-Jul-10 |
227 |
|
|
|
|
|
|
|
|
|
|
|
|
|
|
|
|
|
|
| 25-Jul-10 |
201 |
|
|
|
|
|
|
|
|
|
|
|
|
|
|
|
|
|
|
| 26-Jul-10 |
202 |
|
|
|
|
|
|
|
|
|
|
|
|
|
|
|
|
|
|
| 27-Jul-10 |
184 |
|
|
|
|
|
|
|
|
|
|
|
|
|
|
|
|
|
|
| 28-Jul-10 |
166 |
|
|
|
|
|
|
|
|
|
|
|
|
|
|
|
|
|
|
| 29-Jul-10 |
162 |
|
|
|
|
|
|
|
|
|
|
|
|
|
|
|
|
|
|
| 30-Jul-10 |
166 |
|
|
|
|
|
|
|
|
|
|
|
|
|
|
|
|
|
|
| 31-Jul-10 |
154 |
|
|
|
|
|
|
|
|
|
|
|
|
|
|
|
|
|
|
| 1-Aug-10 |
146 |
|
|
|
|
|
|
|
|
|
|
|
|
|
|
|
|
|
|
| 2-Aug-10 |
149 |
|
|
|
|
|
|
|
|
|
|
|
|
|
|
|
|
|
|
| 3-Aug-10 |
156 |
|
|
|
|
|
|
|
|
|
|
|
|
|
|
|
|
|
|
| 4-Aug-10 |
162 |
|
|
|
|
|
|
|
|
|
|
|
|
|
|
|
|
|
|
| 5-Aug-10 |
159 |
|
|
|
|
|
|
|
|
|
|
|
|
|
|
|
|
|
|
| 6-Aug-10 |
133 |
|
|
|
|
|
|
|
|
|
|
|
|
|
|
|
|
|
|
| 7-Aug-10 |
127 |
|
|
|
|
|
|
|
|
|
|
|
|
|
|
|
|
|
|
| 8-Aug-10 |
119 |
|
|
|
|
|
|
|
|
|
|
|
|
|
|
|
|
|
|
| 9-Aug-10 |
127 |
|
|
|
|
|
|
|
|
|
|
|
|
|
|
|
|
|
|
| 10-Aug-10 |
145 |
|
|
|
|
|
|
|
|
|
|
|
|
|
|
|
|
|
|
| 11-Aug-10 |
137 |
|
|
|
|
|
|
|
|
|
|
|
|
|
|
|
|
|
|
| 12-Aug-10 |
127 |
|
|
|
|
|
|
|
|
|
|
|
|
|
|
|
|
|
|
| 13-Aug-10 |
122 |
|
|
|
|
|
|
|
|
|
|
|
|
|
|
|
|
|
|
| 14-Aug-10 |
139 |
|
|
|
|
|
|
|
|
|
|
|
|
|
|
|
|
|
|
| 15-Aug-10 |
147 |
|
|
|
|
|
|
|
|
|
|
|
|
|
|
|
|
|
|
| 16-Aug-10 |
150 |
|
|
|
|
|
|
|
|
|
|
|
|
|
|
|
|
|
|
| 17-Aug-10 |
161 |
|
|
|
|
|
|
|
|
|
|
|
|
|
|
|
|
|
|
| 18-Aug-10 |
127 |
|
|
|
|
|
|
|
|
|
|
|
|
|
|
|
|
|
|
| 19-Aug-10 |
143 |
|
|
|
|
|
|
|
|
|
|
|
|
|
|
|
|
|
|
| 20-Aug-10 |
165 |
|
|
|
|
|
|
|
|
|
|
|
|
|
|
|
|
|
|
| 21-Aug-10 |
161 |
|
|
|
|
|
|
|
|
|
|
|
|
|
|
|
|
|
|
| 22-Aug-10 |
180 |
|
|
|
|
|
|
|
|
|
|
|
|
|
|
|
|
|
|
| 23-Aug-10 |
180 |
|
|
|
|
|
|
|
|
|
|
|
|
|
|
|
|
|
|
| 24-Aug-10 |
176 |
|
|
|
|
|
|
|
|
|
|
|
|
|
|
|
|
|
|
| 25-Aug-10 |
162 |
|
|
|
|
|
|
|
|
|
|
|
|
|
|
|
|
|
|
| 26-Aug-10 |
149 |
|
|
|
|
|
|
|
|
|
|
|
|
|
|
|
|
|
|
| 27-Aug-10 |
124 |
|
|
|
|
|
|
|
|
|
|
|
|
|
|
|
|
|
|
| 28-Aug-10 |
105 |
|
|
|
|
|
|
|
|
|
|
|
|
|
|
|
|
|
|
| 29-Aug-10 |
113 |
|
|
|
|
|
|
|
|
|
|
|
|
|
|
|
|
|
|
| 30-Aug-10 |
121 |
|
|
|
|
|
|
|
|
|
|
|
|
|
|
|
|
|
|
| 31-Aug-10 |
131 |
|
|
|
|
|
|
|
|
|
|
|
|
|
|
|
|
|
|
| 1-Sep-10 |
134 |
|
|
|
|
|
|
|
|
|
|
|
|
|
|
|
|
|
|
| 2-Sep-10 |
120 |
|
|
|
|
|
|
|
|
|
|
|
|
|
|
|
|
|
|
| 3-Sep-10 |
108 |
|
|
|
|
|
|
|
|
|
|
|
|
|
|
|
|
|
|
| 4-Sep-10 |
118 |
|
|
|
|
|
|
|
|
|
|
|
|
|
|
|
|
|
|
| 5-Sep-10 |
123 |
|
|
|
|
|
|
|
|
|
|
|
|
|
|
|
|
|
|
| 6-Sep-10 |
133 |
|
|
|
|
|
|
|
|
|
|
|
|
|
|
|
|
|
|
| 7-Sep-10 |
143 |
|
|
|
|
|
|
|
|
|
|
|
|
|
|
|
|
|
|
| 8-Sep-10 |
124 |
|
|
|
|
|
|
|
|
|
|
|
|
|
|
|
|
|
|
| 9-Sep-10 |
121 |
|
|
|
|
|
|
|
|
|
|
|
|
|
|
|
|
|
|
| 10-Sep-10 |
121 |
|
|
|
|
|
|
|
|
|
|
|
|
|
|
|
|
|
|
| 11-Sep-10 |
118 |
|
|
|
|
|
|
|
|
|
|
|
|
|
|
|
|
|
|
| 12-Sep-10 |
131 |
|
|
|
|
|
|
|
|
|
|
|
|
|
|
|
|
|
|
| 13-Sep-10 |
131 |
|
|
|
|
|
|
|
|
|
|
|
|
|
|
|
|
|
|
| 14-Sep-10 |
130 |
|
|
|
|
|
|
|
|
|
|
|
|
|
|
|
|
|
|
| 15-Sep-10 |
123 |
|
|
|
|
|
|
|
|
|
|
|
|
|
|
|
|
|
|
| 16-Sep-10 |
122 |
|
|
|
|
|
|
|
|
|
|
|
|
|
|
|
|
|
|
| 17-Sep-10 |
131 |
|
|
|
|
|
|
|
|
|
|
|
|
|
|
|
|
|
|
| 18-Sep-10 |
137 |
|
|
|
|
|
|
|
|
|
|
|
|
|
|
|
|
|
|
| 19-Sep-10 |
151 |
|
|
|
|
|
|
|
|
|
|
|
|
|
|
|
|
|
|
| 20-Sep-10 |
144 |
|
|
|
|
|
|
|
|
|
|
|
|
|
|
|
|
|
|
| 21-Sep-10 |
143 |
|
|
|
|
|
|
|
|
|
|
|
|
|
|
|
|
|
|
| 22-Sep-10 |
143 |
|
|
|
|
|
|
|
|
|
|
|
|
|
|
|
|
|
|
| 23-Sep-10 |
167 |
|
|
|
|
|
|
|
|
|
|
|
|
|
|
|
|
|
|
| 24-Sep-10 |
209 |
|
|
|
|
|
|
|
|
|
|
|
|
|
|
|
|
|
|
| 25-Sep-10 |
189 |
|
|
|
|
|
|
|
|
|
|
|
|
|
|
|
|
|
|
| 26-Sep-10 |
192 |
|
|
|
|
|
|
|
|
|
|
|
|
|
|
|
|
|
|
| 27-Sep-10 |
155 |
|
|
|
|
|
|
|
|
|
|
|
|
|
|
|
|
|
|
| 28-Sep-10 |
111 |
|
|
|
|
|
|
|
|
|
|
|
|
|
|
|
|
|
|
| 29-Sep-10 |
109 |
|
|
|
|
|
|
|
|
|
|
|
|
|
|
|
|
|
|
| 30-Sep-10 |
111 |
|
|
|
|
|
|
|
|
|
|
|
|
|
|
|
|
|
|
| 1-Oct-10 |
113 |
|
|
|
|
|
|
|
|
|
|
|
|
|
|
|
|
|
|
| 2-Oct-10 |
116 |
|
|
|
|
|
|
|
|
|
|
|
|
|
|
|
|
|
|
| 3-Oct-10 |
124 |
|
|
|
|
|
|
|
|
|
|
|
|
|
|
|
|
|
|
| 4-Oct-10 |
118 |
|
|
|
|
|
|
|
|
|
|
|
|
|
|
|
|
|
|
| 5-Oct-10 |
112 |
|
|
|
|
|
|
|
|
|
|
|
|
|
|
|
|
|
|
| 6-Oct-10 |
103 |
|
|
|
|
|
|
|
|
|
|
|
|
|
|
|
|
|
|
| 7-Oct-10 |
100 |
|
|
|
|
|
|
|
|
|
|
|
|
|
|
|
|
|
|
| 8-Oct-10 |
102 |
|
|
|
|
|
|
|
|
|
|
|
|
|
|
|
|
|
|
| 9-Oct-10 |
106 |
|
|
|
|
|
|
|
|
|
|
|
|
|
|
|
|
|
|
| 10-Oct-10 |
118 |
|
|
|
|
|
|
|
|
|
|
|
|
|
|
|
|
|
|
| 11-Oct-10 |
130 |
|
|
|
|
|
|
|
|
|
|
|
|
|
|
|
|
|
|
| 12-Oct-10 |
132 |
|
|
|
|
|
|
|
|
|
|
|
|
|
|
|
|
|
|
| 13-Oct-10 |
123 |
|
|
|
|
|
|
|
|
|
|
|
|
|
|
|
|
|
|
| 14-Oct-10 |
122 |
|
|
|
|
|
|
|
|
|
|
|
|
|
|
|
|
|
|
| 15-Oct-10 |
125 |
|
|
|
|
|
|
|
|
|
|
|
|
|
|
|
|
|
|
| 16-Oct-10 |
129 |
|
|
|
|
|
|
|
|
|
|
|
|
|
|
|
|
|
|
| 17-Oct-10 |
136 |
|
|
|
|
|
|
|
|
|
|
|
|
|
|
|
|
|
|
| 18-Oct-10 |
138 |
|
|
|
|
|
|
|
|
|
|
|
|
|
|
|
|
|
|
| 19-Oct-10 |
123 |
|
|
|
|
|
|
|
|
|
|
|
|
|
|
|
|
|
|
| 20-Oct-10 |
98 |
|
|
|
|
|
|
|
|
|
|
|
|
|
|
|
|
|
|
| 21-Oct-10 |
77 |
|
|
|
|
|
|
|
|
|
|
|
|
|
|
|
|
|
|
| 22-Oct-10 |
77 |
|
|
|
|
|
|
|
|
|
|
|
|
|
|
|
|
|
|
| 23-Oct-10 |
62 |
|
|
|
|
|
|
|
|
|
|
|
|
|
|
|
|
|
|
| 24-Oct-10 |
87 |
|
|
|
|
|
|
|
|
|
|
|
|
|
|
|
|
|
|
| 25-Oct-10 |
87 |
|
|
|
|
|
|
|
|
|
|
|
|
|
|
|
|
|
|
| 26-Oct-10 |
109 |
|
|
|
|
|
|
|
|
|
|
|
|
|
|
|
|
|
|
| 27-Oct-10 |
109 |
|
|
|
|
|
|
|
|
|
|
|
|
|
|
|
|
|
|
| 28-Oct-10 |
83 |
|
|
|
|
|
|
|
|
|
|
|
|
|
|
|
|
|
|
| 29-Oct-10 |
86 |
|
|
|
|
|
|
|
|
|
|
|
|
|
|
|
|
|
|
| 30-Oct-10 |
80 |
|
|
|
|
|
|
|
|
|
|
|
|
|
|
|
|
|
|
| 31-Oct-10 |
74 |
|
|
|
|
|
|
|
|
|
|
|
|
|
|
|
|
|
|
| 1-Nov-10 |
91 |
|
|
|
|
|
|
|
|
|
|
|
|
|
|
|
|
|
|
| 2-Nov-10 |
95 |
|
|
|
|
|
|
|
|
|
|
|
|
|
|
|
|
|
|
| 3-Nov-10 |
81 |
|
|
|
|
|
|
|
|
|
|
|
|
|
|
|
|
|
|
| 4-Nov-10 |
91 |
|
|
|
|
|
|
|
|
|
|
|
|
|
|
|
|
|
|
| 5-Nov-10 |
89 |
|
|
|
|
|
|
|
|
|
|
|
|
|
|
|
|
|
|
| 6-Nov-10 |
78 |
|
|
|
|
|
|
|
|
|
|
|
|
|
|
|
|
|
|
| 7-Nov-10 |
90 |
|
|
|
|
|
|
|
|
|
|
|
|
|
|
|
|
|
|
| 8-Nov-10 |
94 |
|
|
|
|
|
|
|
|
|
|
|
|
|
|
|
|
|
|
| 9-Nov-10 |
96 |
|
|
|
|
|
|
|
|
|
|
|
|
|
|
|
|
|
|
| 10-Nov-10 |
104 |
|
|
|
|
|
|
|
|
|
|
|
|
|
|
|
|
|
|
| 11-Nov-10 |
114 |
|
|
|
|
|
|
|
|
|
|
|
|
|
|
|
|
|
|
| 12-Nov-10 |
112 |
|
|
|
|
|
|
|
|
|
|
|
|
|
|
|
|
|
|
| 13-Nov-10 |
111 |
|
|
|
|
|
|
|
|
|
|
|
|
|
|
|
|
|
|
| 14-Nov-10 |
111 |
|
|
|
|
|
|
|
|
|
|
|
|
|
|
|
|
|
|
| 15-Nov-10 |
88 |
|
|
|
|
|
|
|
|
|
|
|
|
|
|
|
|
|
|
| 16-Nov-10 |
83 |
|
|
|
|
|
|
|
|
|
|
|
|
|
|
|
|
|
|
| 17-Nov-10 |
76 |
|
|
|
|
|
|
|
|
|
|
|
|
|
|
|
|
|
|
| 18-Nov-10 |
74 |
|
|
|
|
|
|
|
|
|
|
|
|
|
|
|
|
|
|
| 19-Nov-10 |
78 |
|
|
|
|
|
|
|
|
|
|
|
|
|
|
|
|
|
|
| 20-Nov-10 |
93 |
|
|
|
|
|
|
|
|
|
|
|
|
|
|
|
|
|
|
| 21-Nov-10 |
103 |
|
|
|
|
|
|
|
|
|
|
|
|
|
|
|
|
|
|
| 22-Nov-10 |
103 |
|
|
|
|
|
|
|
|
|
|
|
|
|
|
|
|
|
|
| 23-Nov-10 |
104 |
|
|
|
|
|
|
|
|
|
|
|
|
|
|
|
|
|
|
| 24-Nov-10 |
98 |
|
|
|
|
|
|
|
|
|
|
|
|
|
|
|
|
|
|
| 25-Nov-10 |
98 |
|
|
|
|
|
|
|
|
|
|
|
|
|
|
|
|
|
|
| 26-Nov-10 |
98 |
|
|
|
|
|
|
|
|
|
|
|
|
|
|
|
|
|
|
| 27-Nov-10 |
102 |
|
|
|
|
|
|
|
|
|
|
|
|
|
|
|
|
|
|
| 28-Nov-10 |
107 |
|
|
|
|
|
|
|
|
|
|
|
|
|
|
|
|
|
|
| 29-Nov-10 |
92 |
|
|
|
|
|
|
|
|
|
|
|
|
|
|
|
|
|
|
| 30-Nov-10 |
169 |
|
|
|
|
|
|
|
|
|
|
|
|
|
|
|
|
|
|
| 1-Dec-10 |
216 |
|
|
|
|
|
|
|
|
|
|
|
|
|
|
|
|
|
|
| 2-Dec-10 |
232 |
|
|
|
|
|
|
|
|
|
|
|
|
|
|
|
|
|
|
| 3-Dec-10 |
262 |
|
|
|
|
|
|
|
|
|
|
|
|
|
|
|
|
|
|
| 4-Dec-10 |
214 |
|
|
|
|
|
|
|
|
|
|
|
|
|
|
|
|
|
|
| 5-Dec-10 |
198 |
|
|
|
|
|
|
|
|
|
|
|
|
|
|
|
|
|
|
| 6-Dec-10 |
149 |
|
|
|
|
|
|
|
|
|
|
|
|
|
|
|
|
|
|
| 7-Dec-10 |
129 |
|
|
|
|
|
|
|
|
|
|
|
|
|
|
|
|
|
|
| 8-Dec-10 |
139 |
|
|
|
|
|
|
|
|
|
|
|
|
|
|
|
|
|
|
| 9-Dec-10 |
141 |
|
|
|
|
|
|
|
|
|
|
|
|
|
|
|
|
|
|
| 10-Dec-10 |
153 |
|
|
|
|
|
|
|
|
|
|
|
|
|
|
|
|
|
|
| 11-Dec-10 |
155 |
|
|
|
|
|
|
|
|
|
|
|
|
|
|
|
|
|
|
| 12-Dec-10 |
150 |
|
|
|
|
|
|
|
|
|
|
|
|
|
|
|
|
|
|
| 13-Dec-10 |
149 |
|
|
|
|
|
|
|
|
|
|
|
|
|
|
|
|
|
|
| 14-Dec-10 |
134 |
|
|
|
|
|
|
|
|
|
|
|
|
|
|
|
|
|
|
| 15-Dec-10 |
151 |
|
|
|
|
|
|
|
|
|
|
|
|
|
|
|
|
|
|
| 16-Dec-10 |
151 |
|
|
|
|
|
|
|
|
|
|
|
|
|
|
|
|
|
|
| 17-Dec-10 |
131 |
|
|
|
|
|
|
|
|
|
|
|
|
|
|
|
|
|
|
| 18-Dec-10 |
123 |
|
|
|
|
|
|
|
|
|
|
|
|
|
|
|
|
|
|
| 19-Dec-10 |
118 |
|
|
|
|
|
|
|
|
|
|
|
|
|
|
|
|
|
|
| 20-Dec-10 |
119 |
|
|
|
|
|
|
|
|
|
|
|
|
|
|
|
|
|
|
| 21-Dec-10 |
130 |
|
|
|
|
|
|
|
|
|
|
|
|
|
|
|
|
|
|
| 22-Dec-10 |
141 |
|
|
|
|
|
|
|
|
|
|
|
|
|
|
|
|
|
|
| 23-Dec-10 |
149 |
|
|
|
|
|
|
|
|
|
|
|
|
|
|
|
|
|
|
| 24-Dec-10 |
154 |
|
|
|
|
|
|
|
|
|
|
|
|
|
|
|
|
|
|
| 25-Dec-10 |
162 |
|
|
|
|
|
|
|
|
|
|
|
|
|
|
|
|
|
|
| 26-Dec-10 |
160 |
|
|
|
|
|
|
|
|
|
|
|
|
|
|
|
|
|
|
| 27-Dec-10 |
132 |
|
|
|
|
|
|
|
|
|
|
|
|
|
|
|
|
|
|
| 28-Dec-10 |
119 |
|
|
|
|
|
|
|
|
|
|
|
|
|
|
|
|
|
|
| 29-Dec-10 |
93 |
|
|
|
|
|
|
|
|
|
|
|
|
|
|
|
|
|
|
| 30-Dec-10 |
76 |
|
|
|
|
|
|
|
|
|
|
|
|
|
|
|
|
|
|
| 31-Dec-10 |
124 |
|
|
|
|
|
|
|
|
|
|
|
|
|
|
|
|
|
|
|
|
|
|
|
|
|
|
|
|
|
|
|
|
|
|
|
|
|
|