DFO-2000-033 Central China
 
Purple:
This flood event on July 9, 2000. See the downloadable Mapinfo export format vectors below the maps for data sources and dates.
Within the vector file names, An=AVHRR 1 km night image; Ad=AVHRR 1 km day image, LB=Landsat 7 browse images; L7=Landsat 7 full resolution data; Rs=Radarsat Scansar; E=ERS SAR.
 
Red pattern:
Maximum observed flooding, 1985-present, from multiple sensor sources. This data layer is still incomplete.
 
Blue or black lines or areas:
Digital Chart of the World hydrography streams, rivers, and lakes.
 
Map Preparation and Image analysis: GR Brakenridge


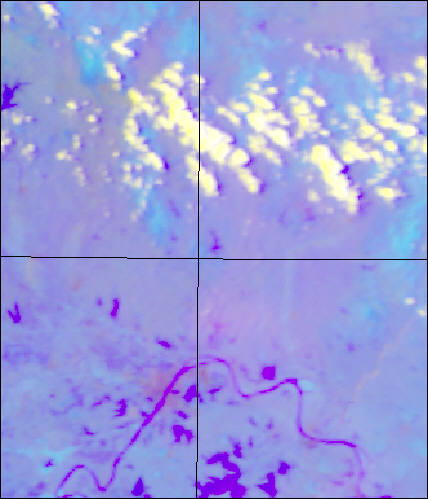
Caption for above map: Location of Central China flooding in early July, in purple. Satellite data courtesy NOAA and topographic data courtesy USGS Eros Data Center.

Download GIS vectors: 000709Chi033Ad.MIF

 
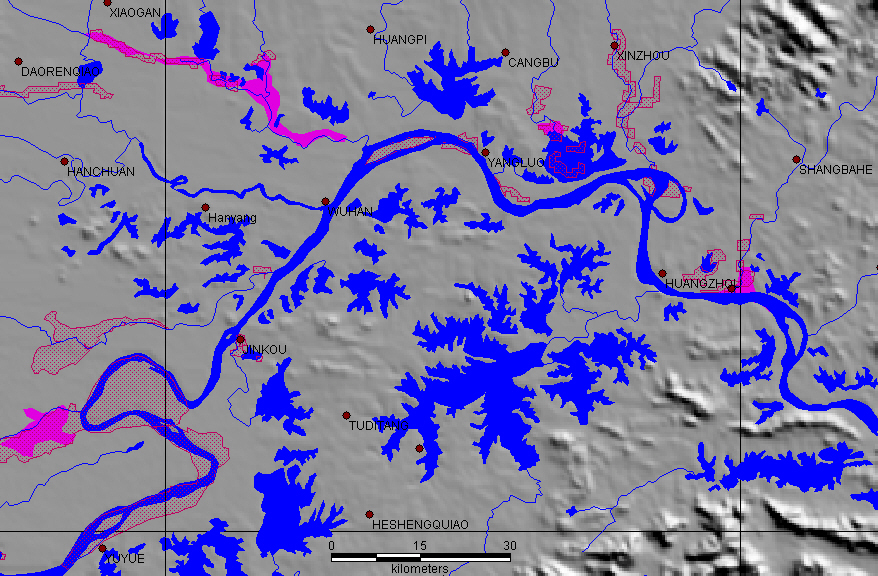
Caption for above map: Detail of flooded lands along the Yangtze on July 9, 2000 (purple) compared to previous flood limits. (red transparent pattern).
 
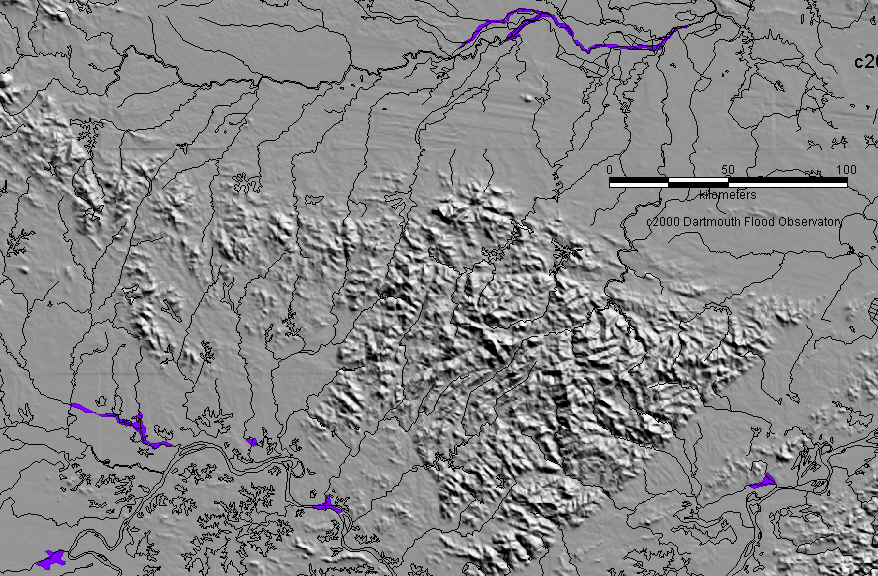
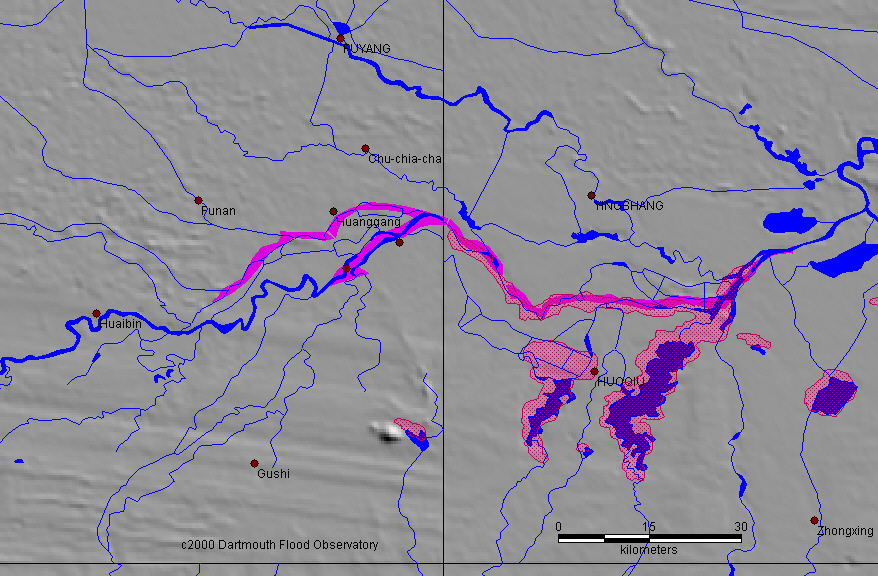
Caption for above map: Detail of flooded lands along the Huai River on July 9, 2000 (purple) compared to previous flood limits. (red transparent pattern).
 
   
  May 7, 2000 AVHRR bands 1,2,3. Data courtesy NOAA-SAA July 9, 2000 AVHRR bands 1,2,3. Data courtesy NOAA-SAA


DFO Homepage