


There may be four map products available here for this flood event: 1) A "Current Conditions and Maximum Flood Extent" map, provided below. Right-click to save the .jpg. This map updates daily during the flood event. It also accumulates a complete record of flooding. DFO terminates the updating when the flood has receded. 2) The same map is available as a simplified Geotif file. 3) And also as a Google Earth kmz file. 4) A .pdf format Maximum Flood Extent Map is manually created after maximum inundation is attained and is produced on request only. Obtain some sample kmz files of flooded areas: Nueces, Trinity, Red, Arkansas, Brazos near Houston.
Red: Flooding within past 14 days (includes MODIS automated product). Light Red: Flooded during this event, from earlier MODIS coverage or non-automated MODIS mapping, now dry land. Darker Red: Flooded areas from high resolution Sentinel 1, Cosmo-Sky Med(radar sensors) or Landsat or EO-1 data. Dark blue: Permanent water, February, 2000 (SWBD*). Very light blue: All flooding mapped by DFO since yr 2000. Special for this event: small red squares are USGS gauging stations above flood stage on May 28, 2015.
MODIS-based data cover the region but may be interupted by cloud cover. Individual scenes from other sensors cover much smaller areas within this region..
*The Shuttle Water Boundary Data are at 90 m spatial resolution and provide a useful reference water.
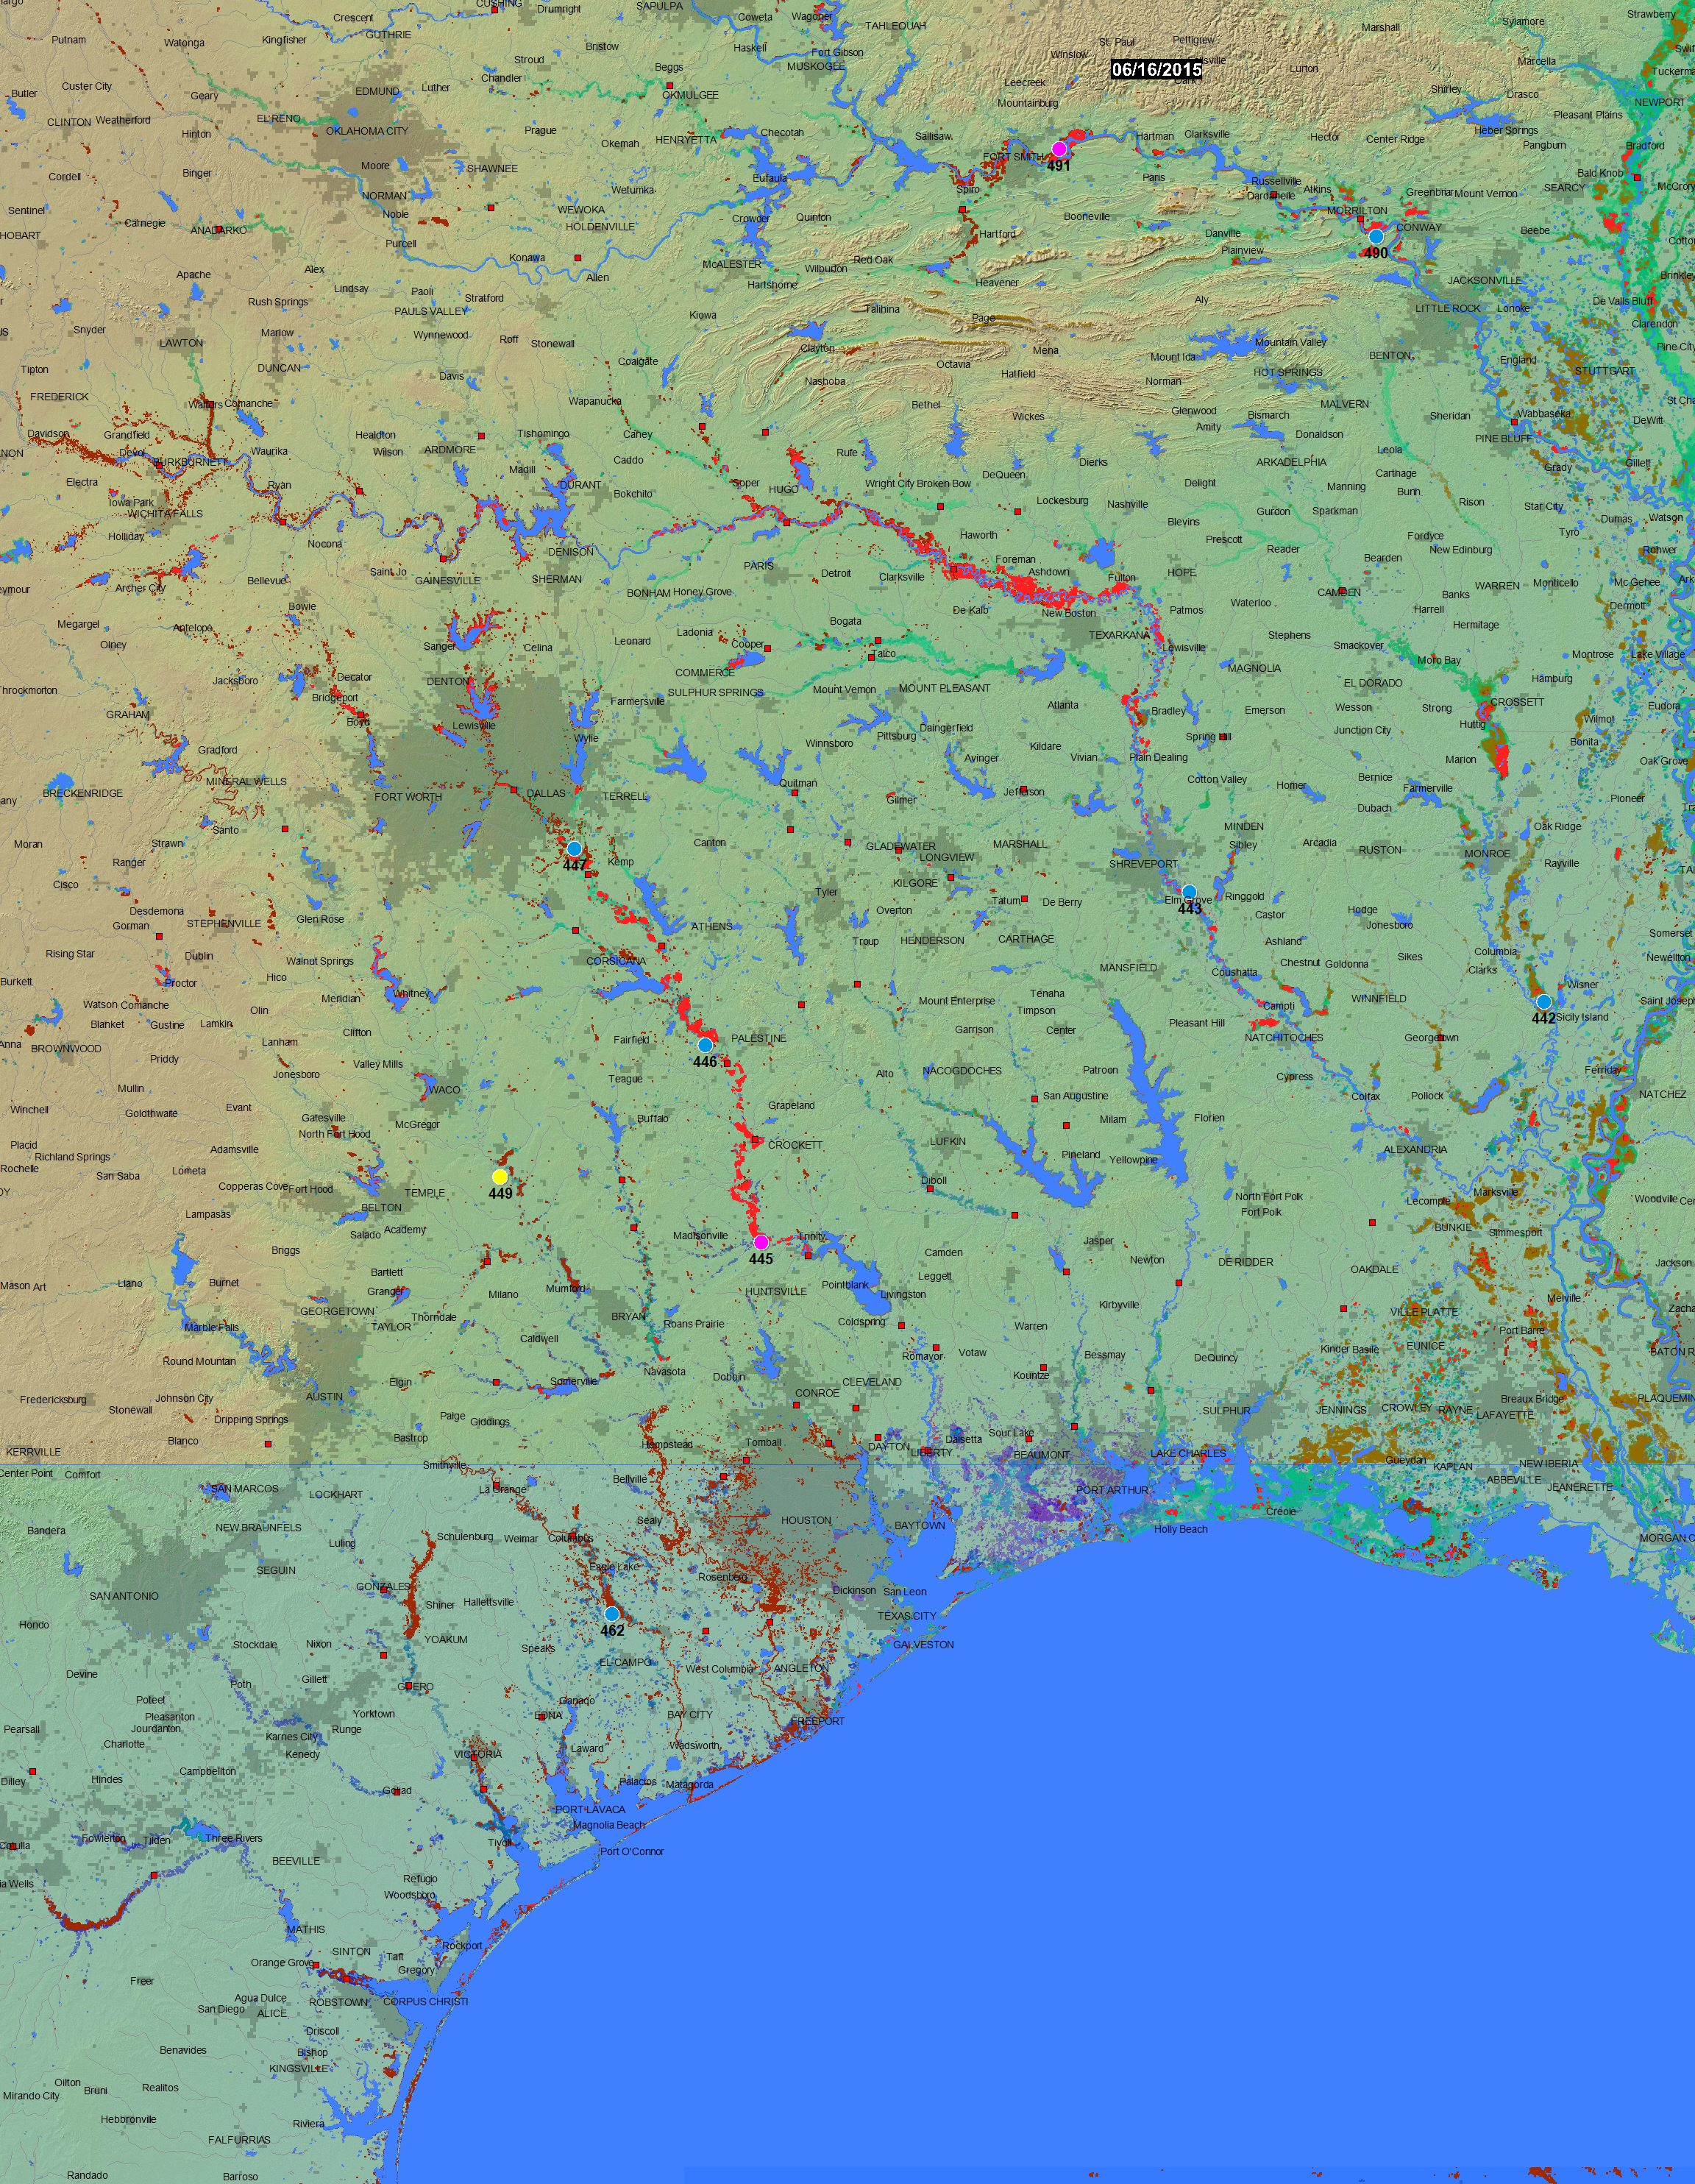
At selected locations, a time series of satellite microwave-based daily river discharge measurements are available. These define the estimated recurrence interval of mapped flooding. Yellow dots: low flow (<20th percentile discharge for this date); Blue dots: normal flow; Purple dots: moderate flooding (>1.5 yr recurrence); Red dots: major flooding (> 5 yr recurrence). See River Watch Global Display for more information.


Also visit Center for Space Research, University of Texas,for display of gauging station status in this region.
COSMO-Sky Med tasking and image data are provided by the Italian Space Agency (ASI) as contribution to the CEOS Flood Pilot. GIS files of total water or flood water based on Cosmo-Sky Med data were provided by Marco Chini, Luxembourg Institute of Science and Technology (LIST), Department of Environmental Research and Innovation (ERIN), email: marco.chini@list.lu. These were edited at DFO to remove very small areas of water outside of floodplain lands. EO-1 tasking and data are provided by Stu Frye and colleagues at the NASA Goddard Space Flight Center. The Land Atmosphere Near-real time Capability for EOS (LANCE) system, operated by NASA/GSFC, provides expedited MODIS data. Landsat 8 data are provided by the U.S. Geological Survey Hazards Data Distribution System. Landsat 8 is jointly managed by NASA and the United States Geological Survey.
A daily-updated 14-day accumulation .shp (and associated files) is named "current" and is provided in the MODISlance_2wkpro directory. The non-automated, MODIS-based .shp or MapInfo files are located in a special flood event folder, here, together with any other high resolution (Landsat 8, EO-1, etc) .shp or MapInfo files. The map display above is produced from a stack of GIS files, which are all included in that directory (the "current" file is not).
As part of collaborations with other disaster response/satelllite mapping organizations, and the Global Flood Partnership, our data are provided through the above links and can be freely used, including for commercial purposes, under the terms of the Creative Commons Attribution 3.0 Unported License. The authors should be cited. As well, other organizations provide satellite-based GIS flood inundation data and such are sometimes incorporated in this display (and its matching Geotif). When permission for redistribution is provided, those GIS files, are also provided in the special event folder.
The automated MODIS product: This map may incorporate 250 m spatial resolution MODIS Rapid Response Subset data: provided by NASA's LANCE System. It most commonly incorporates data from from an automated MODIS flood processor using LANCE reflectance data. See appropriate Surface Water Record display for more information and technical description. The display updates daily using a composite 14-day MODIS NRT product incorporating today's data and 13 days prior. This provides the needed spatial coverage in many areas. In very cloudy regions, however, even the 14 day accumulation period may not suffice to provide complete coverage.
Manual Flood Mapping from MODIS: When the automated processor is not detecting water due to sustained cloud cover, individual MODIS scenes and operator-assisted mapping can provide better results. This is because the automated processor relies on a filter using 3-day/6-image data sets to remove moving cloud shadow noise. The following method of manual water/land classification and map production from single image Rapid Response Subset data is effective: a) The subset geotiff data, bands 721 composites, are used. b) A band math/ratio and threshold approach is applied within Envi™ as follows: 1) Band math: "(float(b2) gt 200 ) or (((float(b1)+1)/(float(b2)+80)) gt .7) or float(b3) gt 17", where b2 = band 1; b3 = band 2; b1 = band 3 of the three channel RGB (bands 1,2,3) geotiff files. 3) This produces a binary geotif file with 0, black, as water, and 1, white, as land. 4) To remove cloud shadows ,if necessary, two images closely spaced in time (within one day) are processed, the classification results added, and the results added. Water must retain values of 0. 5) A GIS polygon (.shp format) is then fit around the water pixels within Envi™
The MODIS water classification algorithm uses band 1 and 2 data at 250 m spatial resolution (coarse enough so that many small areas of water are included on "land" pixels, and, in some cases, land islands are not detectable within "water" pixels. For single image-based (non-automated) water classification, errors of commission (false "water") include cloud shadows and terrain shadows. Manual editing sometimes is able to remove much of this noise. When more than one image closely spaced in time are available, the method described above also is used to remove cloud shadow noise. A major error of omission in all optical sensor-based flood mapping is cloud obcuration. The mapping shows what is visible, but other areas of flooding may be occurring and not be mapped.
Brakenridge, G.R., Slayback, D., Kettner, A.J., Policelli, F., De Groeve, T., and Cohen, S., 2015, Current Conditions and Maximum Flood Extent, 2015 Flooding in Texas, Oklahoma, and Arkansas, DFO Event 4252, http://floodobservatory.colorado.edu/Version3/2015Texas4252.html.