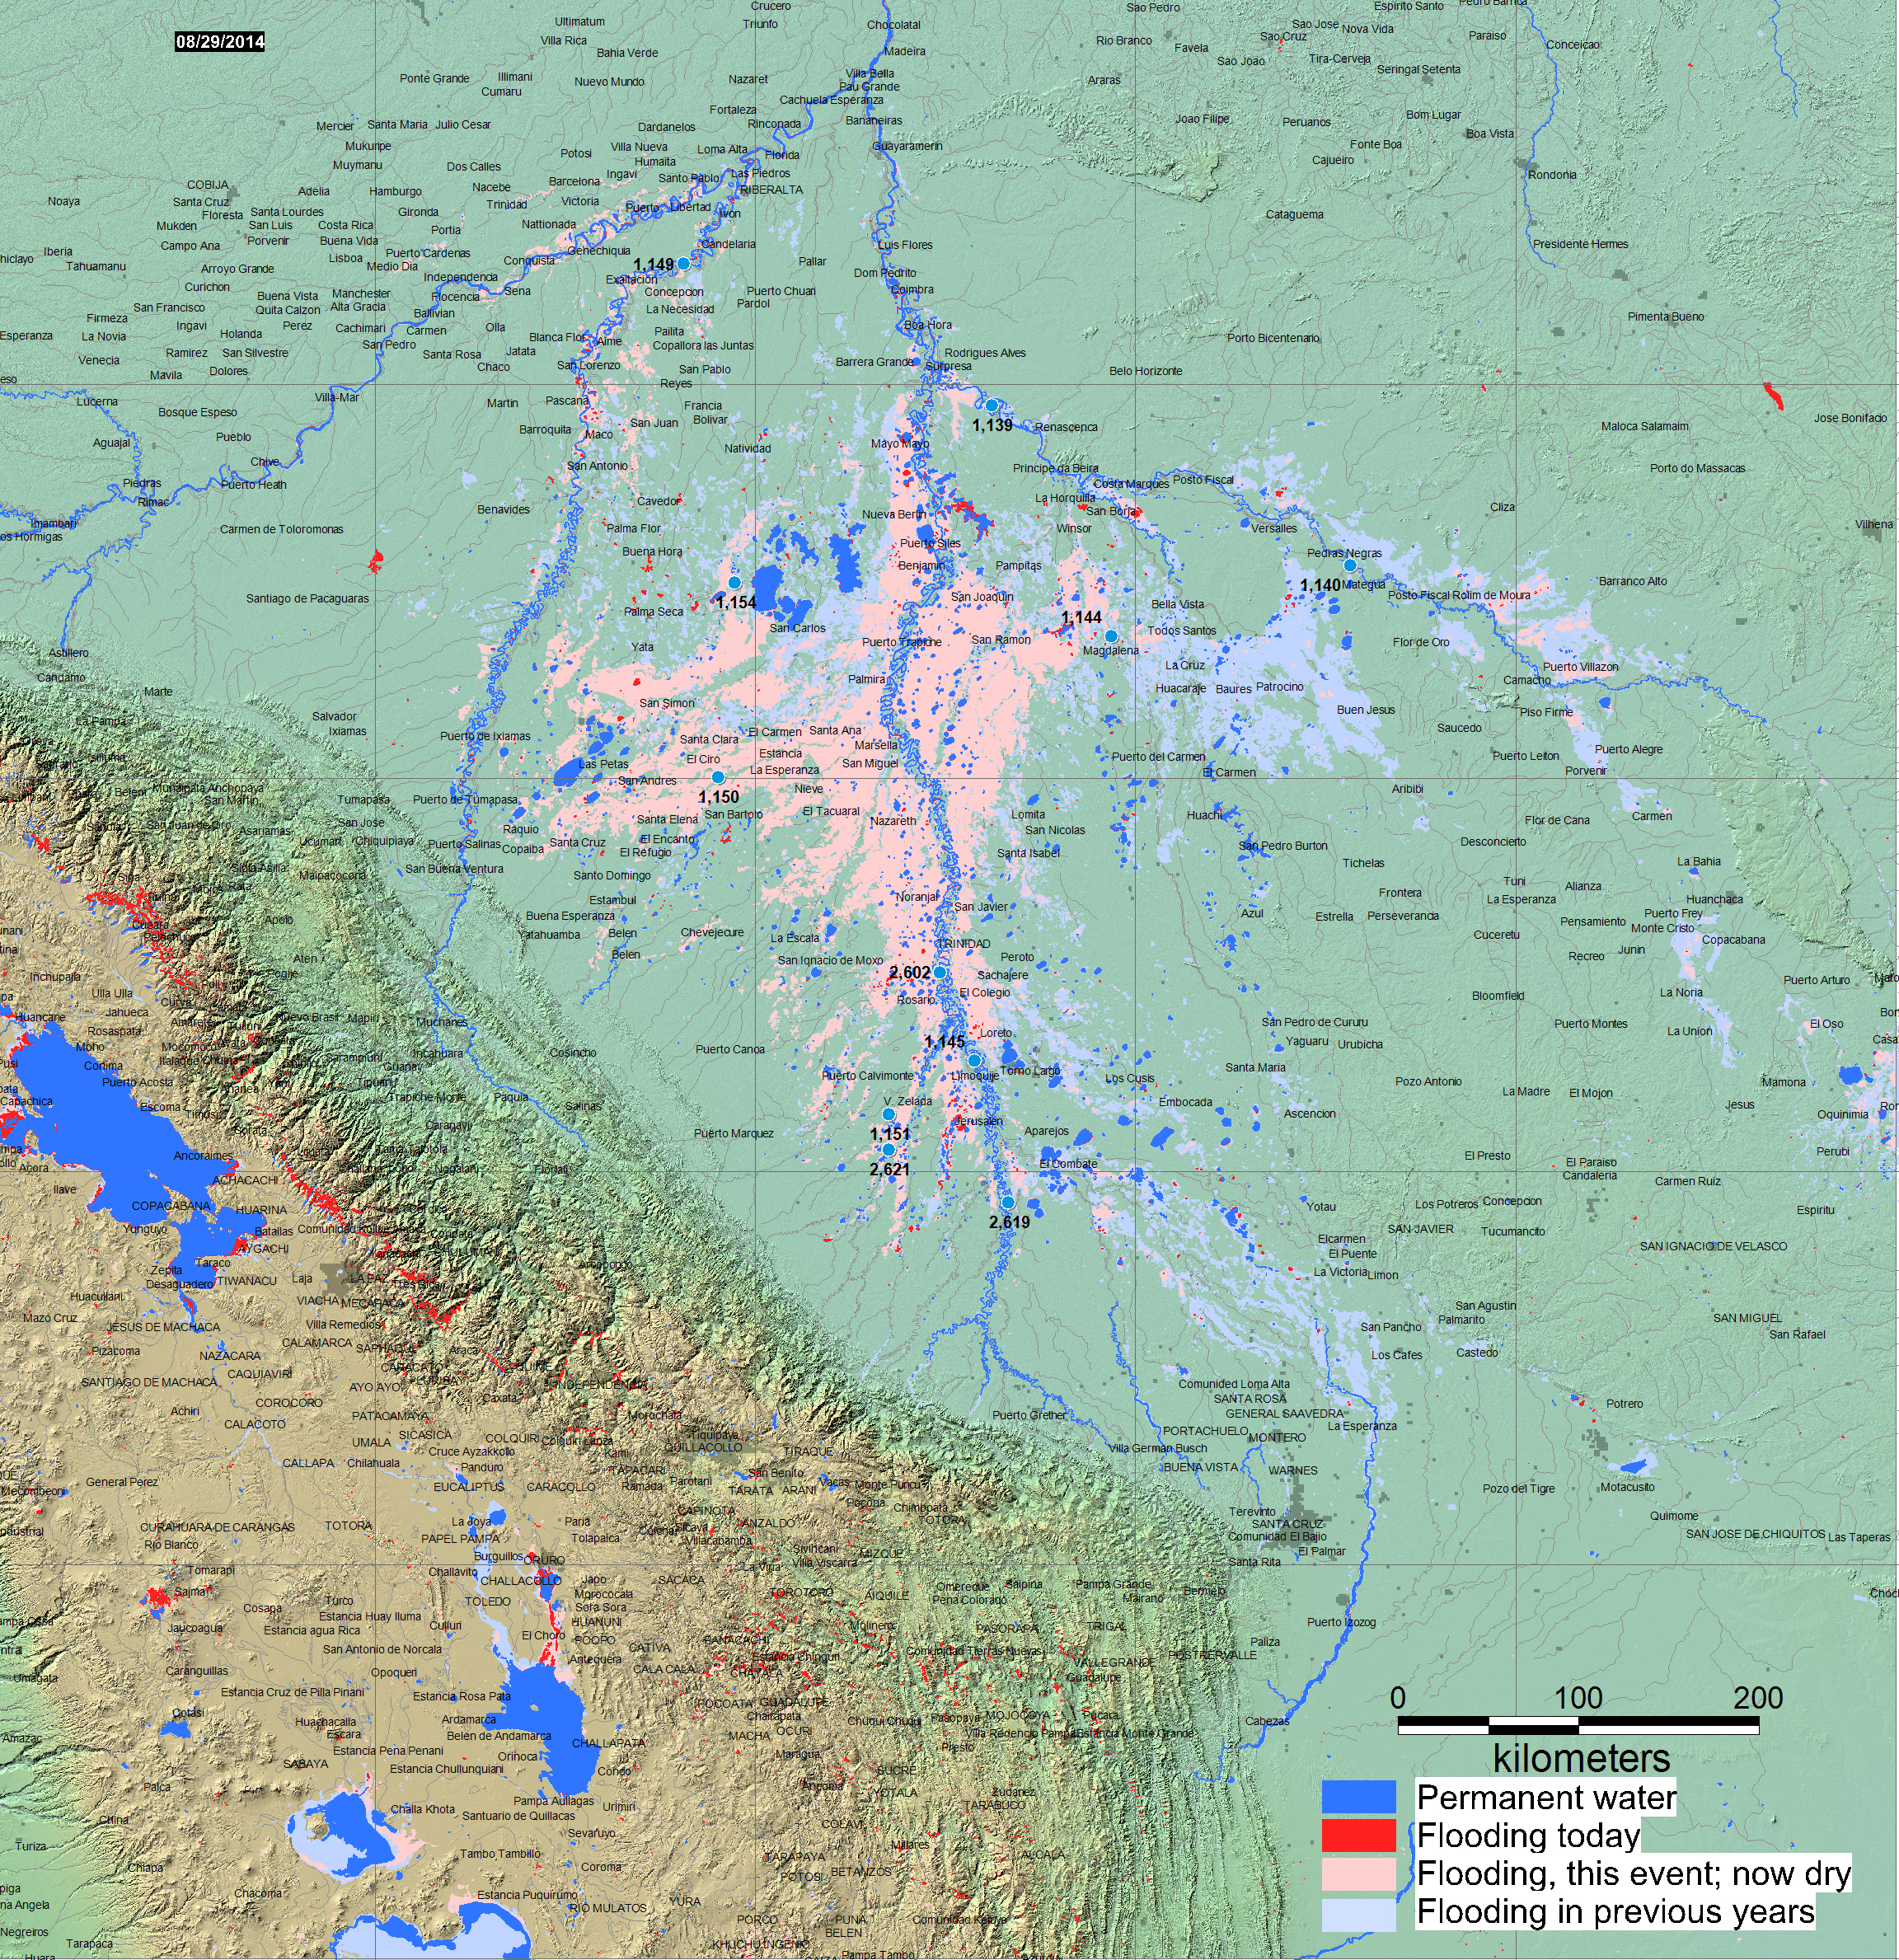
Our objective is to provide flooding currently underway, and also a record of the maximum flood extent.
Four map products are available (click on the links): 1) A "Current Conditions and Maximum Flood Extent" map, provided below; 2) The same map, as an updating, downloadable Geotif file; 3) A .pdf format "Flood Event Map" showing peak flood conditions on a specific date; and 4) the same map as a Google Earth kmz file.
The Current Conditions map shows the accumulated flooding (in this event) and the present status. Daily updating is terminated when the flood has receded. These are dynamic maps, until updating terminates.
The Flood Event Map is static, and provides an easily printed and shared "portrait" of the flood event: on the approximate date of most severe flooding. It may not show all land areas flooded during all phases.
The Observatory uses an automatically generated "current conditions" file, which is actually a 14 day accumulation of the MODIS NRT daily water. Thus, "current" refers to all flooding visible within the past two weeks. The maximum flood extent, however, includes all flooding mapped since the event began.
This map may incorporate 250 m spatial resolution MODIS Rapid Response Subset data: provided by NASA's LANCE system: https://earthdata.nasa.gov/data/near-real-time-data/rapid-response/modis-subsets. It may also incorporate data from an automated MODIS 250 m flood processor using NASA LANCE data. See appropriate Surface Water Record display for more information, links to those component data, and technical description.We acknowledge the use of data from the Land Atmosphere Near-real time Capability for EOS (LANCE) system operated by the NASA/GSFC/Earth Science Data and Information System, and also the NASA Applications and Earth Sciences programs, which support the MODIS NRT flood processor.
When the automated processor is not detecting water due to frequent and heavy cloud cover, individual MODIS scenes and operator-assisted mapping can provide better results.The following method of water/land classification and map production from the Rapid Response subset data is effective: a) The subset geotiff data, bands 721 composites, are used. b) A band math/ratio and threshold approach is applied within Envi™ as follows: 1) Band math: "(float(b2) gt 200 ) or (((float(b1)+1)/(float(b2)+80)) gt .7) or float(b3) gt 17", where b2 = band 1; b3 = band 2; b1 = band 3 of the three channel RGB (bands 1,2,3) geotiff files. 3) This produces a binary geotif file with 0, black, as water, and 1, white, as land. 4) To remove cloud shadows, two images closely spaced in time (within one day) are processed, the classification results added, and the results added. Water must retain values of 0. 5) A GIS polygon (.shp format) is then fit around the water pixels within Envi™.
Landsat 8 data used here are commonly provided by the United States Geological Survey Hazards Data Distribution System (http://hdds.usgs.gov/hdds2/). Landsat 8 is jointly managed by NASA and the United States Geological Survey.
Method of Landsat water/land classification and map production: 1) Landsat bands 3 (green), 0.53-0.59; 5 (near infrared), 085.-0.88; and 6, (short-wave infrared), 1.57-1.65, of the Operational Land Imager (OLI) sensor are used to produce a color composite for quality control purposes. 2) The following processing steps are performed to produce classified water pixels: a) Using Envi™, an NDVI-like product is produced: band 3-band 5/band 3 + band 5. b) Water pixels are identified via a threshold: "water" = < -.04 of this ratio result, c) GIS (.shp files) are then produced within Envi™ and outline the preliminary water areas. d). Within GIS software, the polygons are displayed over the tif image, and evident cloud shadow-sourced and other error polygons are manually deleted. This method is designed for rapid, operator-assisted transformation of Landsat image data into water map information. The band 3/ band 5 information when processed in this way avoids most cloud shadow (false positives) and provides sensitive water/land discrimination.
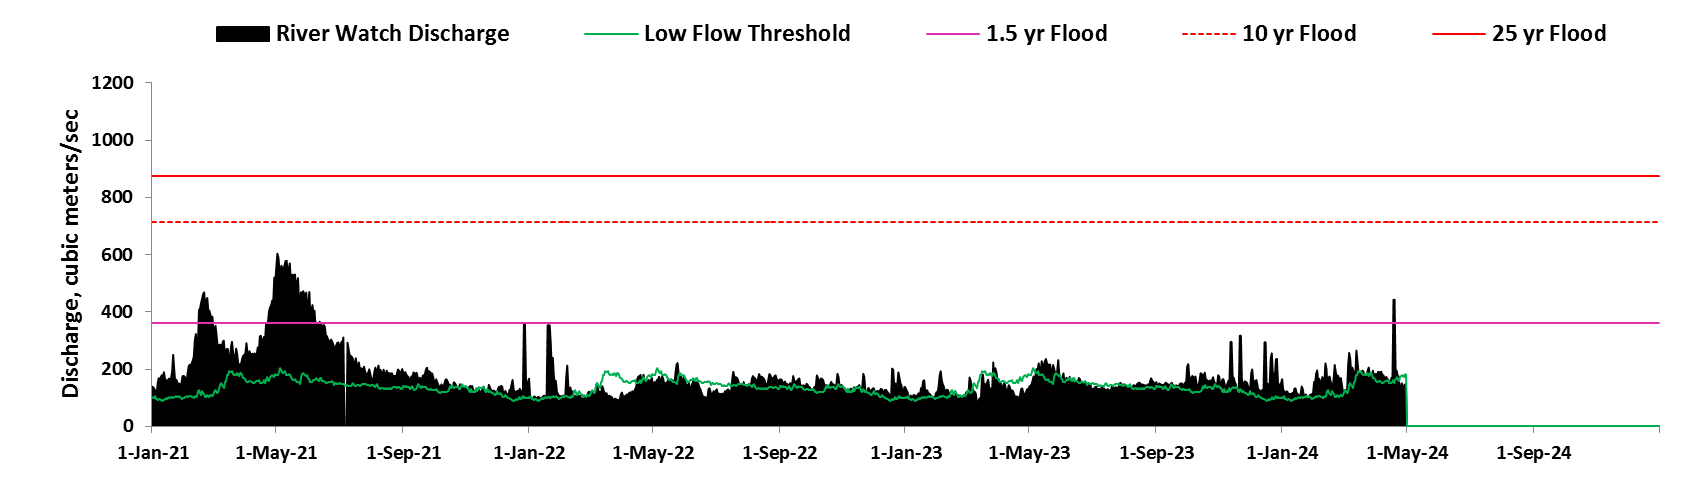
At selected locations, a time series of satellite microwave-based daily river discharge measurements are available. These define the estimated recurrence interval of mapped flooding. Click on the colored dots in the online Current Conditions display. Yellow dots: low flow (<50 % mean daily runoff for this date); Blue dots: normal flow; Purple dots: moderate flooding (>1.33 yr recurrence); Red, major flooding (> 5 yr recurrence). See River Watch global display for more information.
The River Watch output (live sample display below, for site #1150) indicates that this flood was here in excess of the computed (using Log Pearson III) 30 yr recurrence interval event, based on period of record 1998-present. The other river measurement sites in the area covered by this map show similar results. Annual flooding is common during March-May at most of these sites and is mapped each year by MODS; this year's seasonal flooding was, however, very severe (2, on a three fold, 1, 1.5, and 2 scale). The Flood Observatory assigned a magnitude of 7.9 to this event, and as based on its severity, area affected, and duration.
MODIS inundation limit GIS data (not from automated processor)
Landsat 8 inundation limit GIS data
Work supported by the NASA Applications Program (Dr. Francis Lindsay) and CAF, the Development Bank for Latin America (Mr. Eric Van Praag) in collaboration with GeoSUR.