Citation: Brakenridge, G.R., Kettner, A.J., Slayback, D. and Policelli, F., map number, date of map, The Surface Water Record: Dartmouth Flood Observatory, University of Colorado, Boulder, CO, USA (http://floodobservatory.colorado.edu/index.html).
These maps provide current surface water extent based on NASA MODIS data, and the observed recent history of changes (2000 to present). Surface water expansions and contractions are both recorded. Mapped water expansions may be short-term, from inland flooding or coastal storm surges. Or long-term, from post-2000 construction of new reservoirs or increases in rice agriculture or aquaculture. Reductions in surface water may be from temporary drought conditions, or persist over longer periods (for example, some progressively shrinking wetlands). Please see the Guide for examples.
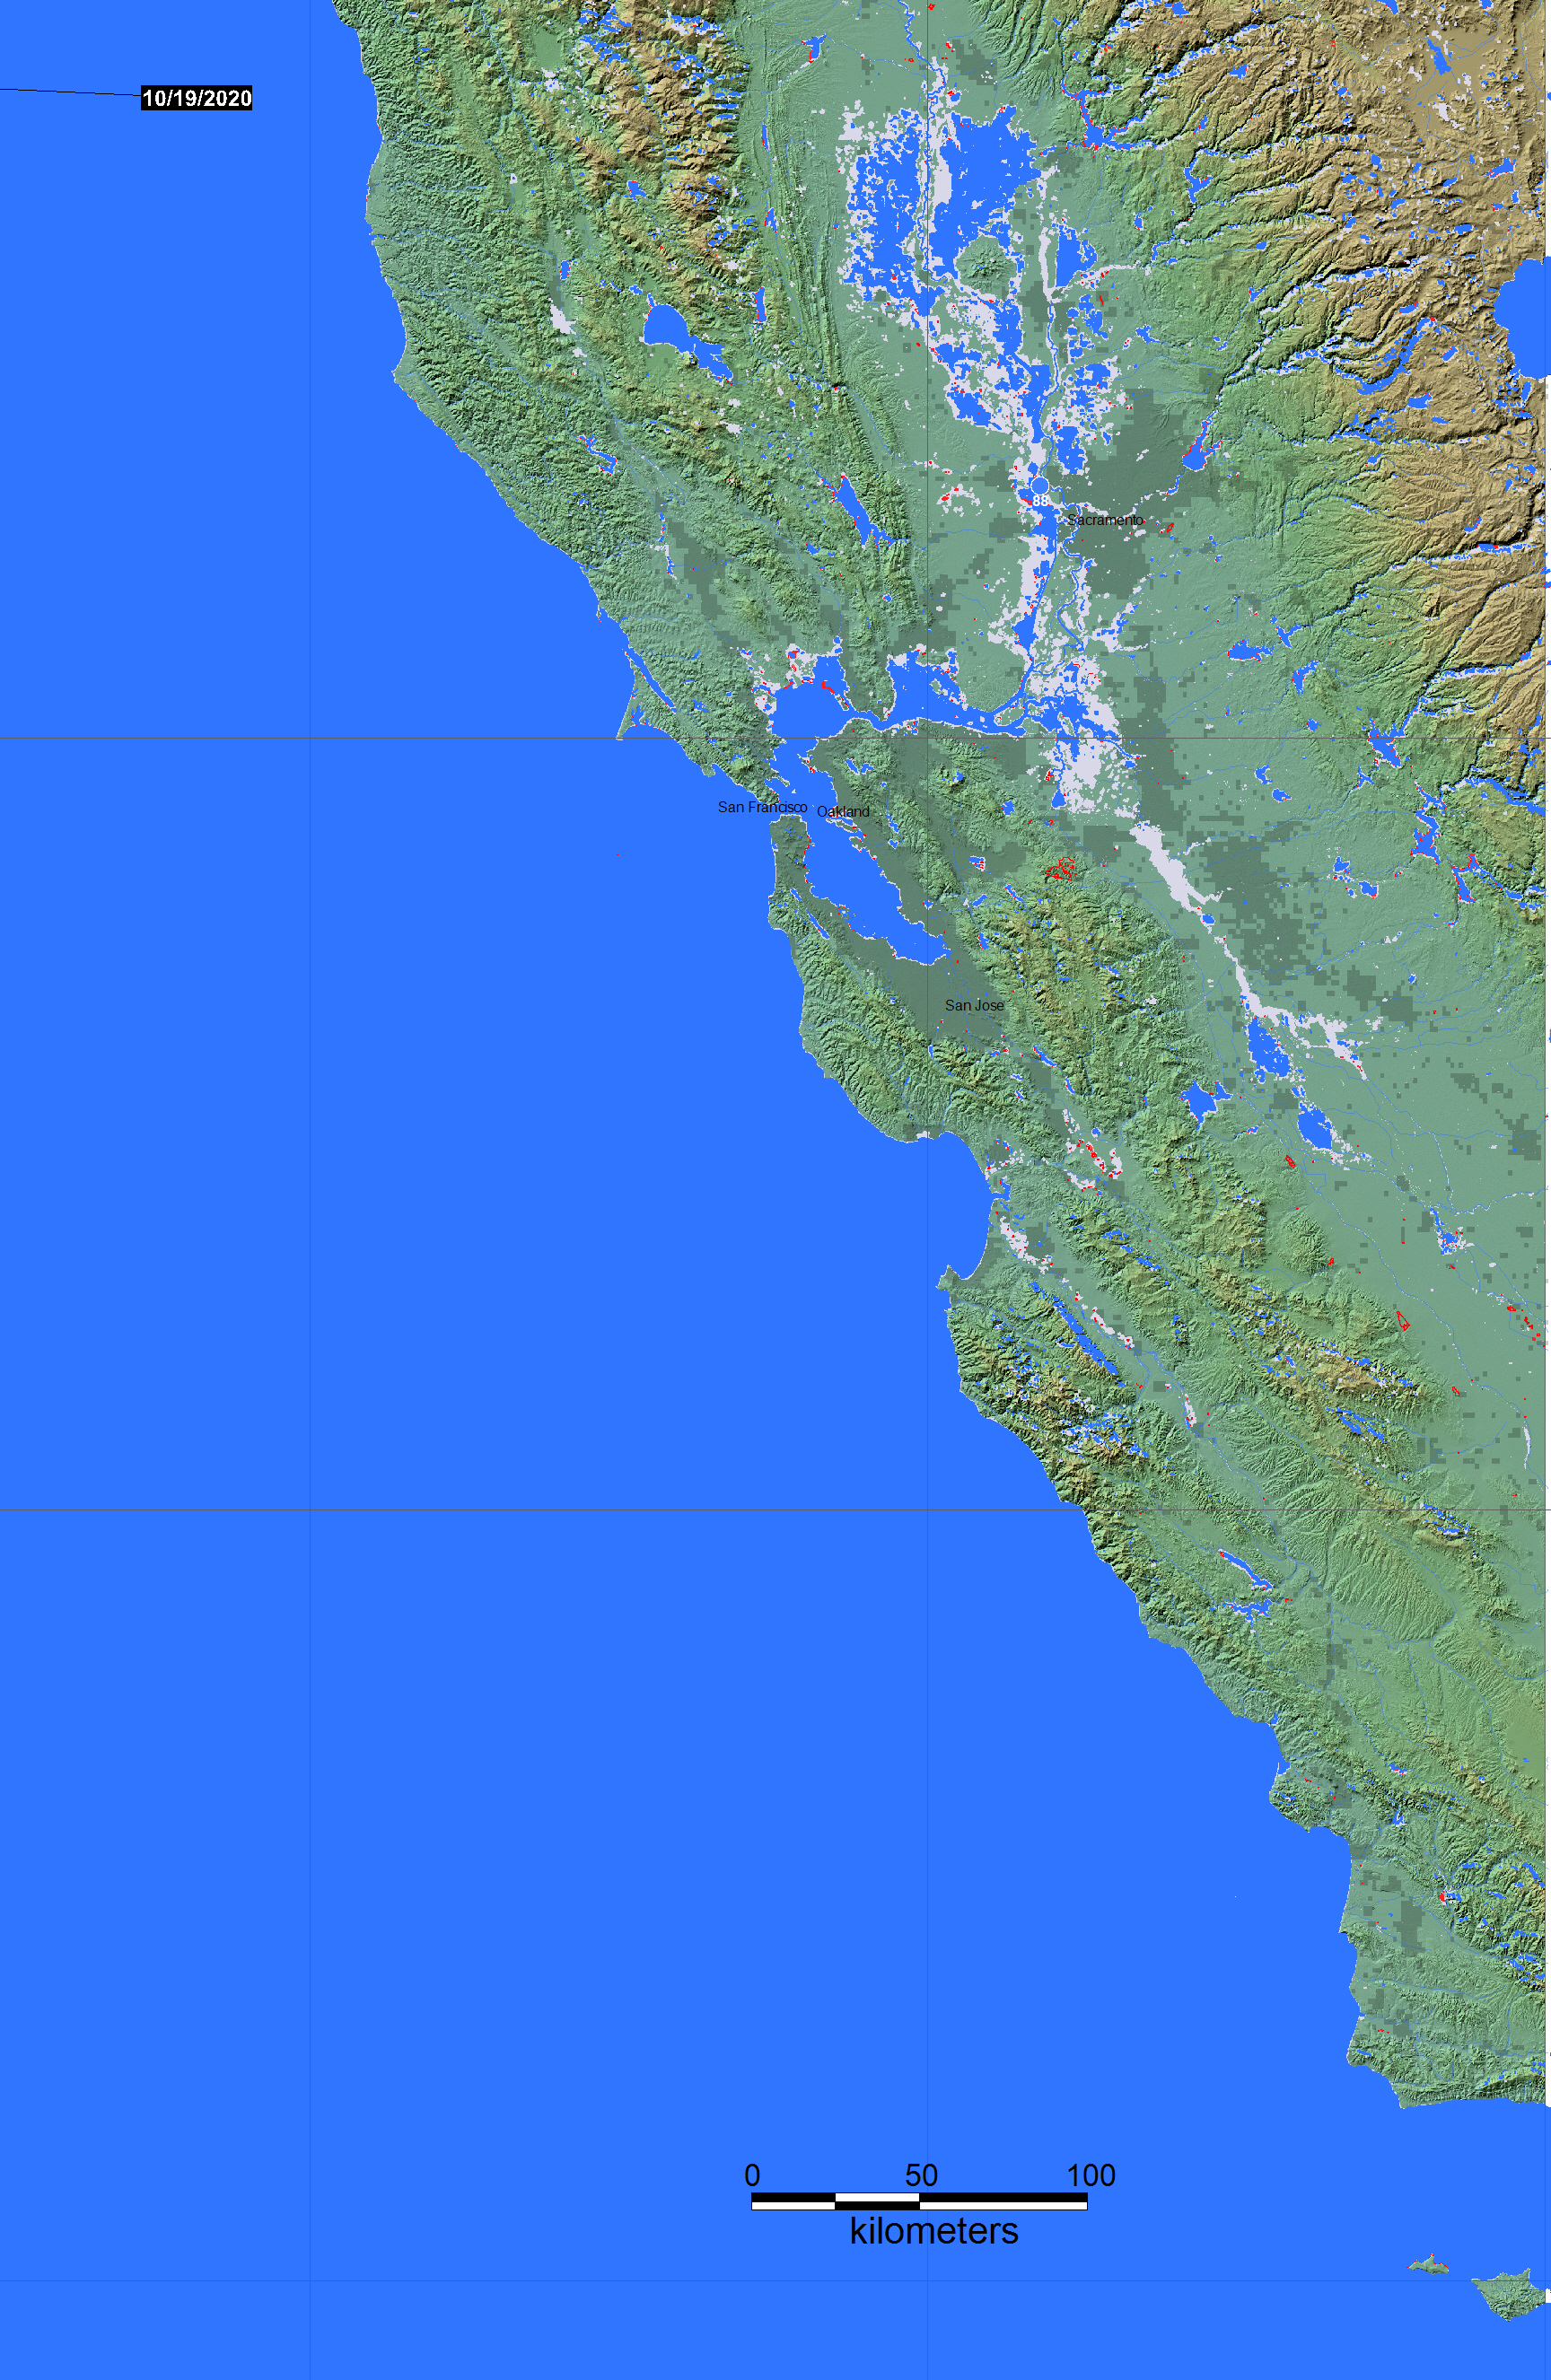
Twice-daily imaging (Terra-MODIS and Aqua-MODIS, at 250 m spatial resolution) of surface water is accumulated over 14 days to remove nearly all cloud obscuration. The map date refers to a two week period ending on that date. Flooding is bright blue, areas of past flooding are light blue gray. The record of past flooding allows the relative size of any ongoing flooding be assessed. Clickable black dots, where illustrated, access DFO's River Watch 2 data at individual river or reservoir measurement sites. These data are updated daily.
A daily-updated 14-day accumulation .shp (and associated files) is named "current" and is provided in the MODISlance_2wkpro directory.
Click here for access to the archived long term GIS file record for this map sheet. In 2013, all DFO GIS files are being transferred to this directory. Choose appropriate dates to retrieve surface water changes during floods or droughts.
Click here for access to the automated daily .shp file GIS record (record commences in 2011). Choose map sheet directory and appropriate dates to retrieve surface water changes of interest.
See also NRT Global MODIS Flood Mapping from NASA, and technical information about the Record, including hints for importing the maps into GIS. With citation of the source (see above), this display and associated data can be further distributed and used under the Creative Commons Attribution 3.0 Unported License. Please use our names in such citation: this display and associated data are authored by Brakenridge, G.R., Kettner, A.J., Slayback, D. and Policelli, F.
Map Legend
At the time of map date:
Large areas of purple are dry land (formerly water in February, 2000, when the reference SWBD water database was obtained). At higher latitudes, such areas may be ice-covered water.
Small areas of purple are water mapped by SWBD, but are too small to be mappable by MODIS.
Dark blue is current water, imaged by MODIS and by SWBD in 2000 ("permanent" water).
Bright blue is flooding: expanded water areas mapped by MODIS compared to SWBD. Any post-2000 reservoir or new water body is also depicted in bright blue.
Light blue-gray is all previous flooding imaged and mapped by the Flood Observatory (now dry land). Note: in mountainous areas, local shadows are commonly mis-classified as water. See also the Record Guide.