


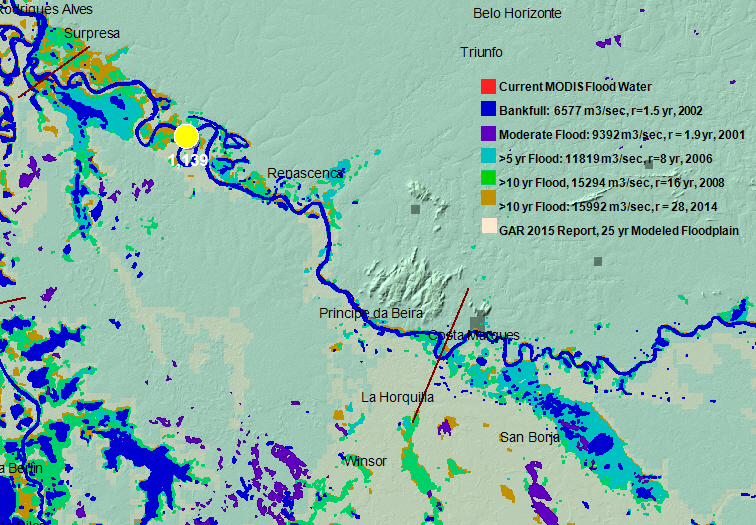
Light Blue: Current MODIS Water (from 14 day composite); Blue: Bankfull, ~ 1.5 yr discharge; Light Purple: Moderate Flood (1.5 - 5 yr discharge); Light Red: > 5 yr Flood;Red: >10 yr Flood; Light Gray: GAR 2015 25 yr Modeled Floodplain. See River Watch Site 1139.
Supported by NASA Earth Science Applied Sciences grant NNX14AQ44G, 2014-2017, "Near Real Time Flood Inundation Prediction and Mapping For the World Food Program, GeoSUR, and US AID/OFDA". Authors: G. R. Brakenridge, T. De Groeve, A. J. Kettner, D. Slayback, and F. Policelli (2015).
Microwave data for River Watch are from the Japanese Space Agency and NASA (AMSR-E, AMSR-2, TRMM, and GPM sensors). Data are initially processed by the Global Flood Detection and Alert System, GDACS, European Commission's Joint Research Center, Ispra, Italy. Optical flood mapping data are primarily from the two NASA MODIS sensors and, for current conditions, from the MODIS NRT processor at NASA Goddard Space Flight Center, USA. Due to cloud cover, optical mapping of flooding may lag behind River Watch/microwave sensor detection of flooding.
For vectorization of the Geotif (RGB): Blue, 64,128,255; Light Blue, 160,192,255; Light Purple, 255,176,255, Medium Red, 255,144,144, Dark Red, 255,96,96; Light Gray, 224, 224, 224.
Return to River Watch Global Display