
River Watch Version 3.4
Experimental Satellite-Based River Discharge Measurements: Technical Summary
G. Robert Brakenridge, Albert Kettner, James Syvitski, and Irina Overeem, INSTAAR/CSDMS, University of Colorado, Boulder, CO, USA
Tom De Groeve
Joint Research Centre of the European Commission, Ispra, Italy
Sagy Cohen
Surface Dynamics Modeling Laboratory, Dept. of Geography, University of Alabama, Tuscaloosa, AL, USA
Son V. Nghiem
Jet Propulsion Laboratory, California Institute of Technology, Pasadena, CA, USA
Updated: November 18, 2015
Cite as: Brakenridge, G.R. and others, 2015, "Experimental Satellite-Based River Discharge Measurements: Technical Summary". Online publication at: http://floodobservatory.colorado.edu/SatelliteGaugingSites/technical.html
Introduction
Satellite microwave sensors provide global coverage of the Earths land surface on a daily basis and, at certain wavelengths, without major interference from cloud cover. Using a strategy first developed for wide-area optical sensors (see for example: Brakenridge and others, 2005), these sensors (e.g. AMSR-E, AMSR-2, TRMM, and GPM) can measure river discharge changes. As rivers rise and discharge increases, water area within single-pixel satellite gauging sites (parcels of floodplain land 10 km x 10 km) also rises (Brakenridge and others, 2007; Brakenridge and others, 2012). A ~37 GHz image pixel of these dimensions centered over a river is commonly "mixed"; it includes both water (low emission), and land (much higher emission). As the proportion of water area rises, the bulk emitted radiation declines. The microwave signal is thereby sensitive to flow width changes.
Discharge data (m3/sec) can be used to calculate surface runoff (commonly expressed as discharged water volume/watershed area/unit time, e.g., mm/week). Runoff and runoff anomalies apply to the contributing watershed, and can be directly compared to measured precipitation, infiltration, and evapotranspiration over such watersheds.
Rating Curves
Transformation of the remote sensing signal to river discharge values is accomplished using a rating equation (as is the case for stage-based discharge measurements on the ground). For River Watch 3, the calibrating discharge values are obtained by runs of a global runoff model (WBM). Five years (2003-2007) provide abundant model output for calibration. The model produces daily discharge values for these years at each measurement site (its global grid resolution is also 10 km). As shown on the site displays (click "obtain data" at each site), a signal-discharge rating curve results. The rating curve equation then transforms the daily signal data to discharge. The equation is either in the form of a simple linear regression or a second-order polynomial best fit.
The standard rating curves use monthly maximum, minimum, and mean daily discharges for both model output and the remote sensing (n=180). Earlier research indicated this to be an efficient method to extract daily low, medium, and high model output paired with same-day remote sensing (Brakenridge and others, 2012). We expect scatter in such plots: both model and remote sensing error are included. Global scale modeling may perform poorly at some sites, even while the remote sensing is tracking discharge changes very well. Or the site may be poorly located and the remote sensing signal may not sensitively record discharge changes. However, in many cases, at well-chosen sites, there is strong correlation of modeled discharge and the remote sensing signal: both are independently tracking actual discharge changes. The degree of temporal correlation does not, however, constrain the discharge magnitudes (there could be model bias). Testing is therefore performed to compare River Watch discharge output with ground-based gauging station data (see some U.S. examples below in this regard). Also, where ground gauging stations and satellite gauging sites are co-located, the remote sensing can be calibrated to discharge directly via the ground information. Selected U.S. sites therefore compare model-based and ground station-based rating curves and provide assessments of both model bias and also the overall accuracy of the River Watch information.
River Watch 3 Processing Details
River Watch 3 uses the NASA/Japanese Space Agency Advanced Scanning Microwave Radiometer (AMSR-E band at 36.5 GHz, the NASA/Japanese Space Agency TRMM 37 GHz channel, and 37 GHz information from the new AMSR-2 and GPM sensors. The discharge estimator (the remote sensing signal) is the ratio of the daily calibrating value ("C") that represent the 95th percentile of the day's driest (brightest) emissivity within a 9 pixel x 9 pixel array surrounding the site, and "M", the emissivity from a measurement pixel centered over the river and its floodplain. The 95th percentile is used instead of the hottest pixel to exclude outliers due to measurement error. C/M is very sensitive to changing surface water area within the M pixel and the ratio removes most emission variation that affect all of the pixels (such as seasonal changes in ground surface temperature). The sites within reach of TRMM (between 50 deg N and S), begin in January 1998, add AMSR-E data when such became available in mid-2002 (the data are merged), continue using TRMM, only, during the AMSR hiatus in 2012 and early 2013 (between AMSR-E termination and initiation of AMSR-2) and then continue to today using merged AMSR-2 and GPM. The record at higher latitude sites begins in mid-2002 (following launch of AMSR-E), and there is gap in 2012-2013 between the termination of AMSR-E and initiation of AMSR-2: no data are available at these locations for this interval. The gridding algorithm to produce the global daily images is conducted at the Joint Research Centre (JRC); the original data are near real time swath information from each sensor. A JRC document provides further information.
JRC produces a daily global grid at 10 km (near the equator) pixel resolution, and provides daily ratio data for fixed pixels within that 4000 x 2000 pixel grid. At lower latitudes, the coverage is less than daily from AMSR-E and AMSR-2: River Watch Version 3 uses a centered, 7-day running mean to avoid such data gaps and because river discharge exhibits strong temporal autocorrelation. At the JRC, all ratio values are calculated from values retrieved from near real time swath data products, and then projected in-house to the JRC grid. When multiple samples for one pixel are available in one day, the latest sample value is used. The 7-day centered averaging, however, does add one source of error: flood peaks are slightly attenuated if they persist for less than 7 days ( the temporal location of the peak is preserved).
At the Flood Observatory, the ratio data from the JRC are ingested once each day, and the html displays for each site are updated and added to the Observatory web site at 14:30 Mountain Standard or Mountain Daylight Time. Each site includes two html pages: one provides plots of the results but also some tabular data, the second, "data" html presents the rating curve and access to the complete record of satellite-measured discharge. For comparison purposes, a reference 20th percentile of the measured discharge for each day of the year, 2000-2010 is also provided for each day and provides a useful low flow threshold.
The River Watch approach is novel in that microwave sensors designed to monitor the atmosphere and precipitation are here employed to directly measure river discharge changes and watershed runoff on the ground. Thus, in order to observe atmospheric conditions, such as precipitation, ground-sensing channels were included on AMSR, TRMM and now GPM: these provide the background component of upwelling microwave radiation against which precipitation can be observed via other microwave frequencies. River Watch uses just the ground-sensing channel.
River Watch Version 2 replaced an earlier version that used only AMSR-E, a somewhat different signal algorithm, and a different calibration approch. River Watch 3 incorporates many improvements in the signal processing and the graphical output, is utilizing a standard 7-day forward running centered mean, and provides quality assessments, including overall Excellent, Very Good, Good, Fair, and Poor ratings. These are based, in equal measure, on: a) the observed signal/noise ratio at the site, and b) the degree of correlation of the signal to the independent, WBM (climatology-driven) discharge results. A sample Version 3 site is online at: http://floodobservatory.colorado.edu/SiteDisplays/256.htm.
In late 2015 and early 2016, Version 3 is gradually replacing Version 2 as each satellite gauging site is individually revised to the new version. The new sites also include links to "Predicted Flooded Areas" maps.
Version 3.4 notes (November 14, 2016). Fixes and improvements to Version 3 are now also being implemented on a site by site basis as Version 3.4. These include: 1) extension of all displays and data outputs to end of 2018. 2) Addition of a flood magnitude statistic. 3) Nash-Sutcliffe statistic now provided for the complete model/observation paired values, n - 180, 4) A plot is now provided showing a time series of flood magnitude values.
Satellite Gauging Site Selection
It is important that the M pixel be located to avoid saturation (complete filling of the measurement pixel by water) during flood events. It is also important that the pixel include a relatively uniform stretch of river without major tributary junctions, or nearby streams, or other variable water bodies that may change in surface area without directly indicating river discharge change. Local site characteristics are known to strongly affect the sensitvity and signal/noise ratio of this method (as is the case for ground gauging stations). Each site display thus provides a link to visualize the measurement pixel being used as the gauging site, and work is underway to evaluate the various local factors affecting site results. In any case, careful quality control must be provided at each, beginning with visual examination of the site characteristics. We are still performing such work, so that some sites may be deleted in the future. However, there are thousands more of potential gauging sites that can be added.
Detection of River Ice
The initiation and removal of river ice cover can also be detected: ice breakup immediately affects the C/M ratio as low-emission water replaces ice within the pixel. See Brakenridge and others (2007) for the initial research describing this approach, Brakenridge and others (2012) for updated information, and another technical report by Kugler and De Groeve (2007). Because River Watch 3 uses source data processed at the Joint Research Centre and provided as the signal (C/M) ratio, a special filter is needed to detect ice-covered time periods and remove such from the data output. Both the C and M values exhibit large annual variation as the land warms in the spring and cools in the autumn. At the time of spring warming and ice removal, the values both rise and become nearly identical (ratio approaches 1). Then, the ratio becomes suddenly much smaller, as surface water appears at the site and increases in extent. The process reverses in the autumn. We locate the transition point in each season by locating the maximum ratio value within the spring and autumn seasons, and only compute discharge values between the times of these signal maxima. Both the unfiltered and filtered information is shown on each display using this filter. A constant base flow/sub-ice flow is assumed for the period of ice cover and as estimated individually from the modeling results for each river. See http://floodobservatory.colorado.edu/SiteDisplays/320.htm for an example.
Accuracy Assessment
Remote Sensing Comparisons to Ground Data and to WBM Modeling
Within the U.S., where abundant gauging station-based discharge data are available, the accuracy of the River Watch measurements can be directly evaluated. Nash-Sutcliffe (N-S) statistics are commonly used to evaluate time series from hydrological model outputs. They can also compare remote sensing information to observed ground truth (local gauging station data). At River Watch sites, there are commonly at least 10 years of daily data for such comparisons. Based on such, an accuracy classification of River Watch site data outputs is implemented using these statistics. From the Wikipedia link provided above: "Nash–Sutcliffe efficiencies can range from −∞ to 1. An efficiency of 1 (E = 1) corresponds to a perfect match of modeled discharge to the observed data...Essentially, the closer the model efficiency is to 1, the more accurate the model is."
N-S values of 1 thus indicate a perfect fit; and values as low as .75 are commonly used in the literature to indicate that a model, or, in this case, the remote sensing, is performing very well in predicting the actual time series. Therefore, N-S statistics over the calibration period are computed for all sites where ground truth data are available: thus, for the monthly maximum, mean, and minimum daily discharges for 2003-2007 (5 years, 180 data pairs). Where ground station data are available, they are also computed for the corresponding monthly runoff (mm) time series. In the large majority of River Watch sites, where co-located ground station information is not available, N-S statistics instead compare the remote sensing (as predictor) to the WBM model results. As noted, high N-S values indicate that both the modeling and the remote sensing are accurately tracking discharge. Low values indicate that either the modeling, or remote sensing, or both, are not accurately tracking discharge. In cases where ice cover prevails seasonally, those months are not used in the statistics.
As noted, a scatter plot of all 180 values is also provided. The r2 correlation coefficient also provides a consistent, globally-applicable measure of model/remote sensing agreement. This statistic is 1/2 of the averaged overall site accuracy assessment provided at the top of the River Watch 3 displays. It is transformed to an integer as follows:
>.8, Excellent, "5"
>.7, Very Good, "4"
>.6, Good, "3"
>.44, Fair, "2"
<.44, Poor, "1"
The 5 year test period and monthly time series plot also allow the timing of the model output to be compared to the remote sensing visually. For larger rivers, there may be a clear temporal offset visible: e.g. seasonal peaks in daily maximum, mean, and minimum flows as modeled may lag by one time step that measured by the remote sensing. Not uncommonly, without correction, the offset causes very low r2 and N-S values, but adjusting the modeling forward or backward (model routes discharge too slowly or too quickly) produces high values; e.g., r2 changes from .2 to .7. Where this is the case, the adjusted model time series is used and the temporal offset is noted.
Evaluation of Site Sensitivity and Noise Characteristics
A simple integer signal/noise rating is also computed, as follows: 1) The total observed range over 5 years in the signal, in the River Watch array, varies between values as high as .3 (strong signal) to very low values (.01). The former indicates a sensitive site where flow area changes are significant and being observed. 2) The average observed day-to-day departure over 5 years is the "noise" statistic used. Most rivers monitored by River Watch exhibit long periods of relatively stable flow (even though floods do cause some periods of strong daily variation). Thus, the daily variation may indicate the background level of noise at the site. 3) The ratio of the two provides a measure of signal to noise as defined. Thus, the S/N value compares the signal changes induced by the actual discharge variability, seasonally, and over the 5 year period, to the changes that are produced daily by other variables, including from the sensor.
This rating, which refers only to the remote sensing data, was established by computing S/N for all sites in the array and assigning a ranking, as follows:
>20, Excellent, "5"
>15, Very Good, "4"
>10, Good, "3"
>5, Fair, "2"
<5, Poor, "1"
The arithmetic average of the S/N and the model/remote sensing integers is used for the overall accuracy assessment provided for each River Watch 3 gauging site. Thus, an overall "excellent" site assessment requires high signal/noise and model/remote sensing agreement. A "good" assessment may indicate either good signal/noise and model/remote sensing values (both), or, potentially, a high signal/noise and low model/remote sensing agreement, or vice-versa. In the latter cases, the site may be noisy, day to day, but still tracking model results on longer time scales, or it may be accurately tracking discharge via a sensitive signal, but the model may not be producing good results. Users of these data are advised to examine both components of the overall assessment provided.
Sample Comparisons to Ground Stations
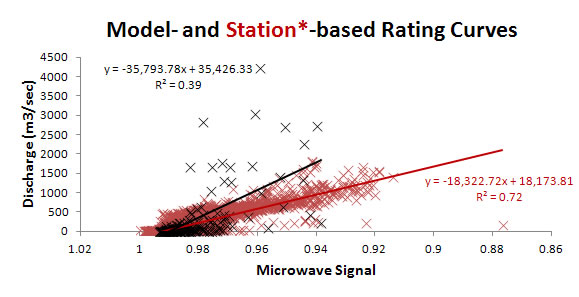
Comparison of results from satellite gauging sites to co-located ground gauging station data is an ongoing project and is also described in several publications (see links above). Such comparisons continue to indicate the importance of local site factors in affecting accuracy of River Watch 3 output. Some sites online are performing very well, others are performing only poorly. As well, there is some evidence of consistent WBM model bias: towards generally higher flood discharges than actually occur, with the difference increasing with higher flow (example comparison below). Thus, we anticipate that, even when model and remote sensing time series are very strongly correlated, the model-based rating curves may somewhat over-estimate runoff volumes and daily discharges (especially flood discharges). However, bias in the model-based rating curves should have relatively little effect on the measurement of relative flood peak magnitudes, on the timing and shape of flood hydrographs, on the calculation of the flood recurrence intervals, or on the low flow thresholds.
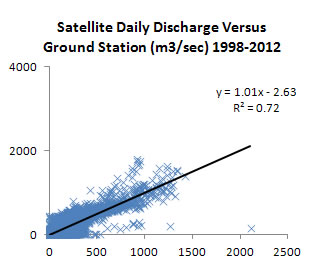
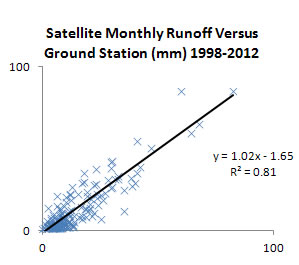
Example: River Watch Site 446, Trinity River, Texas, USA. Left shows two scatter plots as per text above and associated rating equations and R-squared values. Center shows the independent daily discharge output of River Watch 2 remote sensing at this site, as compared with the ground gauging station. Right shows the independent monthly runoff output, again as compared to that of the ground station.
The (red line) rating, based on the ground station, was used in center and right plots. It is clear at this site that the remote sensing discharge indicator (the C/M ratio) quite accurately tracks river discharge as independently measured. However, it is also clear that reliance on the WBM model rating would result in consistent, somewhat too-high discharge and runoff values (left plot). As well, and unlike the case at many other satellite gauging sites, the WBM results here are not strongly correlated to the discharge signal (left plot): the global model is not performing very well in predicting flow at this location.
Other Issues
1) In agricultural areas, irrigation of the measurement and comparison pixels can strongly affect the signal. 2) Intermittent instrument noise (seen in the signal data as occasional, one day very low ratio values) occasionally produce intermittent positive spikes in discharge. We are working to filter such instrument noise and site displays will note employment of such filters. 3) For high latitude rivers, further work is underway to validate and improve the ice cover detection algorithm. 4) Because a centered 7 day average is used for all River Watch Version 3 displays, today's discharge can make use of only today's information and that from 3 days prior (it is an effective 4 day average). Yesterday's value already uses today and is a 5 day average, etc. Thus, the most current discharge values are temporary, and only become permanent after they are older than three days.
Using These Data
The discharge and runoff data output from the River Watch 2 processor is an experimental product and is provided for free public access, without any warranty or claim as to its accuracy. The processor uses as its front end the "signal data" from the Global Flood Detection System (GFDS) at the European Commission's Joint Research Centre (GDACS project). Each River Watch display provides a link to the appropriate GFDS output page, and any interested party can obtain this raw signal data from those locations. There are many other GFDS measurement sites (~10,000), and many opportunities for addition of new sites. However, many of the existing GFDS sites are poorly located, which any user can verify by using the GoogleMaps displays of the site locations. For example, some GFDS sites are not located on rivers.
In collaboration also with the JRC/GFDS team, we attempt to make Flood Observatory processing of the GFDS understandable and replicable to all end users. Please email Robert.Brakenridge@Colorado.edu for additional information.
There are many potential operational uses of these data (flood warnings, flood and flood risk evaluation, validation of streamflow prediction models, hydropower siting studies, water quality studies, etc). However, users should be aware of the limitations. Some suggestions from those who have developed this capability and data service:
1) Site displays include accuracy assessments, and users should be aware that sites with fair or poor ratings may not be useful at all. In some cases, however, these sites have been retained in the global array because the basis for a low assessment is only the model/remote sensing scatter in the rating curve. This may reflect problems with the runoff model rather than the remote sensing. In this case the site is retained, as the problem is an unreliable rating curve, which may be remedied in the future. Also, the site may still quite reliably "flag" flood or low flow conditions.
2) Relative flood magnitudes and durations are consistent, at-a-site, and should be quite reliable, even if the rating curves are poorly constrained. This valuable capability is largely independent of the quality of the rating curve.
3) Each River Watch gauging site display includes a plot of the annual and monthly runoff values for the period of record, and also an evaluation of any trend in the 10 yr recurrence interval flood over the period of record. Thus, the sites are automatically accumulating runoff, and changes thereof, and any so-far visible changes in computed flood risk (based on the recent record of actual floods).
Interim Updates
March 22, 2016: Version 3.1 is gradually being implemented, site by site. It now includes: 1) extension to the end of 2017, 2) forward running instead of centered 7 day means, 3) a mean annual discharge value calculated for 1998-2015 (fewer years for higher latitude sites due to the interuption in data collection, Oct. 3, 2011-March 31, 2013.
Acknowledgements
This is a cooperative project between scientists at the University of Colorado, Boulder, CO, USA; at GDACS-GFDS (Global Disaster Alert Coordination System, Global Flood Detection System), European Commission Joint Research Centre, Ispra, Italy; at the University of Alabama; and at the Jet Propulsion Laboratory. The Dartmouth Flood Observatory at the University of Colorado is supported in part by grants from NASA. We wish to thank Dr. Robert Adler, University of Maryland, for his suggestion that the TRMM sensor data could be used in addition to that from AMSR-E.