Work supported by the NASA Applications Program
Data Credits and processing details:
LANDSAT 8
Landsat 8 data are provided by the United States Geological Survey Hazards Data Distribution System (http://hdds.usgs.gov/hdds2/). Landsat 8 is jointly managed by NASA and the United States Geological Survey.
Method of Landsat water/land classification and map production: 1) Landsat bands 3 (green), 0.53-0.59; 5 (near infrared), 085.-0.88; and 6, (short-wave infrared), 1.57-1.65, of the Operational Land Imager (OLI) sensor were used to produce a color composite for quality control purposes. 2) The following processing steps were performed to produce classified water pixels: a) Using Envi™, an NDVI-like product was produced: band 3-band 5/band 3 + band 5. b) Water pixels were identified via a threshold: "water" = < -.04 of this ratio result, c) GIS (.shp files) are then produced within Envi™ and outline the preliminary water areas. d). Within GIS software, the polygons are displayed over the tif image, and evident cloud shadow-sourced and other error polygons are deleted. This method is designed for rapid, operator-assisted transformation of Landsat image data into map information. The band 3 / band 5 information when processed in this way avoids most cloud shadow (false positives) and provides sensitive water/land discrimination.
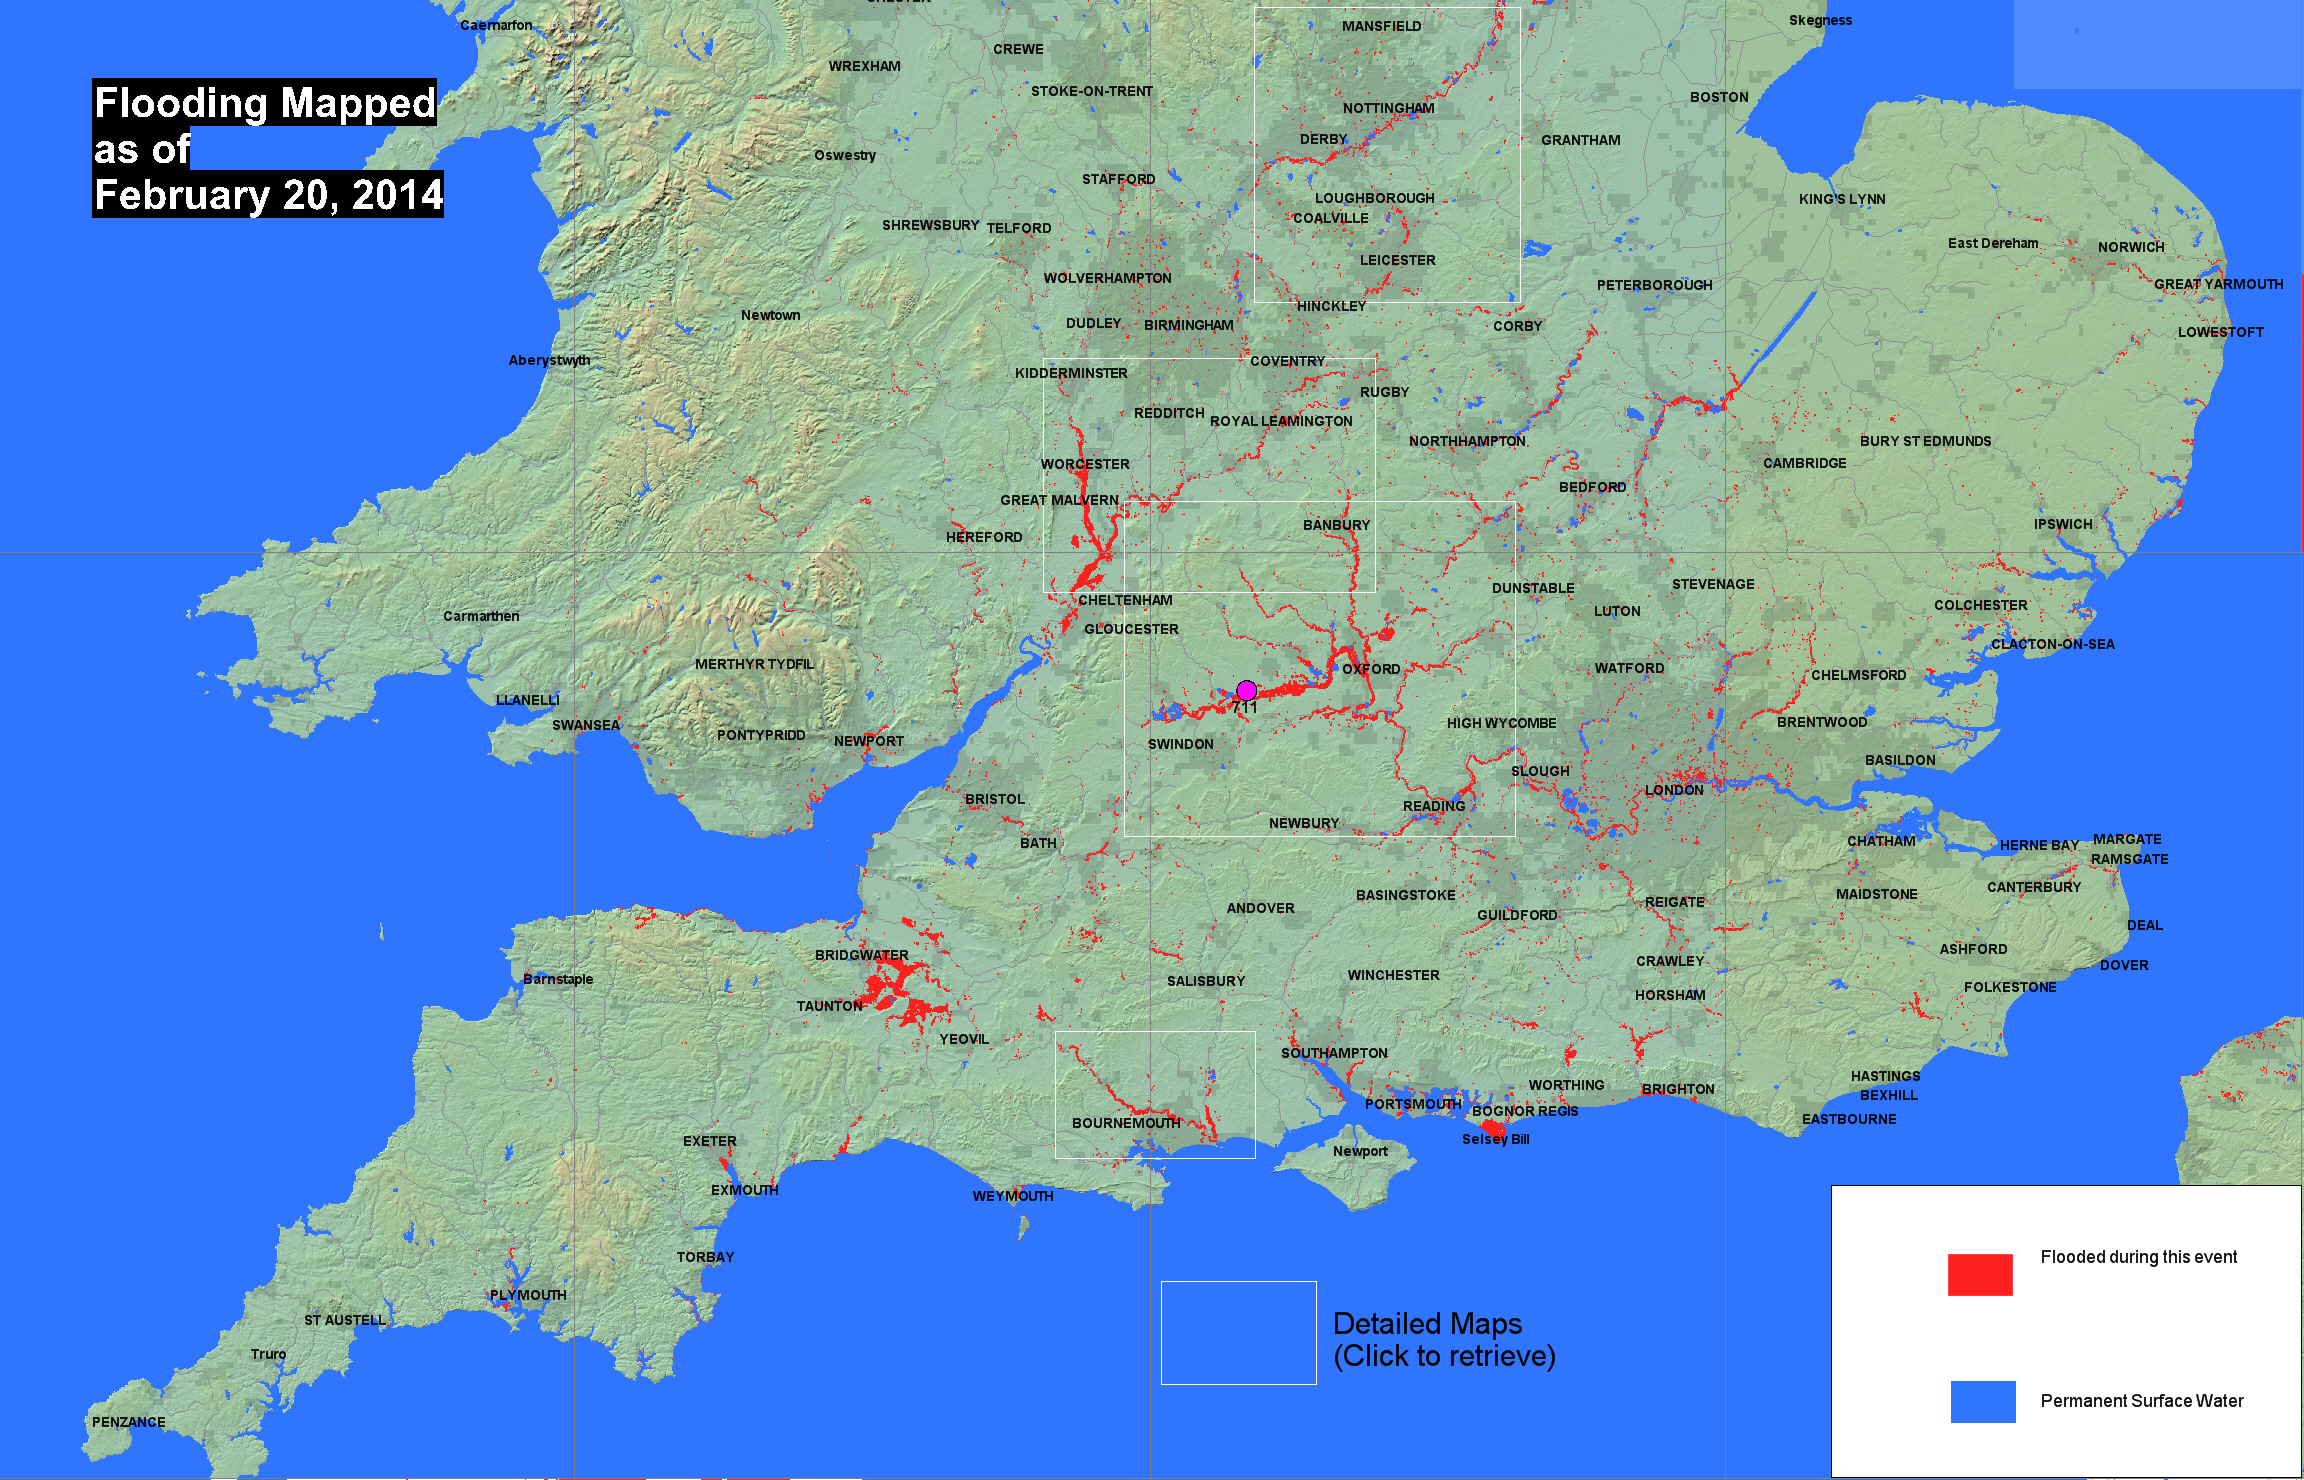
RIVER WATCH MEASUREMENT SITES.
At selected locations, a time series of satellite microwave-based daily river discharge measurements are available and define the magnitude of mapped flooding. Click on the colored dots: Yellow dots: low flow (<50 % mean daily runoff for this date); Blue dots: normal flow; Purple dots: moderate flooding (>1.33 yr recurrence); Red, major flooding (> 5 yr recurrence). See River Watch global display for more information. Sample output below (for site #711) indicates that this flood reached to nearly the computed 10 yr recurrence interval event at this location.

Citation for this display and map: Brakenridge, G.R., Slayback, D., Kettner, A.J.,Policelli, F., De Groeve, T., and Cohen, S., Rapid Response mapping and measurement of the 2014 flooding in the United Kingdom, Dartmouth Flood Observatory, University of Colorado, Boulder, CO, USA (http://floodobservatory.colorado.edu/RapidResponse/2014UK4111/2014UK.html). Maps and associated data generated at DFO are available for public use and licensed under a Creative Commons Attribution 3.0 Unported License.
Acess maps from other organizations