Work supported by the NASA Applications Program. Mapping is in progress.
Data processing details:
MODIS
This map may incorporate 250 m spatial resolution MODIS Rapid Response Subset data: provided by NASA's LANCE system: https://earthdata.nasa.gov/data/near-real-time-data/rapid-response/modis-subsets. It may also incorporate data from an automated MODIS 250 m flood processor usinig NASA LANCE data (see appropriate Surface Water Record display for more information, links to those component data, and technical description).We acknowledge the use of data from the Land Atmosphere Near-real time Capability for EOS (LANCE) system operated by the NASA/GSFC/Earth Science Data and Information System (ESDIS) with funding provided by NASA/HQ.
When the automated processor is not detecting water due to frequent and heavy cloud cover, individual MODIS scenes and operator-assisted mapping can provide better results.This method of water/land classification and map production from the Rapid Response subset data is effective: a) The subset geotiff data, bands 721 composites, are used. b) A band math/ratio and threshold approach is applied within Envi™ as follows: 1) Band math: "(float(b2) gt 200 ) or (((float(b1)+1)/(float(b2)+80)) gt .7) or float(b3) gt 17", where b2 = band 1; b3 = band 2; b1 = band 3 of the three channel RGB (bands 1,2,3) geotiff files. 3) This produces a binary geotif file with 0, black, as water, and 1, white, as land. 4) To remove cloud shadows, two images closely spaced in time (within one day) are processed, the classification results added, and the results added. Water must retain values of 0. 5) A GIS polygon (.shp format) is then fit around the water pixels. This procedure is not applied if cloud shadows are absent or minimal.
LANDSAT
Landsat 8 data, if incorporated in the mapping, are provided by the United States Geological Survey Hazards Data Distribution System (http://hdds.usgs.gov/hdds2/). Landsat 8 is jointly managed by NASA and the United States Geological Survey.
Method of Landsat water/land classification and map production: 1) Landsat bands 3 (green), 0.53-0.59; 5 (near infrared), 085.-0.88; and 6, (short-wave infrared), 1.57-1.65, of the Operational Land Imager (OLI) sensor were used to produce a color composite for quality control purposes. 2) The following processing steps were performed to produce classified water pixels: a) Using Envi™, an NDVI-like product was produced: band 3-band 5/band 3 + band 5. b) Water pixels were identified via a threshold: "water" = < -.04 of this ratio result, c) GIS (.shp files) are then produced within Envi™ and outline the preliminary water areas. d). Within GIS software, the polygons are displayed over the tif image, and evident cloud shadow-sourced and other error polygons are deleted. This method is designed for rapid, operator-assisted transformation of Landsat image data into map information. The band 3 / band 5 information when processed in this way avoids most cloud shadow (false positives) and provides sensitive water/land discrimination.
OTHER SENSOR-BASED INUNDATION MAPPING
Other organizations engaged in flood inundation mapping make their results available to the public. In particular, and only where noted in the map legend or symbology key, our rapid response maps may include information from European Commission's Copernicus Emergency Management Service. These data may be based on TerraSAR-X or Radarsat synthetic aperture radar imaging, or on high resolution imaging satellites such as SPOT. Such collaboration is also being facilitated by the Global Flood Partnership.
Maps and associated data generated at DFO are available for public use and licensed under a Creative Commons Attribution 3.0 Unported License.
Access the May 19 map in GoogleEarth kmz format

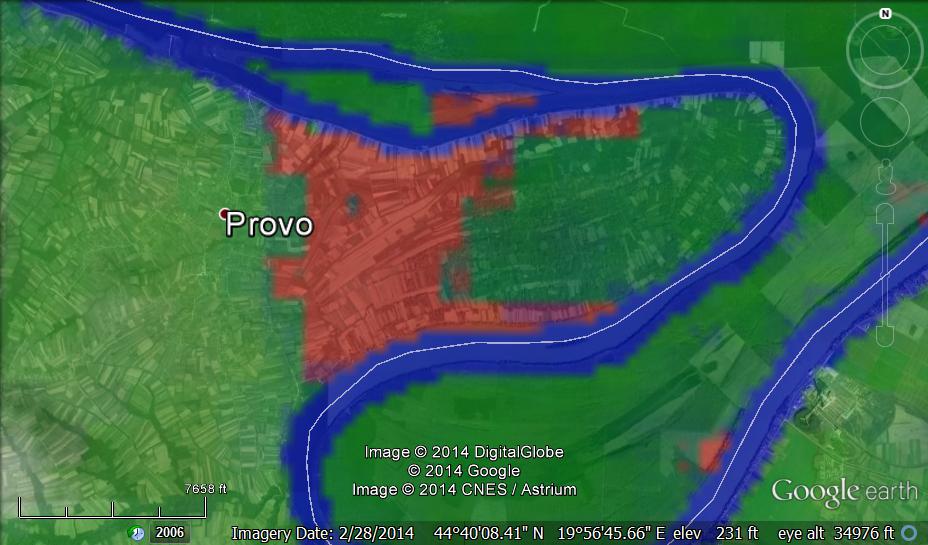
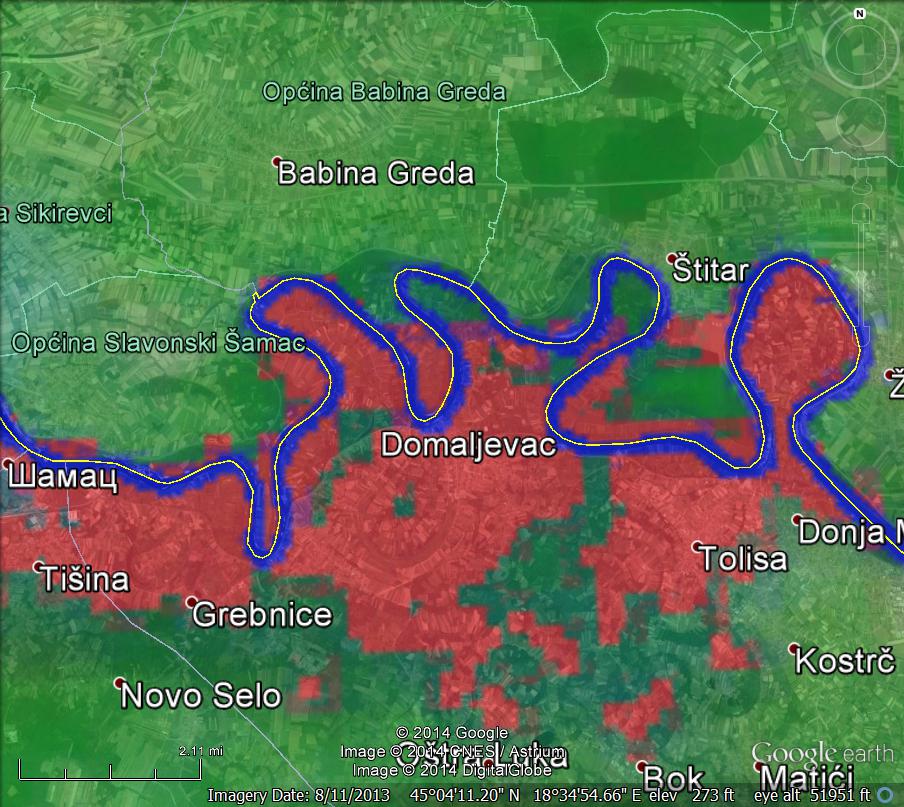
Below: sample results from NASA's automated MODIS processor (from May 20, 2014, kmz file).
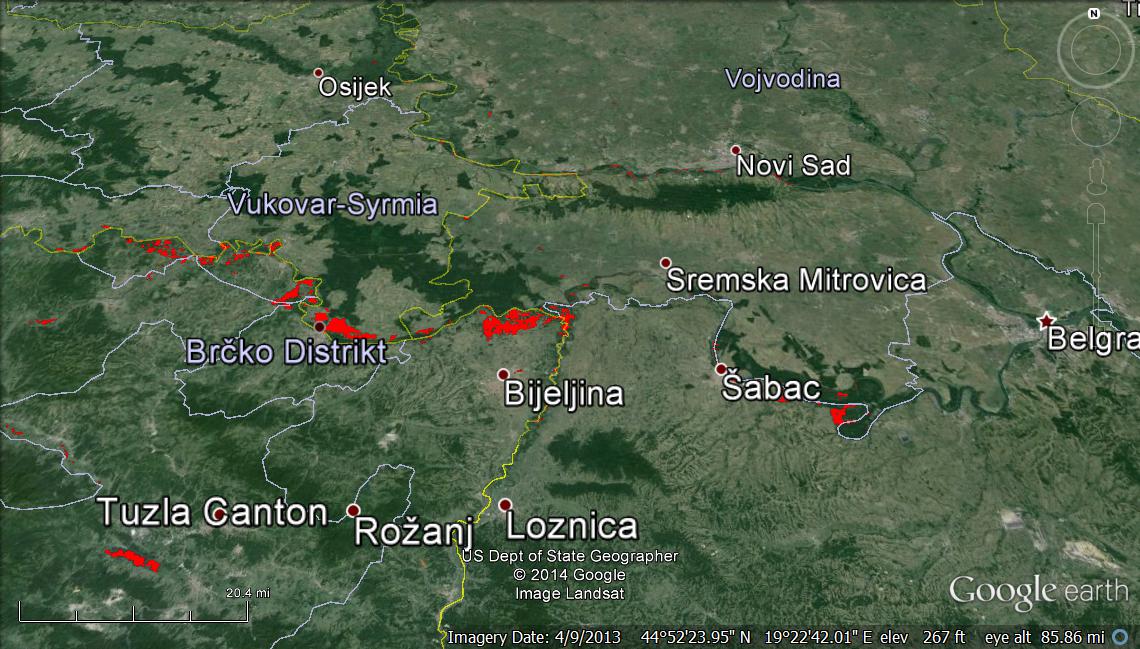
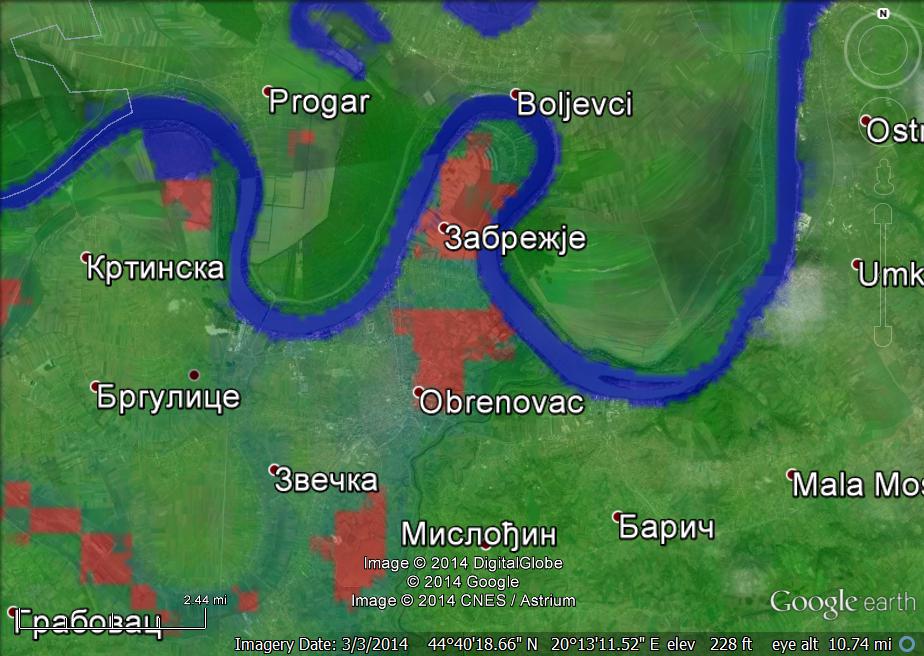
Below: other details, from the Flood Observatory MODIS kmz file for May 19, 2014.