Other information (the Flood List)
Deforestation in the Andes Triggers Amazon “Tsunami”
"Catastrophic Floods Threaten Tsimane Livelihoods"
Reuters, "Flooding in Bolivia"
Prensa Latina, "Bolivia suffers massive livestock loss from flooding"
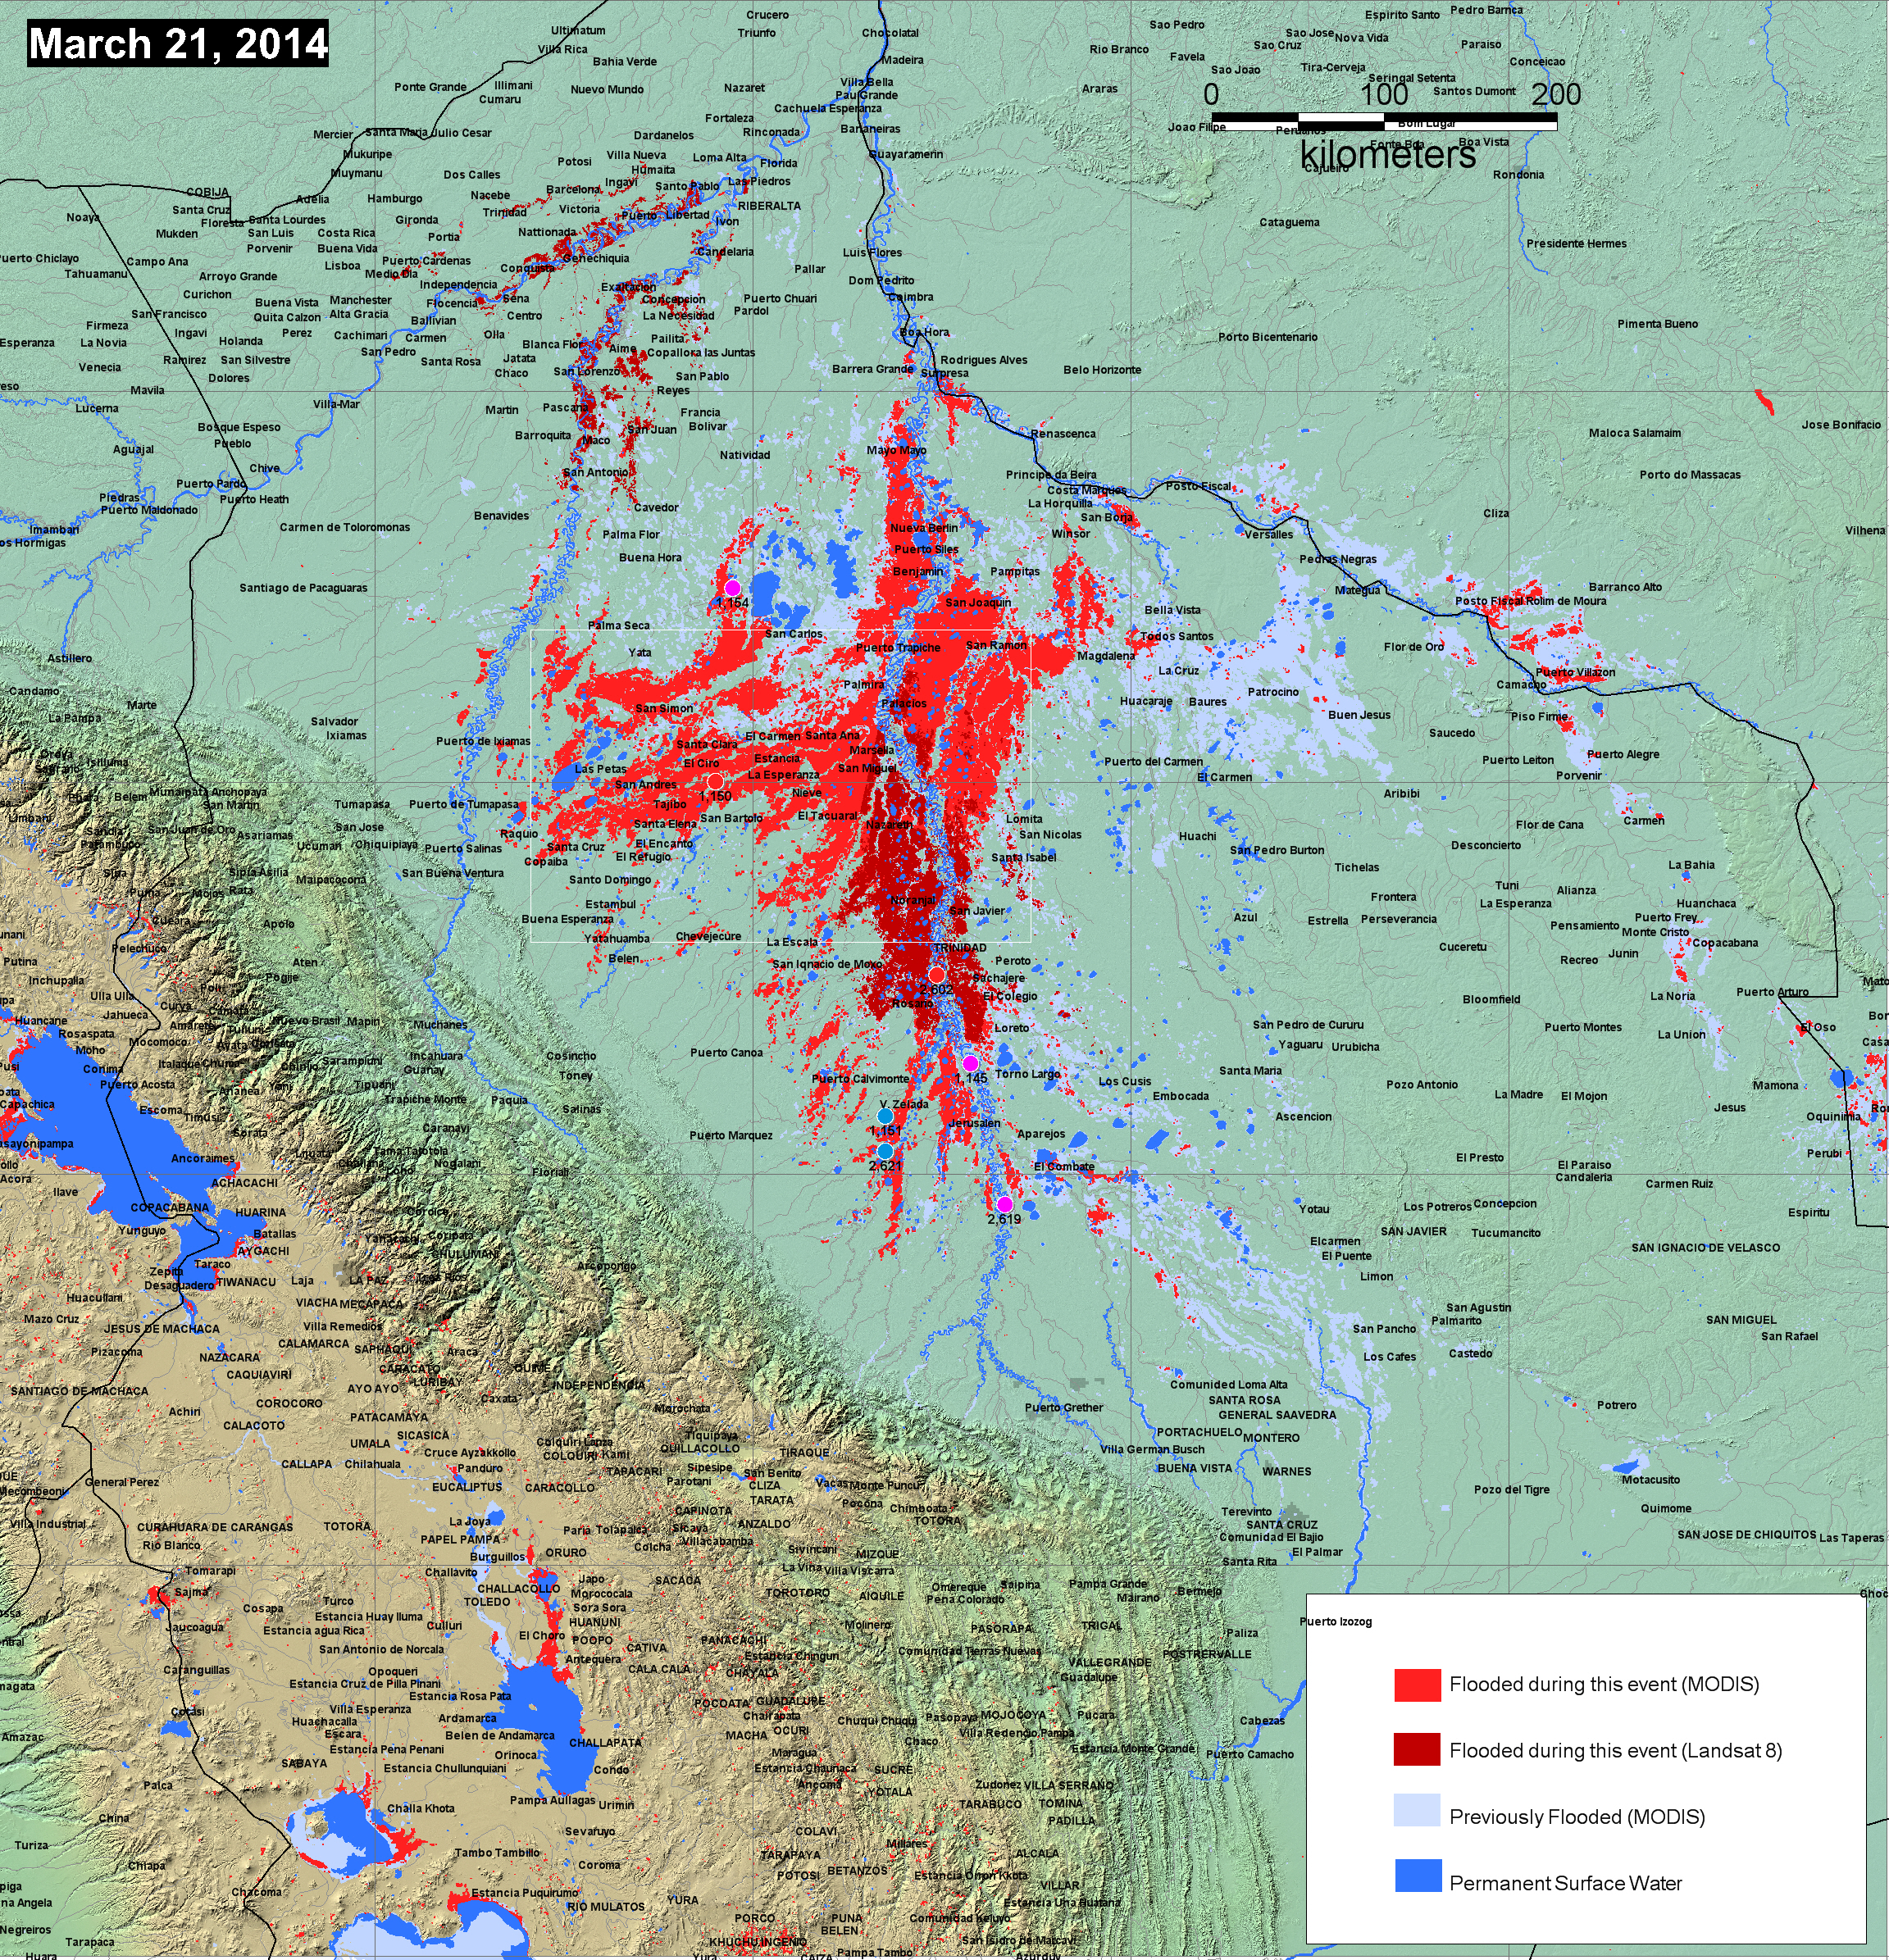
GDACS Satellite Mapping Overview
Work supported by the NASA Applications Program and CAF, the Development Bank for Latin America in collaboration with GeoSUR.
Data Credits and processing details:
MODIS
This map may incorporate 250 m spatial resolution MODIS Rapid Response Subset data: provided by NASA's LANCE system: https://earthdata.nasa.gov/data/near-real-time-data/rapid-response/modis-subsets. It may also incorporate data from an automated MODIS 250 m flood processor usinig NASA LANCE data (see appropriate Surface Water Record display for more information, links to those component data, and technical description).We acknowledge the use of data from the Land Atmosphere Near-real time Capability for EOS (LANCE) system operated by the NASA/GSFC/Earth Science Data and Information System (ESDIS) with funding provided by NASA/HQ.
When the automated processor is not detecting water due to frequent and heavy cloud cover, individual MODIS scenes and operator-assisted mapping can provide better results.This method of water/land classification and map production from the Rapid Response subset data is effective: a) The subset geotiff data, bands 721 composites, are used. b) A band math/ratio and threshold approach is applied within Envi™ as follows: 1) Band math: "(float(b2) gt 200 ) or (((float(b1)+1)/(float(b2)+80)) gt .7) or float(b3) gt 17", where b2 = band 1; b3 = band 2; b1 = band 3 of the three channel RGB (bands 1,2,3) geotiff files. 3) This produces a binary geotif file with 0, black, as water, and 1, white, as land. 4) To remove cloud shadows, two images closely spaced in time (within one day) are processed, the classification results added, and the results added. Water must retain values of 0. 5) A GIS polygon (.shp format) is then fit around the water pixels.
LANDSAT
Landsat 8 data are provided by the United States Geological Survey Hazards Data Distribution System (http://hdds.usgs.gov/hdds2/). Landsat 8 is jointly managed by NASA and the United States Geological Survey.
Method of Landsat water/land classification and map production: 1) Landsat bands 3 (green), 0.53-0.59; 5 (near infrared), 085.-0.88; and 6, (short-wave infrared), 1.57-1.65, of the Operational Land Imager (OLI) sensor were used to produce a color composite for quality control purposes. 2) The following processing steps were performed to produce classified water pixels: a) Using Envi™, an NDVI-like product was produced: band 3-band 5/band 3 + band 5. b) Water pixels were identified via a threshold: "water" = < -.04 of this ratio result, c) GIS (.shp files) are then produced within Envi™ and outline the preliminary water areas. d). Within GIS software, the polygons are displayed over the tif image, and evident cloud shadow-sourced and other error polygons are deleted. This method is designed for rapid, operator-assisted transformation of Landsat image data into map information. The band 3 / band 5 information when processed in this way avoids most cloud shadow (false positives) and provides sensitive water/land discrimination.
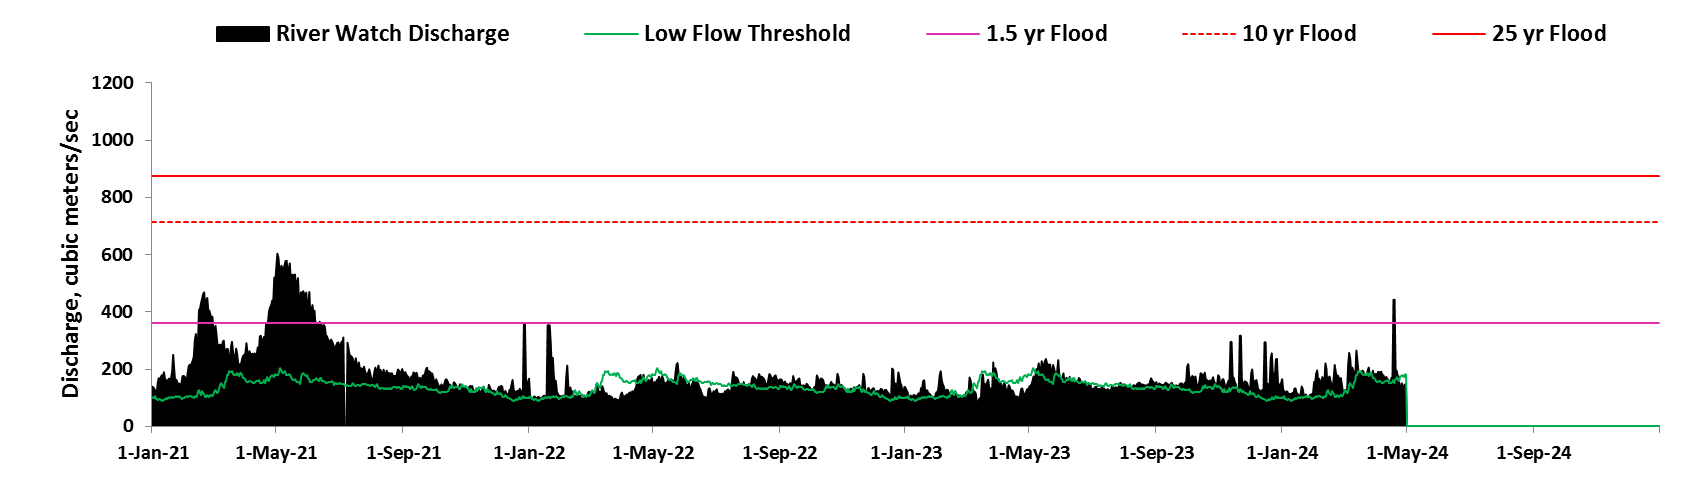
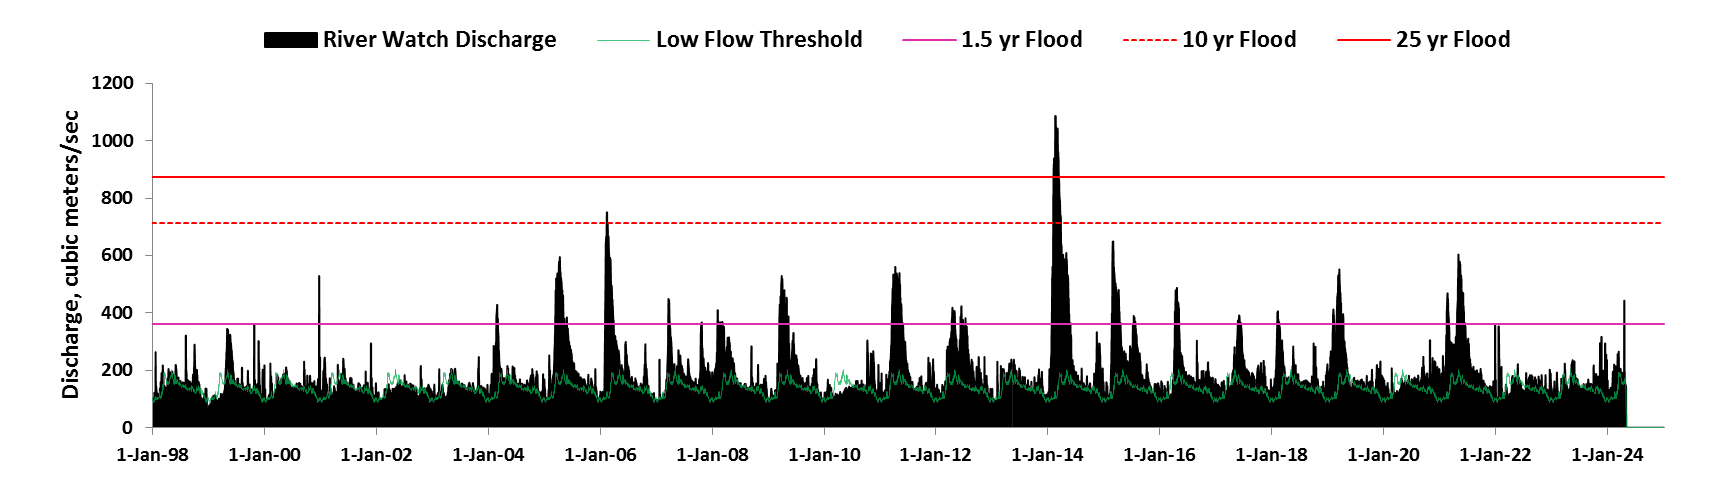
RIVER WATCH MEASUREMENT SITES
At selected locations, a time series of satellite microwave-based daily river discharge measurements are available. These define the estimated recurrence interval of mapped flooding.. Click on the colored dots: Yellow dots: low flow (<50 % mean daily runoff for this date); Blue dots: normal flow; Purple dots: moderate flooding (>1.33 yr recurrence); Red, major flooding (> 5 yr recurrence). See River Watch global display for more information. Sample output below (for site #1150) indicates that the flood was here in excess of the computed 30 yr recurrence interval event, based on period of record 1998-present.
Citation for this display and map: Brakenridge, G.R., Slayback, D., Kettner, A.J.,Policelli, F., De Groeve, T., and Cohen, S., Rapid Response mapping and measurement of the 2014 flooding in Bolivia, Dartmouth Flood Observatory, University of Colorado, Boulder, CO, USA (http://floodobservatory.colorado.edu/RapidResponse/2014Bolivia4117/2014Bolivia.html).
Maps and associated data generated at DFO are available for public use and licensed under a Creative Commons Attribution 3.0 Unported License.
Acess maps from other organizations
Access MODIS inundation limit GIS data (not from automated processor)
Access Landsat 8 inundation limit GIS data
Access Google Earth kmz Overview (lower resolution than detail Google Earth files)
Access Google Earth kmz Detail for Trinidad, Bolivia and north (or click on white rectangle in map below)
Access Geotif version of map below