
NASA-MODIS and AMSR-E Record of 2011 Flooding, Red River of the North, USA and Canada
Explanation
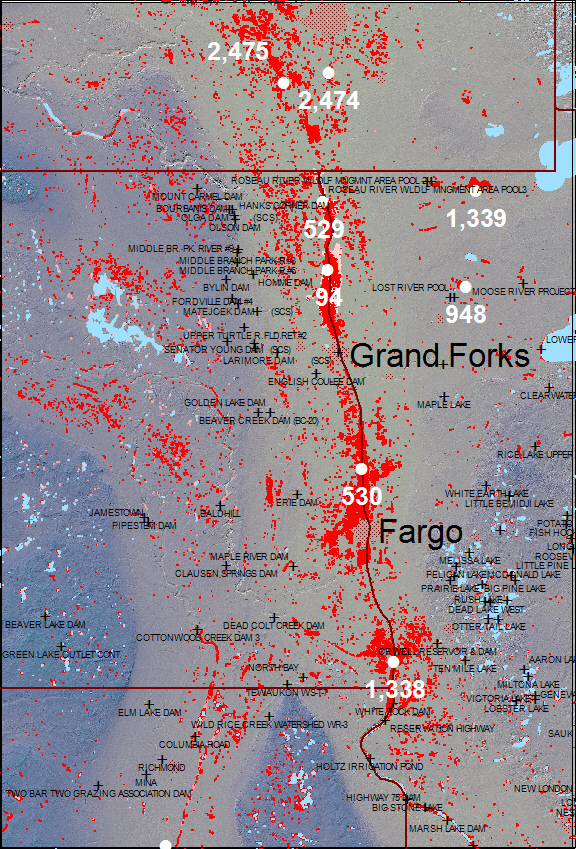
The above shows, in red, the extent of flooding as imaged on April 10-13, 2011 by the two MODIS sensors. Light blue illustrates "normal" surface water as imaged by MODIS on July 25-27, 2010, and light red is flooding in previous years (2000-2010). The shaded relief background is from topography provided by NASA SRTM data. Click on the white markers to access AMSR-E time series of estimated river discharge at these measurement points. For much larger scale maps of this and surrounding areas, move to the 5 degree maps, Surface Water Record.
NASA's MODIS sensors provide always-on coverage of the Earth's surface at a maximum spatial resolution of 250 m. Such remote sensing is often the first available after a major disaster and covers a very wide area twice daily.
MODIS band 1 and 2 data are processed at the Observatory to provide consistent water/land classification and boundaries. The data are then ingested into GIS (geographical information system) software. Output data products include map displays such as the above, but also the GIS water area outlines (in .shp and other standard formats). These can be accessed by end users in an ftp directory at http://floodobservatory.colorado.edu/GISdata/
GIS data and graphics are both online publications of the Dartmouth Flood Observatory, G. R. Brakenridge, 2011. Unrestricted use. Please cite the source.