


![]()
"Oman – Rain and Winds From Tropical Cyclone Hikaa Prompt Evacuations and Rescues 25 SEPTEMBER, 2019 BY FLOODLIST NEWS IN ASIA Tropical Cyclone Hikaa made landfall in Oman on 24 September, 2019, bringing strong winds, heavy rains and waves of 3 to 4 metres.
By the evening of 24 September Hikaa had been downgraded to a tropical storm. In a statement,the country's Public Authority for Civil Aviation (PACA) said, "The category of the tropical system Hikaa has gone back to 'tropical storm', since its windspeed around the centre now range between 45-55 knots." The storm brought with it waterlogged roads and fast-flowing wadis – some of them overflowing in Ash Sharqiyah South and Al Wusta governorates. As a precaution schools in affected areas were closed and ferry operations suspended to Masirah Island suspended.
Oman's National Emergency Management Center said around 750 people were pre-emptively evacuated and housed in 9 shelters in Al Wusta. The Royal Air Force of Oman (RAFO) carried out some evacuations in Shannah, the crossing point between the mainland and Masirah Island. Six people were rescued from a bus trapped in an overflowing wadi in Al Agaiz, Haima, Al Wusta, according to the Public Authority for Civil Defense and Ambulance (PACDA). No injuries were reported. According to PACA, the direct effects of Hikaa have since ended in Oman although further rain is possible." Quoted from Flood List.
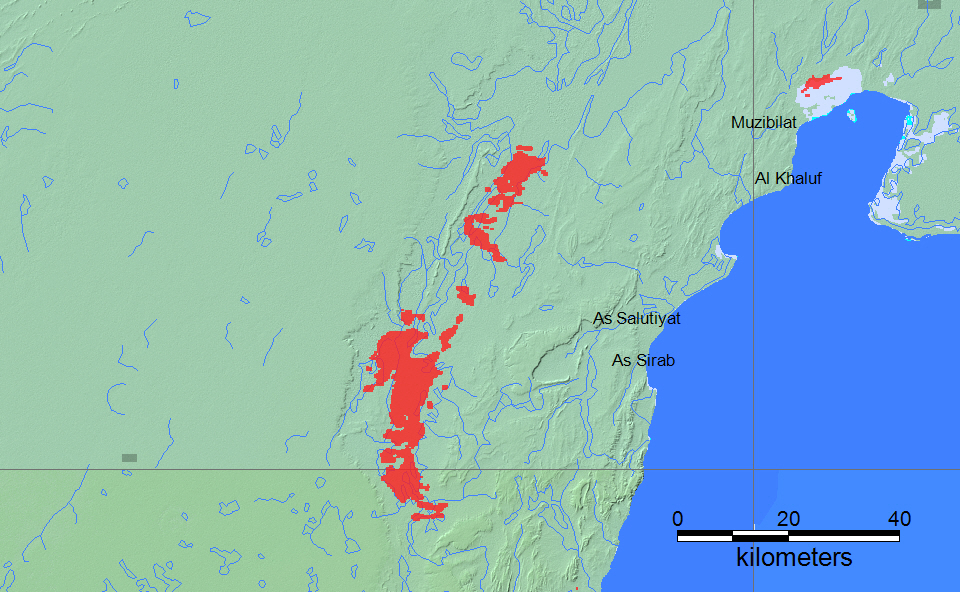
Results from the NASA-supported Global Flood Monitoring System (GFMS) at ESSIC, University of Maryland. Date and UTC time is shown. This is flooding as modeled from input precipitation data and topography.
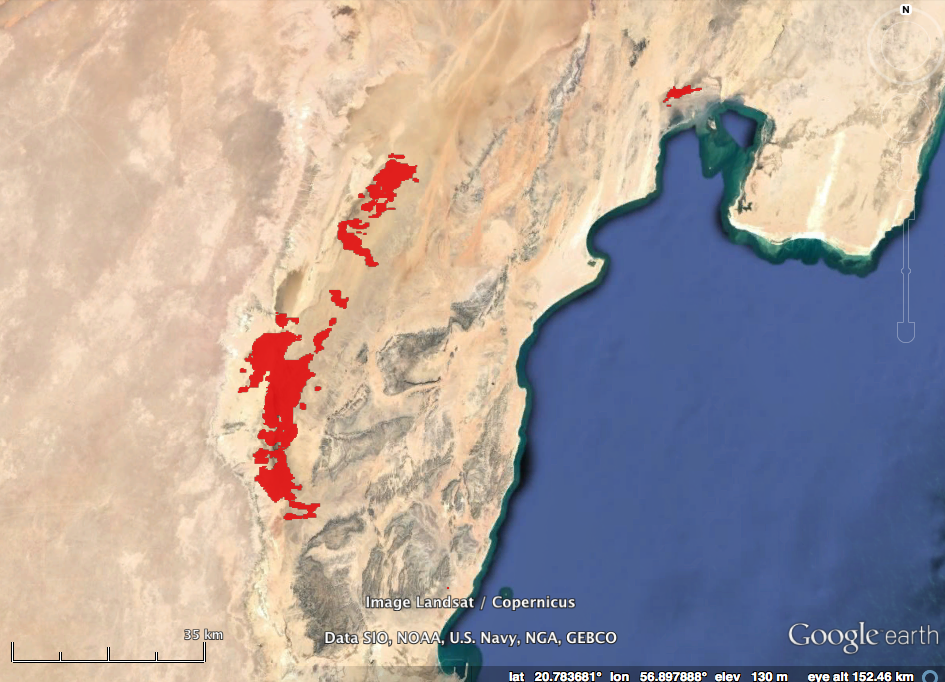
Red is all mapped flooding from this event. Darker Red is mapped flooding from non-DFO sources. Blue is a reference normal water extent. Light gray is all previously mapped flooding, since 1999. See also the DFO Web Map Server. Over the course of the event, remote sensing data are combined to show all flooded areas. A larger scale geotif version and flood and reference water GIS files are located here. Click on colored dots for access to River Watch results.
Last update of this map: September 25, 2019.
The Flood Observatory maintains a Global Active Archive of large flood events, 1985 to present. New major flood events are entered into this archive each week. A hand-drawn GIS polygon for each event outlines the region affected.
This event was selected for Observatory production of map and GIS data products. After final updating, this web page and associated image and map (GIS) files become the permanent Flood Observatory record of this flood event.
As part of collaborations with other organizations, including
GEO and the Global Flood
Partnership, the Observatory's maps are made available here to the public.
Geotif versions and GIS files are also available. With attribution, maps and
data can be used freely for non-commercial purposes. With permission, they can
be used for commercial purposes. Consult the Creative Commons Attribution-NonCommercial-ShareAlike 4.0
International License and Robert.Brakenridge or Albert.Kettner (at
Colorado.edu) if questions.
MODIS data are obtained from the NASA NRT Global Flood Mapping facility (surface water extents) and from NASA Worldview (image files); SUOMI/VIIRS image data are also retrieved from NASA Worldview.
Flood and reference water extent files (Shp and Mapinfo versions) supporting this Flood Event Map are located here.
File names commonly include the sensor source (e.g., S1 for Sentinel 1, LS8 for Landsat, MODIS, Aqua, or Terra for MODIS) and the image date, and also UTC time where available..
The NASA Earth Sciences Program, the Latin American Development Bank, the World Bank, the European Commission's Global Disaster Alert and Coordination System, GDACS, and Copernicus Emergency Management Service, the Google Earth Engine research awards program, the Committee on Earth Observation Satellites (CEOS) Disasters Working Group-Flood Pilot, the Japanese Space Agency, and the European Space Agency all have supported the Observatory's work via research grants and contracts or free satellite-derived data.
The Dartmouth Flood Observatory was founded in 1993 at Dartmouth College, Hanover, NH USA and moved to the University of Colorado, INSTAAR, CSDMS in 2010. Its operation depends on continued grant and project support. If your organization uses these data and maps, please consider becoming a Sustaining Partner and helping to sustain this effort. The institutional support of both universities is gratefully acknowledged.
">
(counting since September 25, 2019)