


![]()
March 11, 2019: "The number of people killed in heavy rains and flooding in southern Malawi has risen to 30, while the number of people affected is now approaching 500,000 with an estimated 30,000 of them displaced. Meanwhile the same weather system has also caused flooding in regions of Mozambique, where over 30,000 people have been affected and 7 deaths reported. Mozambique is now facing the impact of Tropical Cyclone Idai which formed over the Northern Mozambique Channel on 09 March, 2019." From Flood List.
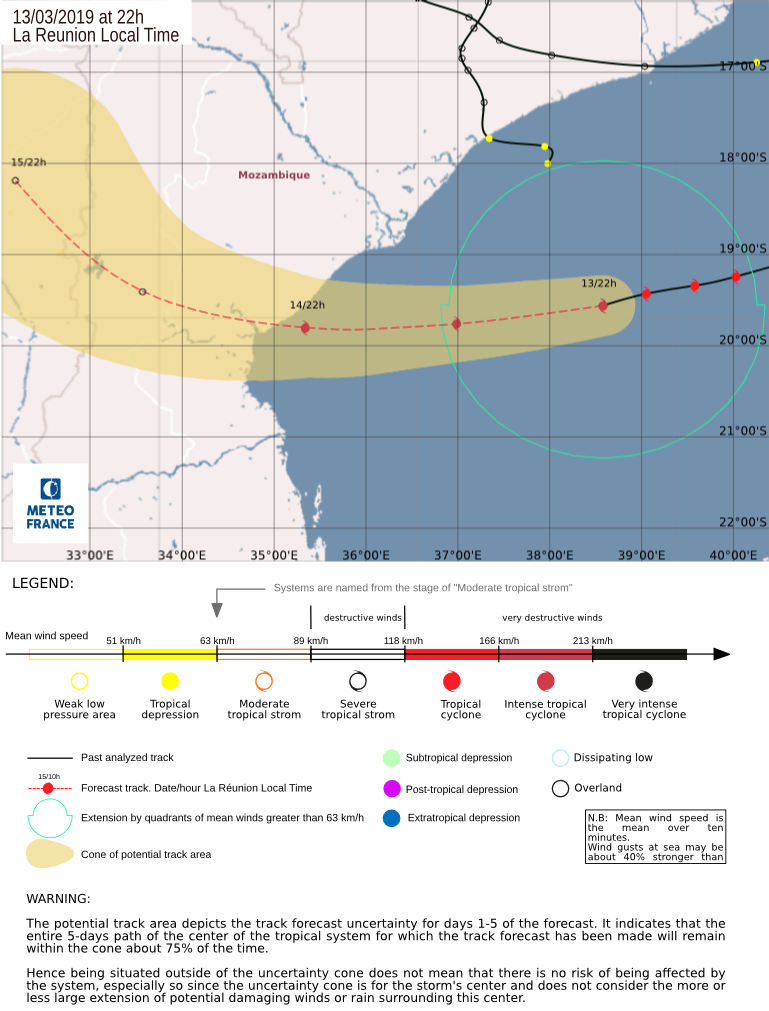
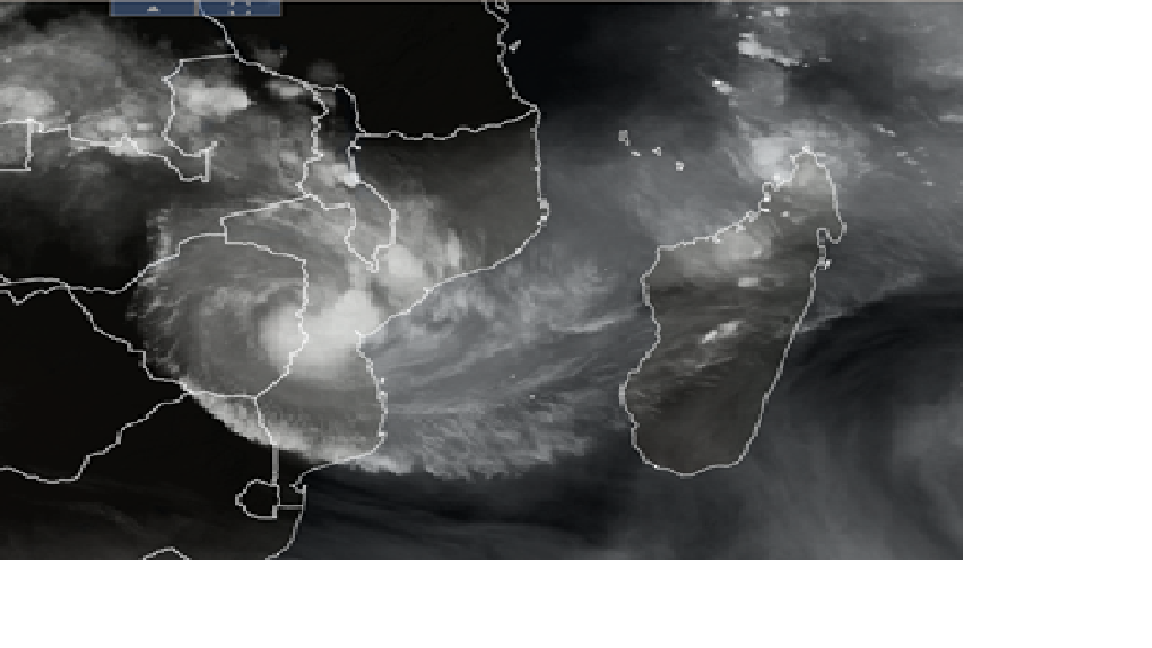
March 13, 2019: "Over the last 4 days models have been remarkably consistent in the forecast for this cyclone- Tropical Cyclone Idai. A surge is likely in coastal areas, and very heavy rains will likely hit Sofala and southern Zambezia. Below are images of the start of the heavy rainfall and the predicted storm track." DFO will include any flooding as part of event 4725. Kindly provided by Dr. Emily Niebuhr, who contributes as part of the GFP voluntary effort. On March 15, the storm was located as shown in image on right.
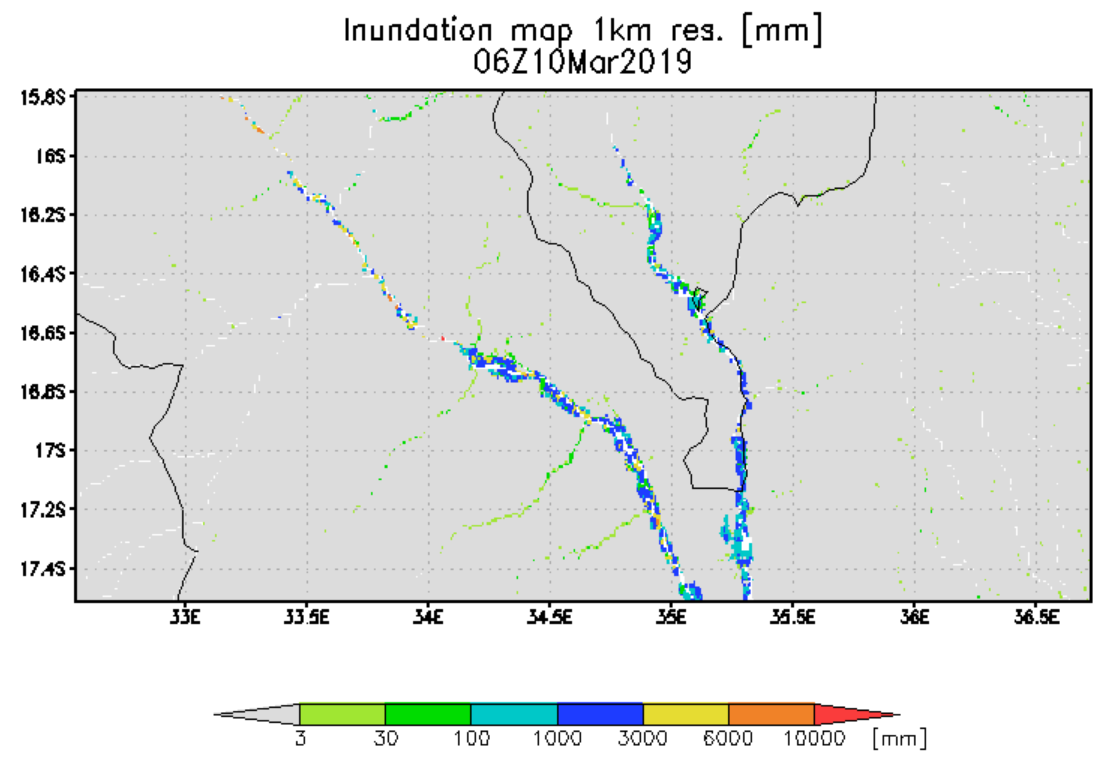
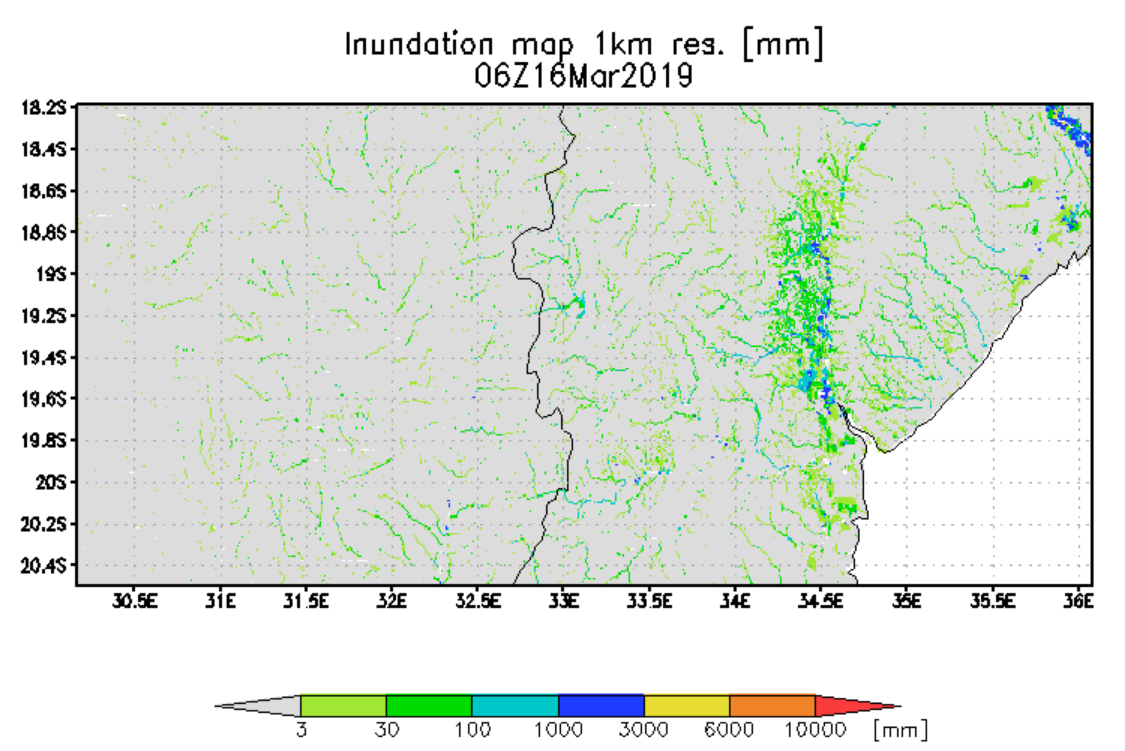
March 16, 2019: "Very heavy rains in Mozambique--over 500mm estimated by NASA IMERG over last three days focused in Pungwe River area west of Beira. Flooding estimated from GFMS as currently intense along Pungwe River and along Revue River a little to the south. from GFMS (see second figure for overview and third figure for 1 km inundation calculation. Flooding forecasts for the nest three days include a with maximum amount at 1000 mm." Kindly provided by Dr. Robert Adler (see next section below).
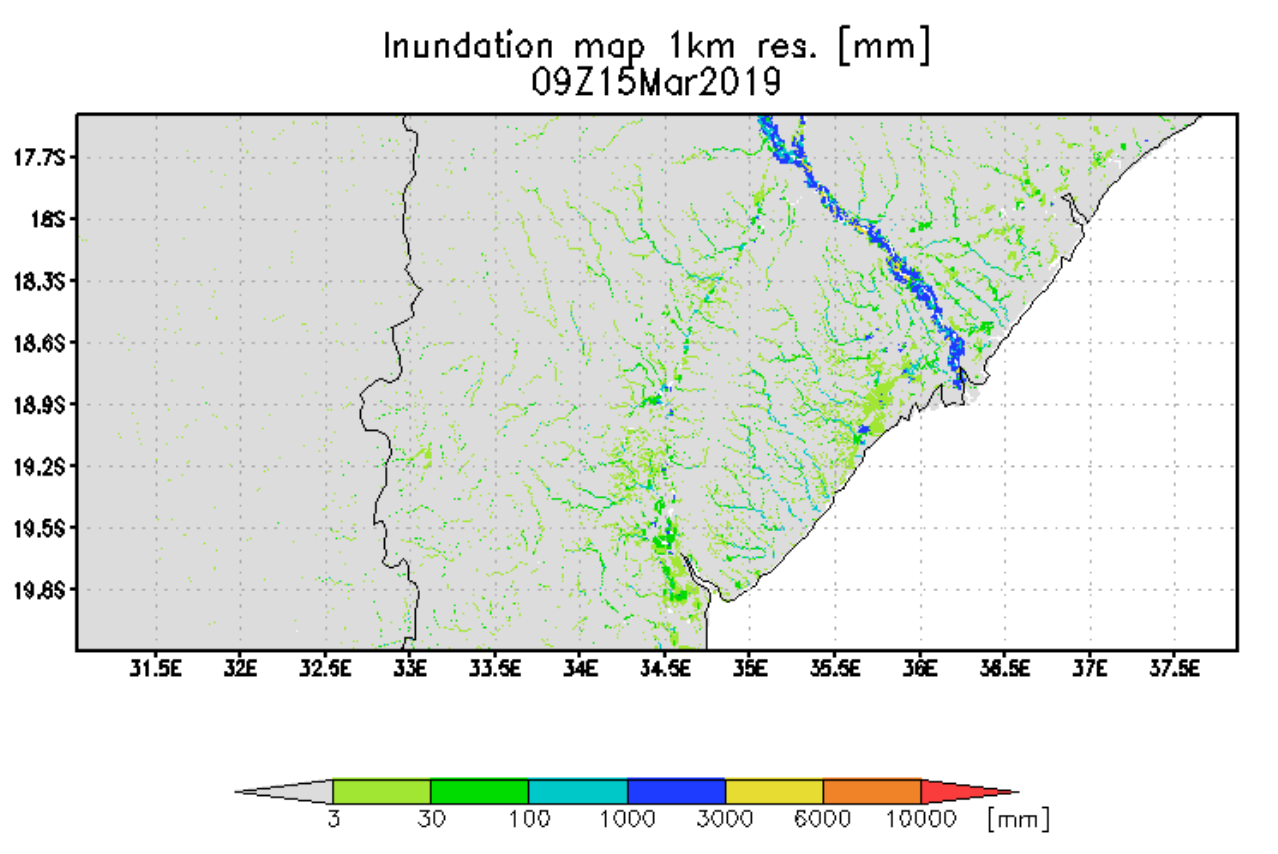
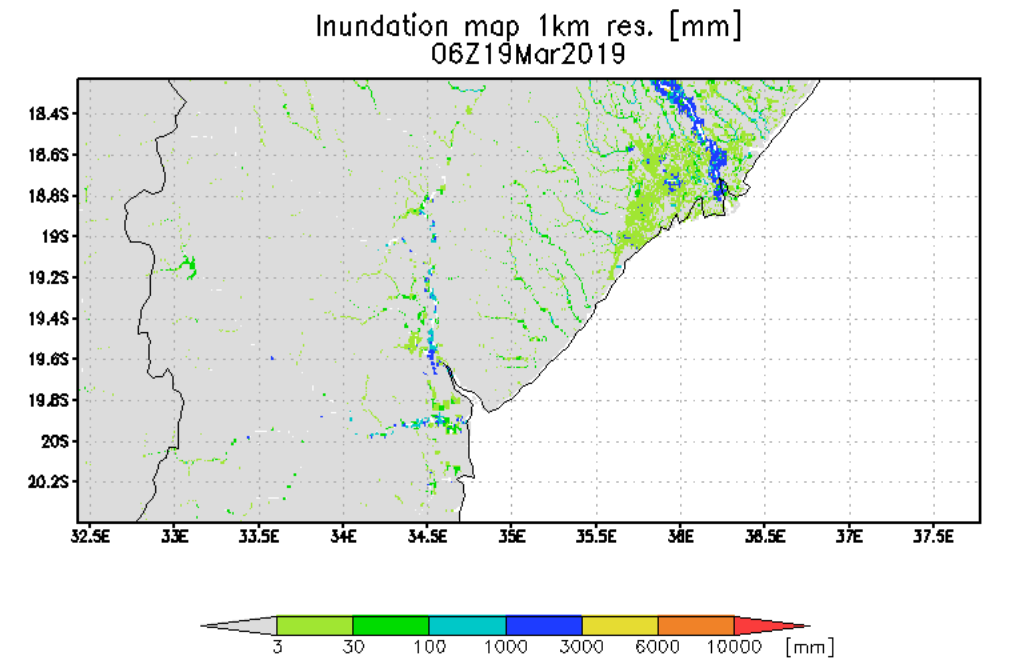
March 19, 2019: "Rain is continuing at moderate levels in Mozambique, but with more forecast over the next few days. Inundation still along Pungwe and Buzi River basins, but additional flooding now calculated toward Zambezi R. as rain has shifted toward north. Forecast rain over next 3 days indicates re-intensifying of flooding along Pungwe River.-GFMS tends to dissipate flooding conditions faster than observed, so some inundation and flooding shown for now and next few days could be underestimates". Kindly provided by Dr. Robert Adler (see next section below).
.png)
The Flood Observatory maintains a Global Active Archive of large flood events, 1985 to present. New major flood events are entered into this archive each week. A hand-drawn GIS polygon for each event outlines the region affected.
This event was selected for Observatory production of map and GIS data products.This web page and associated image and map (GIS) files become the permanent Flood Observatory record of the flood.
As part of collaborations with other organizations, including
GEO and the Global Flood
Partnership, the Observatory's maps are made available here to the public.
Geotif versions and GIS files are also available. With attribution, maps and
data can be used freely for non-commercial purposes. With permission, they can
be used for commercial purposes. Consult the Creative Commons Attribution-NonCommercial-ShareAlike 4.0
International License and Robert.Brakenridge or Albert.Kettner (at
Colorado.edu) if questions. Attribution for this map when Sentinel SAR data are
used: "Dartmouth Flood Observatory at the University of Colorado, from satellite
data provided by NASA and Copernicus/European Space Agency". When using GIS data
(see below) provided to DFO from other sources, please acknowledge original
source.
NASA Landsat 8 and Copernicus/ESA Sentinel SAR data if used in this map were obtained from the the U.S. Geological Survey Hazards Data Distribution System. and the Sentinels Science Data hub, respectively. Landsat 8 is jointly managed by NASA and the United States Geological Survey. Copernicus is supported by the European Commission. MODIS data are obtained from the NASA NRT Global Flood Mapping facility (surface water extents) and from NASA Worldview (image files); SUOMI/VIIRS image data are also retrieved from NASA Worldview.
Flood extent files (Shp or Mapinfo) supporting this Flood Event Map are located here.
These files may include high spatial resolution mapping such as from Sentinel or Landsat, or lower resolution files from MODIS. File names commonly include the sensor source (e.g., S1 for Sentinel 1, LS8 for Landsat, MODIS for MODIS) and the image date.
Maximum water extent data from the Global Surface Water Explorer may be included as part of the light gray previously mapped surface water. It is based on Landsat images at a spatial resolution of 30 m (Pekel and others, Nature 540, 418-422, 2016). The NASA Shuttle Water Boundary Data (SWBD) surface water extent (90 m resolution), blue, is derived from NASA's 11-day February, 2000, SRTM mission and was corrected using Landsat data. These data are not provided in the GIS directories.
When used in the maps, Copernicus Emergency Management Service GIS data are imported and installed in a labeled "Copernicus" subdirectory. All flood extents not created here, including those from Copernicus, are shown in a darker red color on the map but are combined into one red layer on the simplified large geotif file (if provided).. Image data sources for Copernicus mapping results may include Sentinel SAR satellites and also Cosmo-SkyMed SAR satellites. Dissemination Policy: Under Copernicus and Commission Delegated Regulations, the information produced by the Copernicus Emergency Management Service shall be made available to the public on a full, open and free-of-charge basis. Attribution of the source is required: "Copernicus Emergency Management Service, Directorate Space, Security and Migration, European Commission Joint Research Centre (EC JRC). Accessed date. http://emergency.copernicus.eu/".
The NASA Earth Sciences Program, the Latin American Development Bank, the World Bank, the European Commission's Global Disaster Alert and Coordination System, GDACS, and Copernicus Emergency Management Service, the Google Earth Engine research awards program, the Committee on Earth Observation Satellites (CEOS) Disasters Working Group-Flood Pilot, the Japanese Space Agency, and the European Space Agency all have supported the Observatory's work via research grants and contracts or free satellite-derived data.
The Dartmouth Flood Observatory was founded in 1993 at Dartmouth College, Hanover, NH USA and moved to the University of Colorado, INSTAAR, CSDMS in 2010. Its operation depends on continued grant and project support. Gift contributions can be accepted. If your organization uses these data and maps, please consider becoming a partner and helping to sustain this effort. The institutional support of both universities is gratefully acknowledged.
(counting since March 10, 2019)