


![]()
March 14, 2019: "A combination of rain, melting snow and ice jams has caused rivers to overflow in Iowa, Nebraska and South Dakota, USA, prompting evacuations and dam releases. Via Social Media, NWS Omaha / Valley NE said on 14 March, "Historic river flooding will continue today! Evacuations (are) ongoing in multiple locations. Please listen to local authorities and heed any evacuation orders. This is a very serious situation". From Flood List.
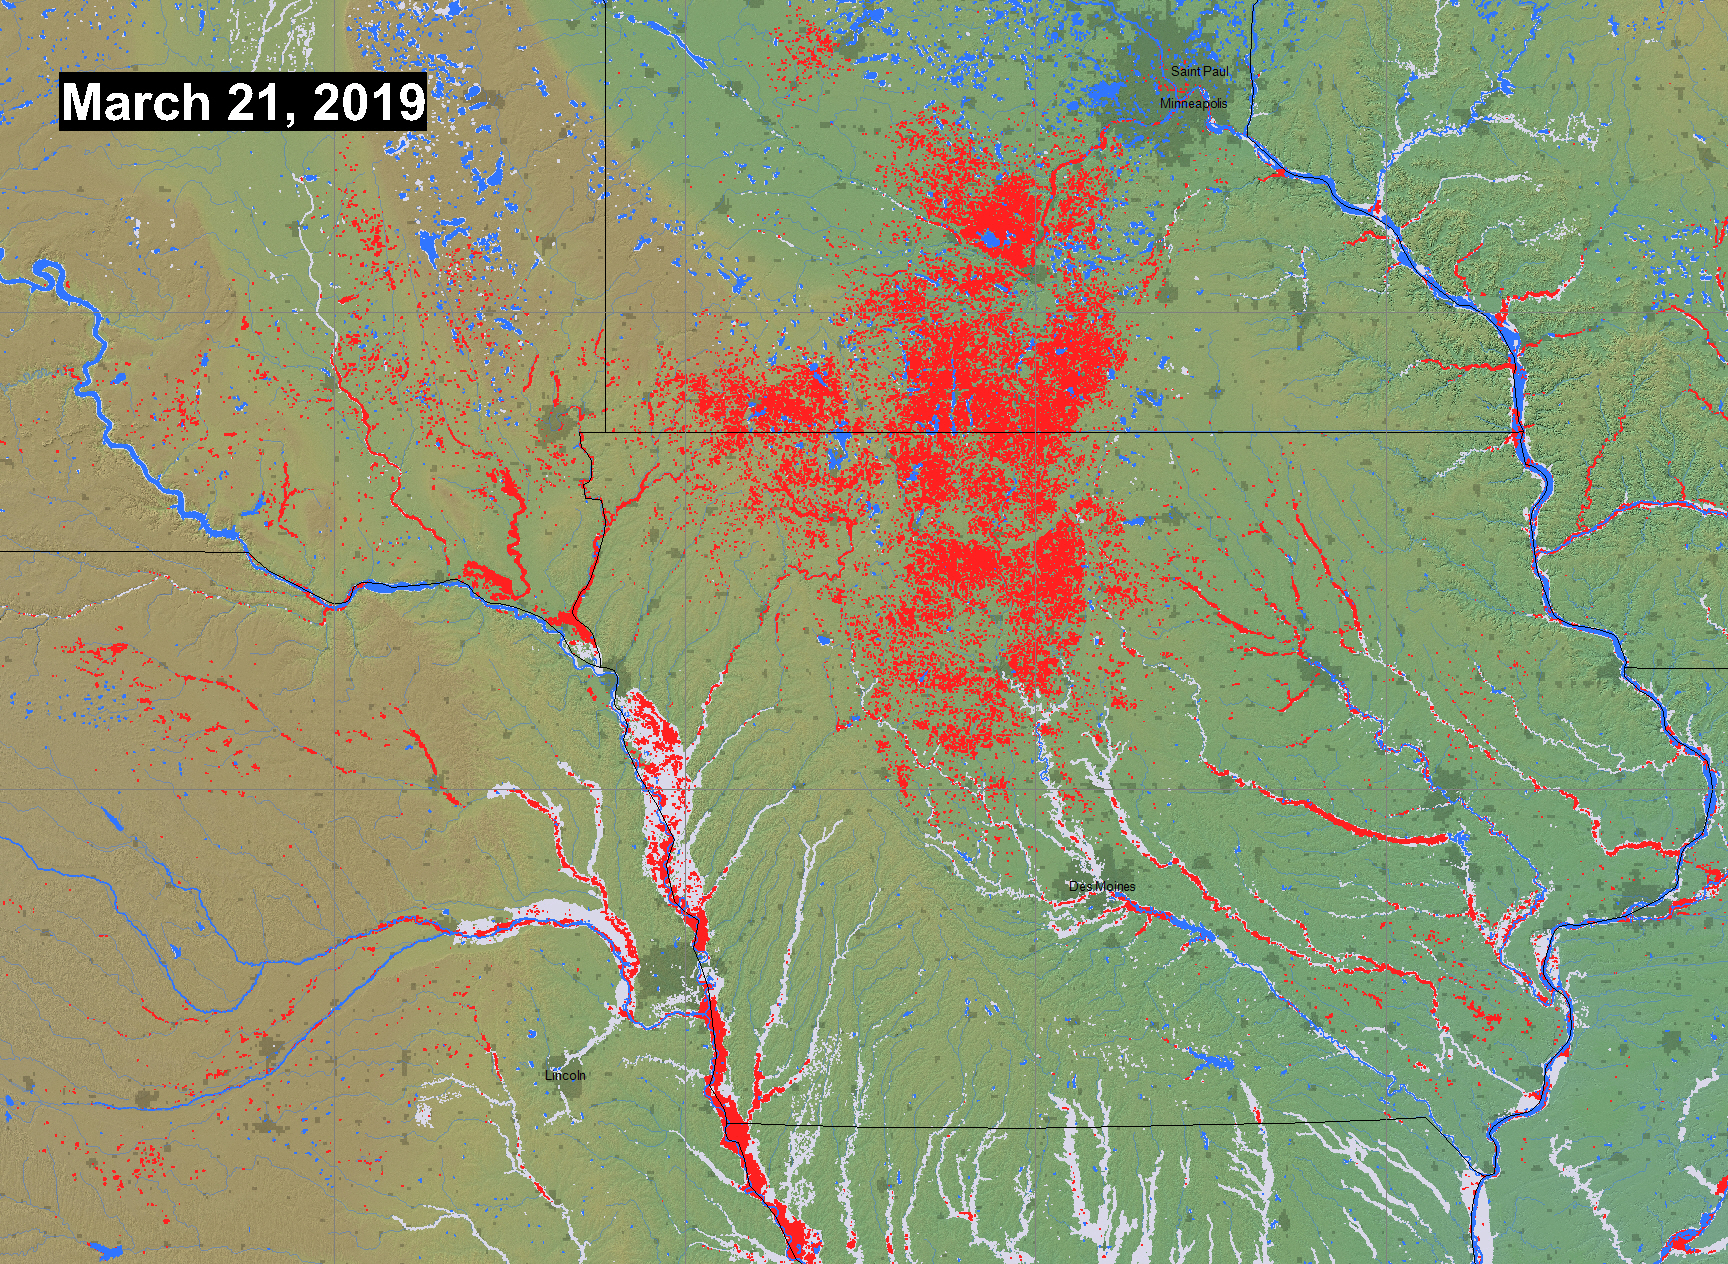
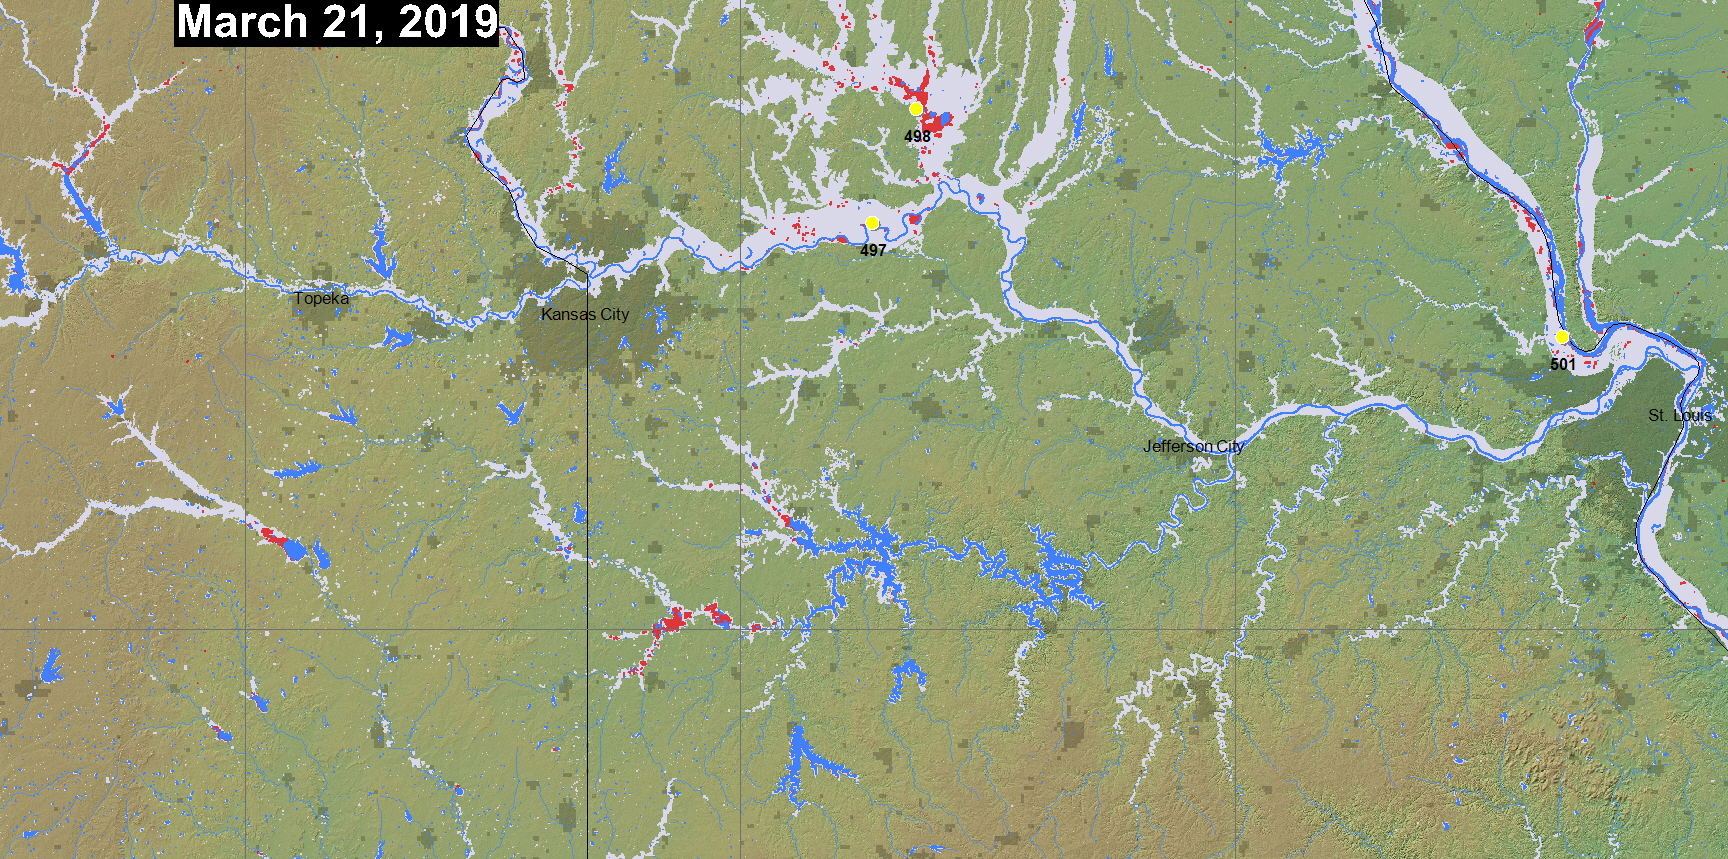
March 19, 2019: "The flood situation in upper mid-western states has worsened over the last few days. Wide areas of Nebraska and Iowa are under water, with many rivers reaching record levels. About 200 miles of levees along the Missouri River have been either breached or overtopped, according to the U.S. Army Corps of Engineers. Areas of Wisconsin and Missouri have also been affected. by the flooding." From Flood List.
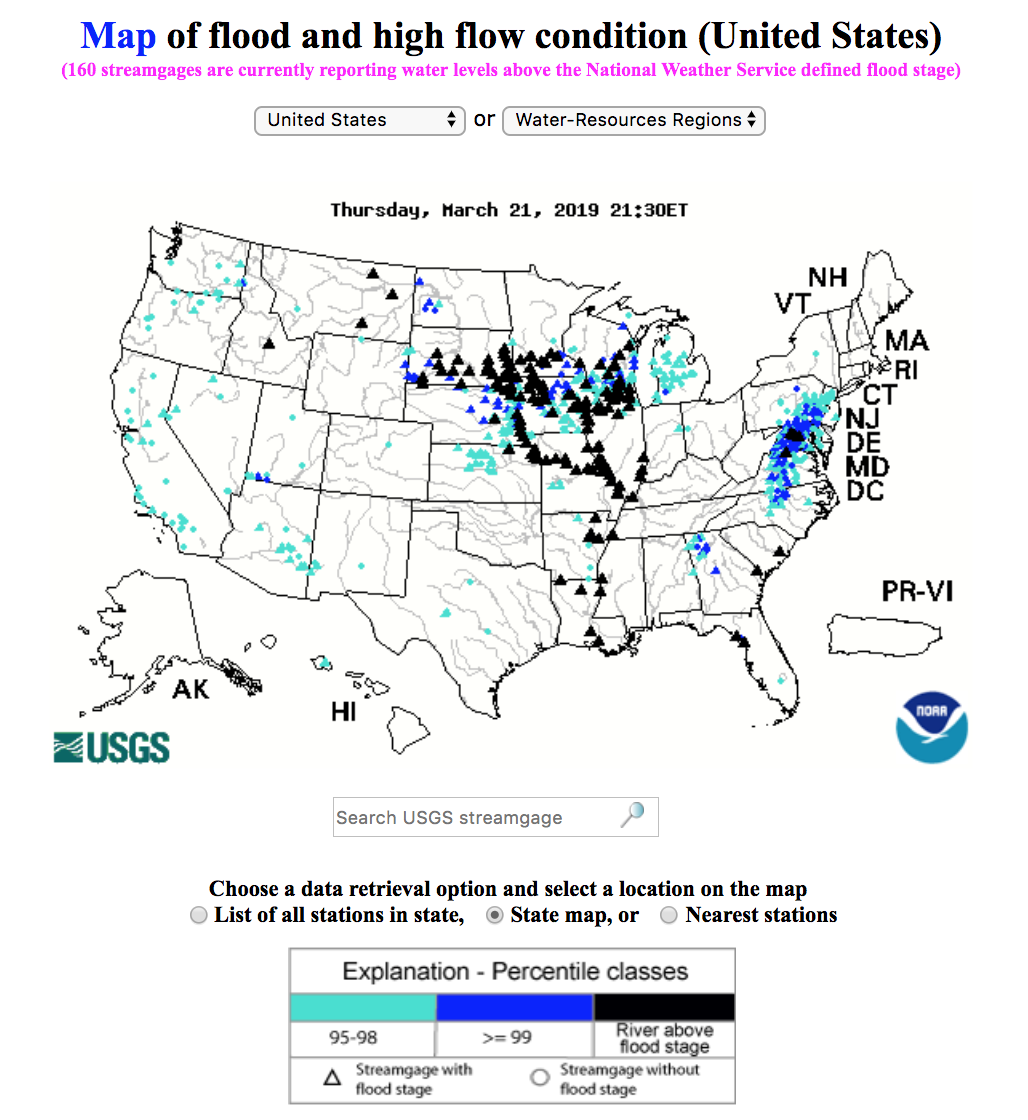
March 21, 2019: USGS gauging station data show flooding in southern South Dakota, eastern Nebraska southern Minnesota, Iowa, southern Wisconsin, and, along the Missouri River, Missouri. From USGS Water Watch.
The Flood Observatory maintains a Global Active Archive of large flood events, 1985 to present. New major flood events are entered into this archive each week. A hand-drawn GIS polygon for each event outlines the region affected.
This event was selected for Observatory production of map and GIS data products.This web page and associated image and map (GIS) files become the permanent Flood Observatory record of the flood.
As part of collaborations with other organizations, including
GEO and the Global Flood
Partnership, the Observatory's maps are made available here to the public.
Geotif versions and GIS files are also available. With attribution, maps and
data can be used freely for non-commercial purposes. With permission, they can
be used for commercial purposes. Consult the Creative Commons Attribution-NonCommercial-ShareAlike 4.0
International License and Robert.Brakenridge or Albert.Kettner (at
Colorado.edu) if questions. Attribution for this map when Sentinel SAR data are
used: "Dartmouth Flood Observatory at the University of Colorado, from satellite
data provided by NASA and Copernicus/European Space Agency". When using GIS data
(see below) provided to DFO from other sources, please acknowledge original
source.
NASA Landsat 8 and Copernicus/ESA Sentinel SAR data if used in this map were obtained from the the U.S. Geological Survey Hazards Data Distribution System. and the Sentinels Science Data hub, respectively. Landsat 8 is jointly managed by NASA and the United States Geological Survey. Copernicus is supported by the European Commission. MODIS data are obtained from the NASA NRT Global Flood Mapping facility (surface water extents) and from NASA Worldview (image files); SUOMI/VIIRS image data are also retrieved from NASA Worldview.
Flood extent files (Shp or Mapinfo) supporting this Flood Event Map are located here.
These files may include high spatial resolution mapping such as from Sentinel or Landsat, or lower resolution files from MODIS. File names commonly include the sensor source (e.g., S1 for Sentinel 1, LS8 for Landsat, MODIS for MODIS) and the image date.
Maximum water extent data from the Global Surface Water Explorer may be included as part of the light gray previously mapped surface water. It is based on Landsat images at a spatial resolution of 30 m (Pekel and others, Nature 540, 418-422, 2016). The NASA Shuttle Water Boundary Data (SWBD) surface water extent (90 m resolution), blue, is derived from NASA's 11-day February, 2000, SRTM mission and was corrected using Landsat data. These data are not provided in the GIS directories.
When used in the maps, Copernicus Emergency Management Service GIS data are imported and installed in a labeled "Copernicus" subdirectory. All flood extents not created here, including those from Copernicus, are shown in a darker red color on the map but are combined into one red layer on the simplified large geotif file (if provided).. Image data sources for Copernicus mapping results may include Sentinel SAR satellites and also Cosmo-SkyMed SAR satellites. Dissemination Policy: Under Copernicus and Commission Delegated Regulations, the information produced by the Copernicus Emergency Management Service shall be made available to the public on a full, open and free-of-charge basis. Attribution of the source is required: "Copernicus Emergency Management Service, Directorate Space, Security and Migration, European Commission Joint Research Centre (EC JRC). Accessed date. http://emergency.copernicus.eu/".
The NASA Earth Sciences Program, the Latin American Development Bank, the World Bank, the European Commission's Global Disaster Alert and Coordination System, GDACS, and Copernicus Emergency Management Service, the Google Earth Engine research awards program, the Committee on Earth Observation Satellites (CEOS) Disasters Working Group-Flood Pilot, the Japanese Space Agency, and the European Space Agency all have supported the Observatory's work via research grants and contracts or free satellite-derived data.
The Dartmouth Flood Observatory was founded in 1993 at Dartmouth College, Hanover, NH USA and moved to the University of Colorado, INSTAAR, CSDMS in 2010. Its operation depends on continued grant and project support. Gift contributions can be accepted. If your organization uses these data and maps, please consider becoming a partner and helping to sustain this effort. The institutional support of both universities is gratefully acknowledged.
">
(counting since March 21, 2019)