


![]()
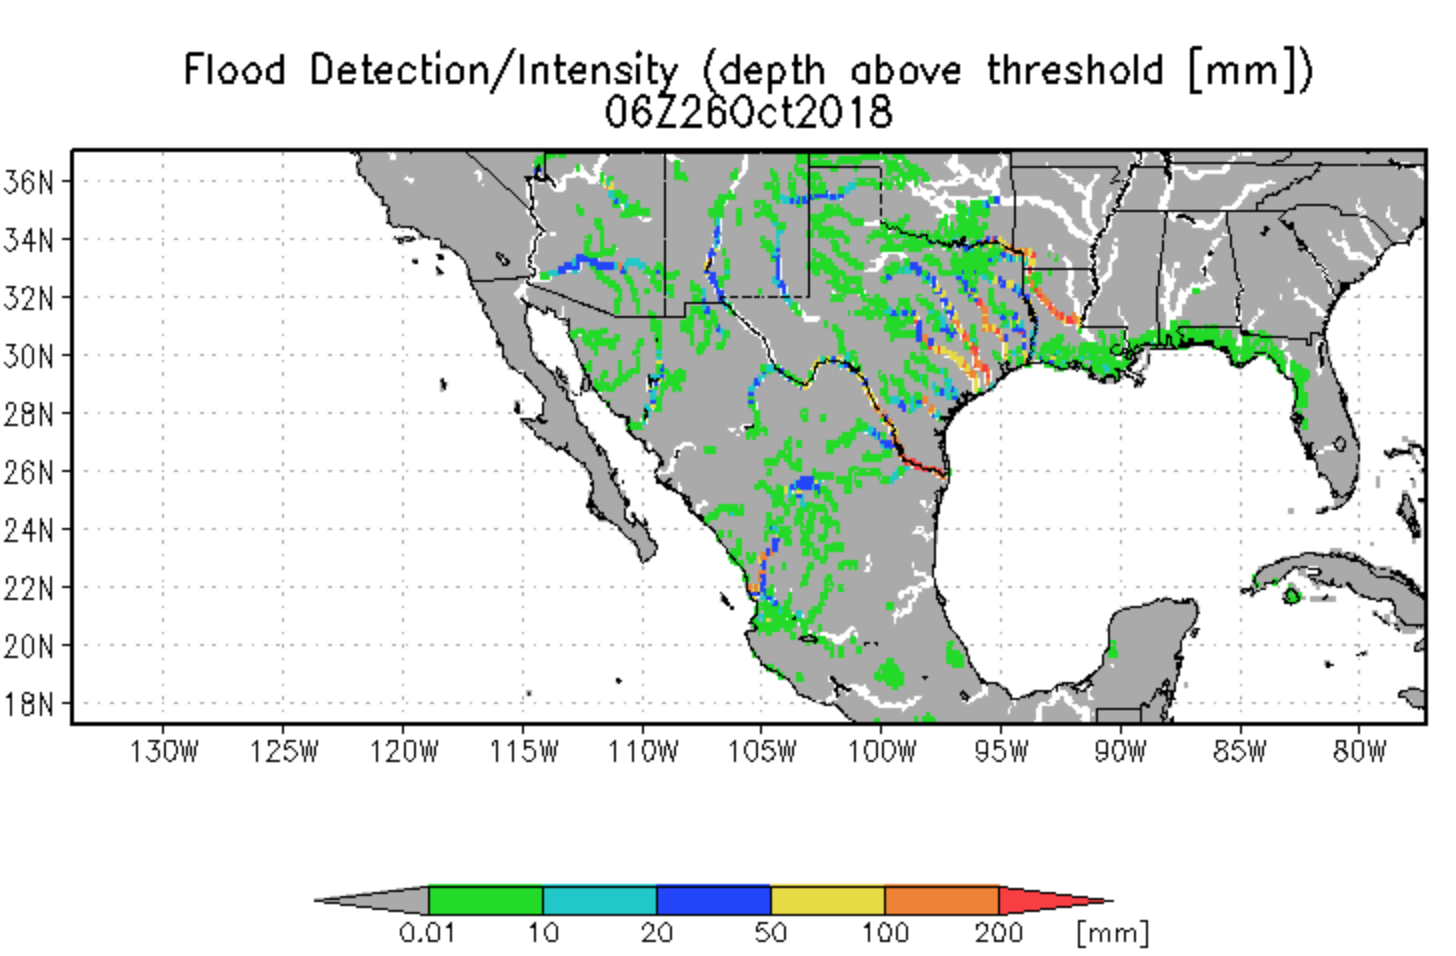
1. Predictive output of the NASA-supported Global Flood Monitoring System (GFMS) at ESSIC, University of Maryland. Date and UTC time is shown. Output obtained October 24, 2018.
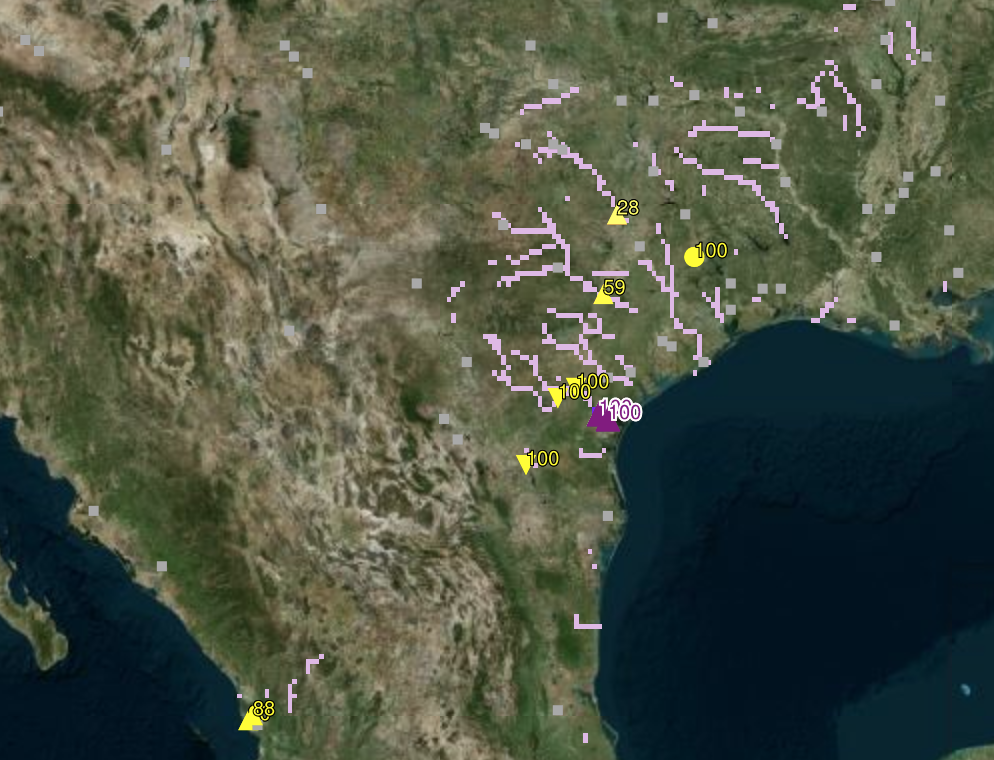
2. Glofas Predicted Major (> 20 y recurrence) Flooding. Output retrieved October 24, 2018.
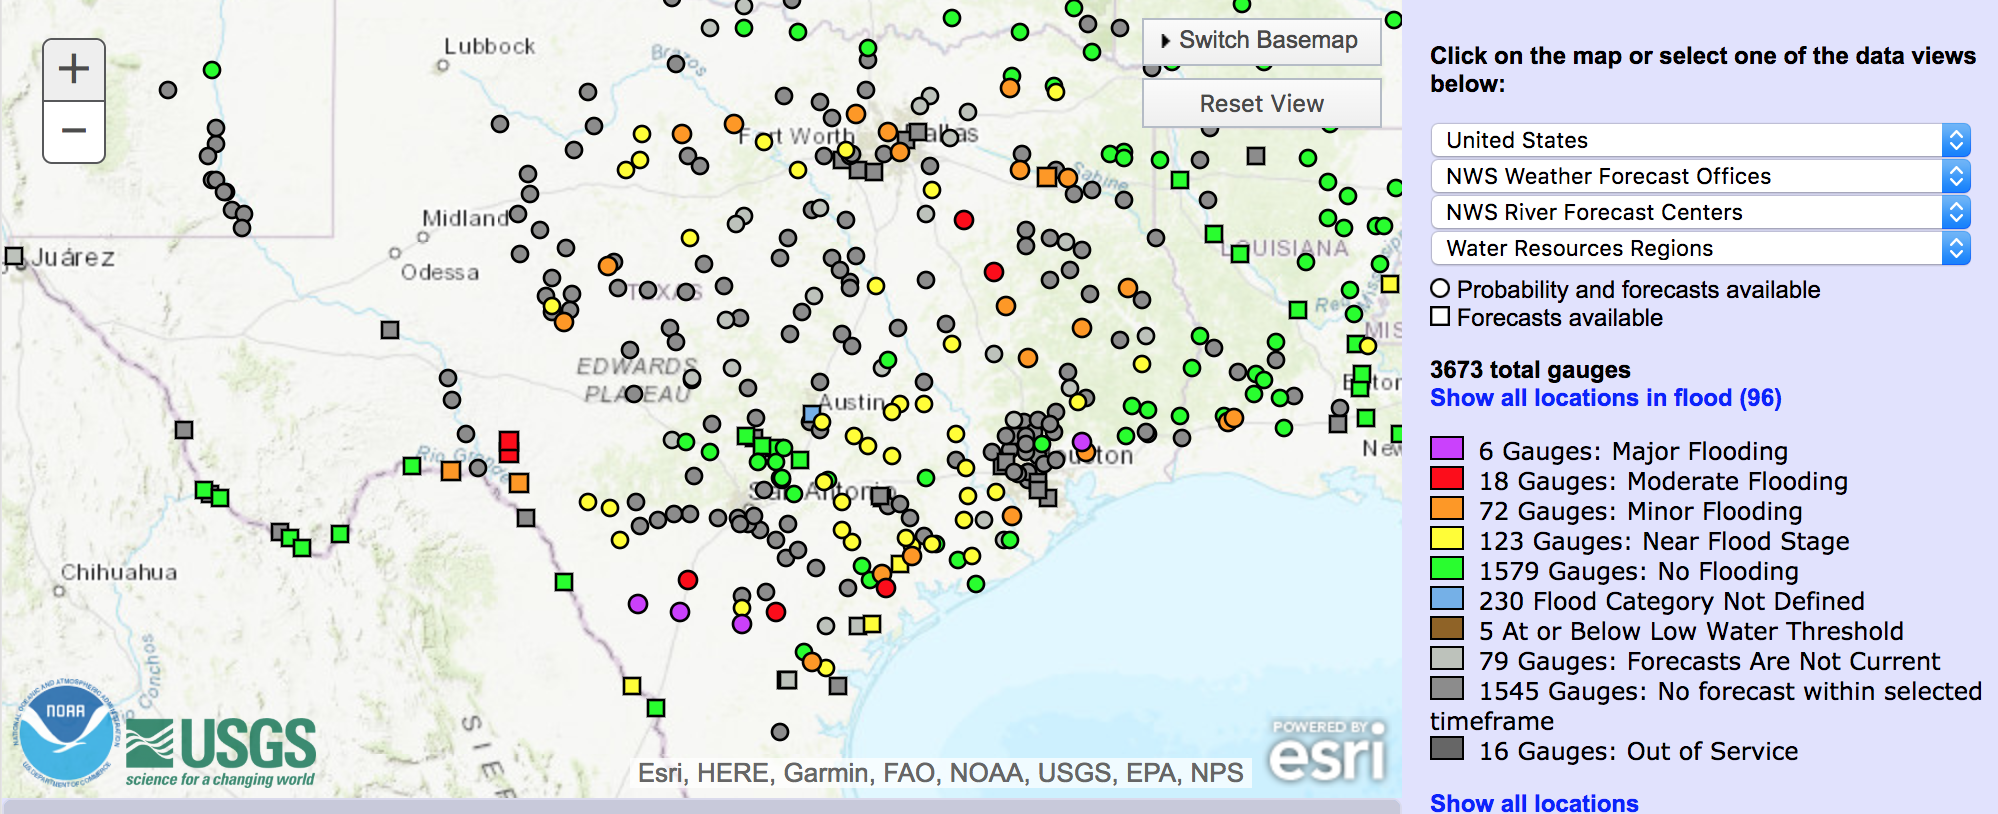
3. NOAA Forecast Flooding. Output retrieved October 24, 2018.
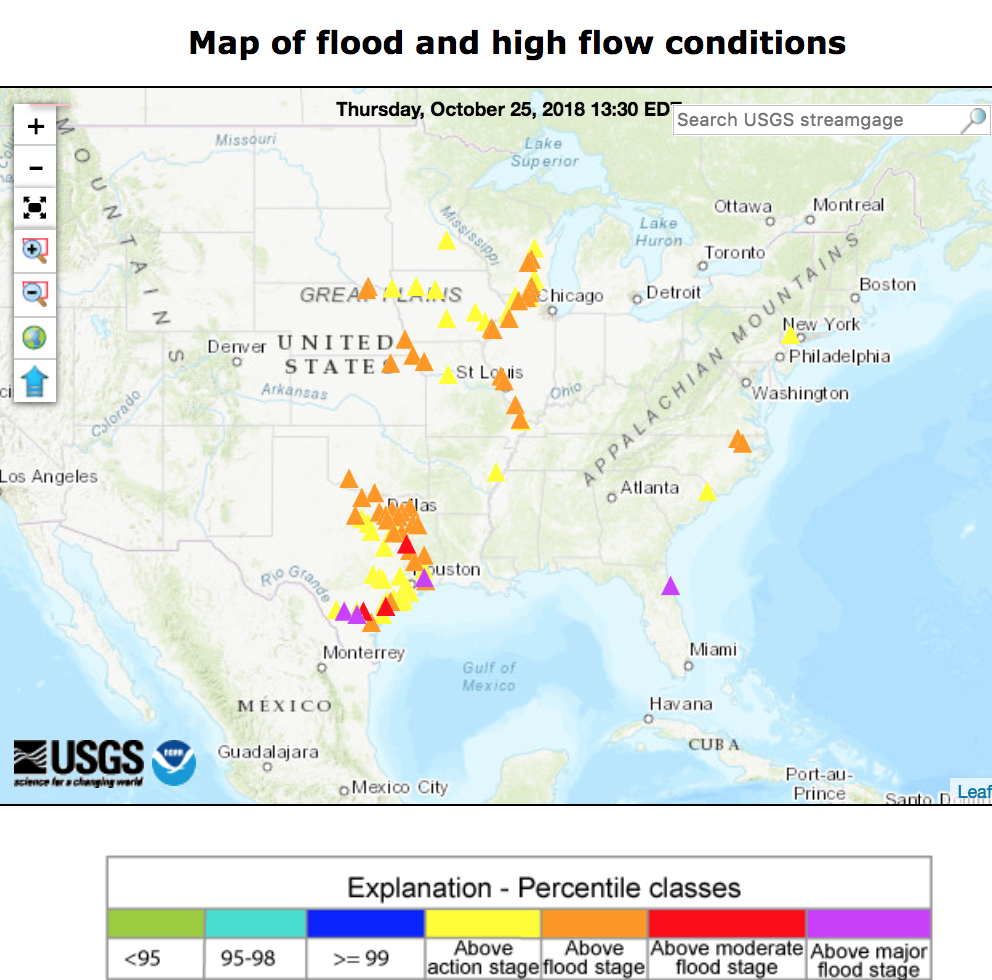
4. Current River Conditions. Output retrieved October 24, 2018.
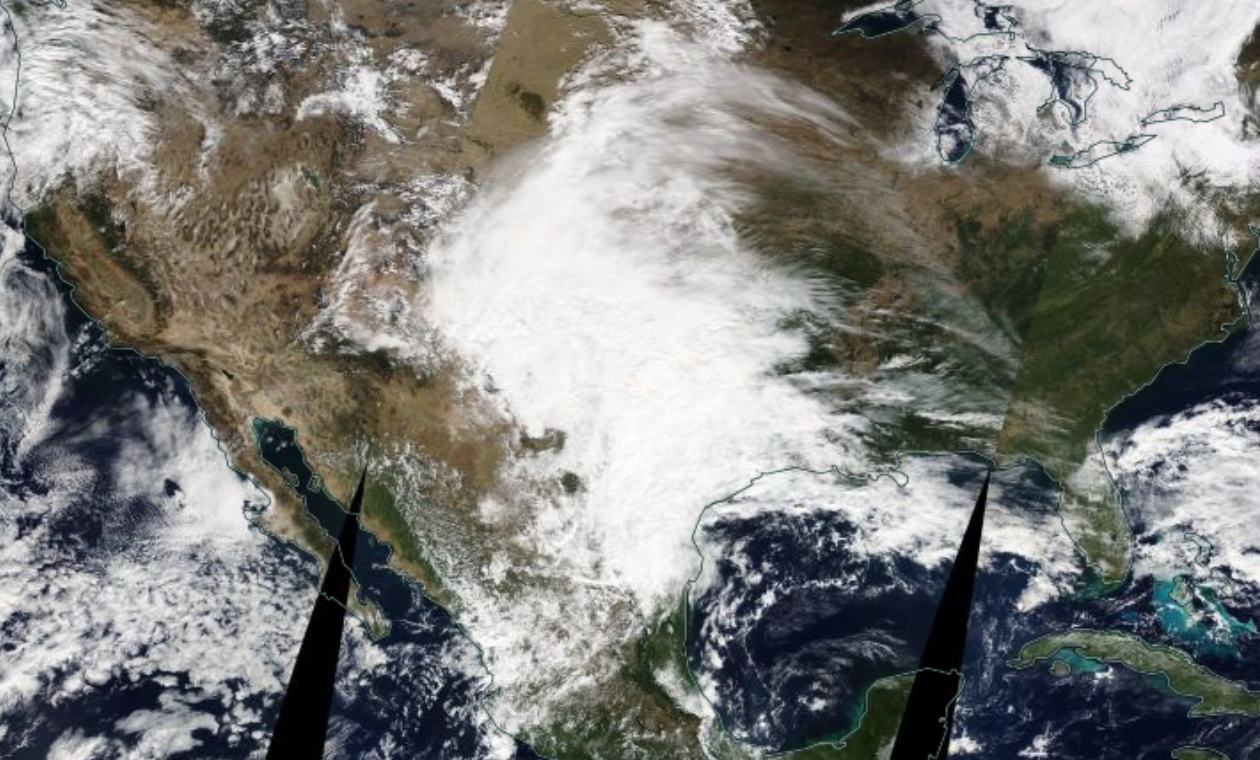
5. Recent image showing storm size and location. NASA Terra MODIS on WorldView, October 24, 2018
Large black and white Geotif. Black is flood water
The Flood Observatory maintains a Global Active Archive of large flood events, 1985 to present. New major flood events are entered into this archive each week. A hand-drawn GIS polygon for each event outlines the region affected.
This event was selected for Observatory production of map and GIS data products.This web page and associated image and map (GIS) files become the permanent Flood Observatory record of the event after all data are collected and integrated. The objective is mapping of the maximum extent flooded and in relation to previous events.
As part of collaborations with other organizations, including GEO and the Global Flood Partnership, the Observatory's maps are made available here to the public. Geotif versions and GIS files are also available. With attribution, maps and data can be used freely for non-commercial purposes. With permission, they can be used for commercial purposes. Consult the Creative Commons Attribution-NonCommercial-ShareAlike 4.0 International License and Robert.Brakenridge or Albert.Kettner (at Colorado.edu) if questions. Attribution for this map when Sentinel SAR data are used: "Dartmouth Flood Observatory at the University of Colorado, from satellite data provided by NASA and Copernicus/European Space Agency." When using GIS data (see below) provided to DFO from other sources, please acknowledge original source (identifiable from the source directory). For example, this display uses shp files produced at DFO from geotif water/land classified products from: Xinyi Shen, Rehenuma Lazin, and Emmanouil Anagnoustou at the University of Connecticut and from Patrick Matgen at LIST, University of Luxembourg.

"To be done.". See more from FloodList
NASA Landsat 8 and Copernicus/ESA Sentinel SAR data if used in this map were obtained from the the U.S. Geological Survey Hazards Data Distribution System. and the Sentinels Science Data hub, respectively. Landsat 8 is jointly managed by NASA and the United States Geological Survey. Copernicus is supported by the European Commission. MODIS data are obtained from the NASA NRT Global Flood Mapping facility (surface water extents) and from NASA Worldview (image files).
Flood extent files (Shp or Mapinfo) supporting this Flood Event Map are located here. For web map service-based (WMS) information visit this DFO link. Zoom in to location of interest, and turn on appropriate event and other data layers.
These files may include high spatial resolution mapping such as from Sentinel or Landsat, or lower resolution files from MODIS. File names commonly include the sensor source (e.g., S1 for Sentinel 1, LS8 for Landsat, MODIS for MODIS) and the image date.
Maximum water extent data from the Global Surface Water Explorer is included as part of the light gray previously mapped surface water. It is based on Landsat images at a spatial resolution of 30 m (Pekel and others, Nature 540, 418-422, 2016). The NASA Shuttle Water Boundary Data (SWBD) surface water extent (90 m resolution), blue, is derived from NASA's 11-day February, 2000, SRTM mission and was corrected using Landsat data. These data are not provided in the GIS directories.
When used in the maps, Copernicus Emergency Management Service GIS data are imported and installed in the "other" subdirectory within the GIS data directory. Delineation" files refer to flood inundation extents and are shown in a darker red color. Image data sources may include Sentinel SAR satellites and also Cosmo-SkyMed SAR satellites. Dissemination Policy: Under Copernicus and Commission Delegated Regulations, the information produced by the Copernicus Emergency Management Service shall be made available to the public on a full, open and free-of-charge basis. Attribution of the source is required: "Copernicus Emergency Management Service, Directorate Space, Security and Migration, European Commission Joint Research Centre (EC JRC). Accessed date. http://emergency.copernicus.eu/". Data from other contributors may also be provided, in separate subdirectories, and attribution of the data source is again necessary.
The NASA Earth Sciences Program, the Latin American Development Bank, the World Bank, the European Commission's Global Disaster Alert and Coordination System, GDACS, and Copernicus Emergency Management Service, the Google Earth Engine research awards program, the Committee on Earth Observation Satellites (CEOS) Disasters Working Group-Flood Pilot, the Japanese Space Agency, and the European Space Agency all have supported the Observatory's work via research grants and contracts or free satellite-derived data.
The Dartmouth Flood Observatory was founded in 1993 at Dartmouth College, Hanover, NH USA and moved to the University of Colorado, INSTAAR, CSDMS in 2010. Its operation depends on continued grant and project support. Gift contributions can be accepted; if your organization uses these data and maps, please consider becoming a partner and helping to sustain this effort. The sustained institutional support of both universities is gratefully acknowledged.
(counting since October 24, 2018)