


![]()
The Flood Observatory maintains a Global Active Archive of large flood events, 1985 to present. New major flood events are entered into this archive each week. A hand-drawn GIS polygon for each event outlines the regiona affected.
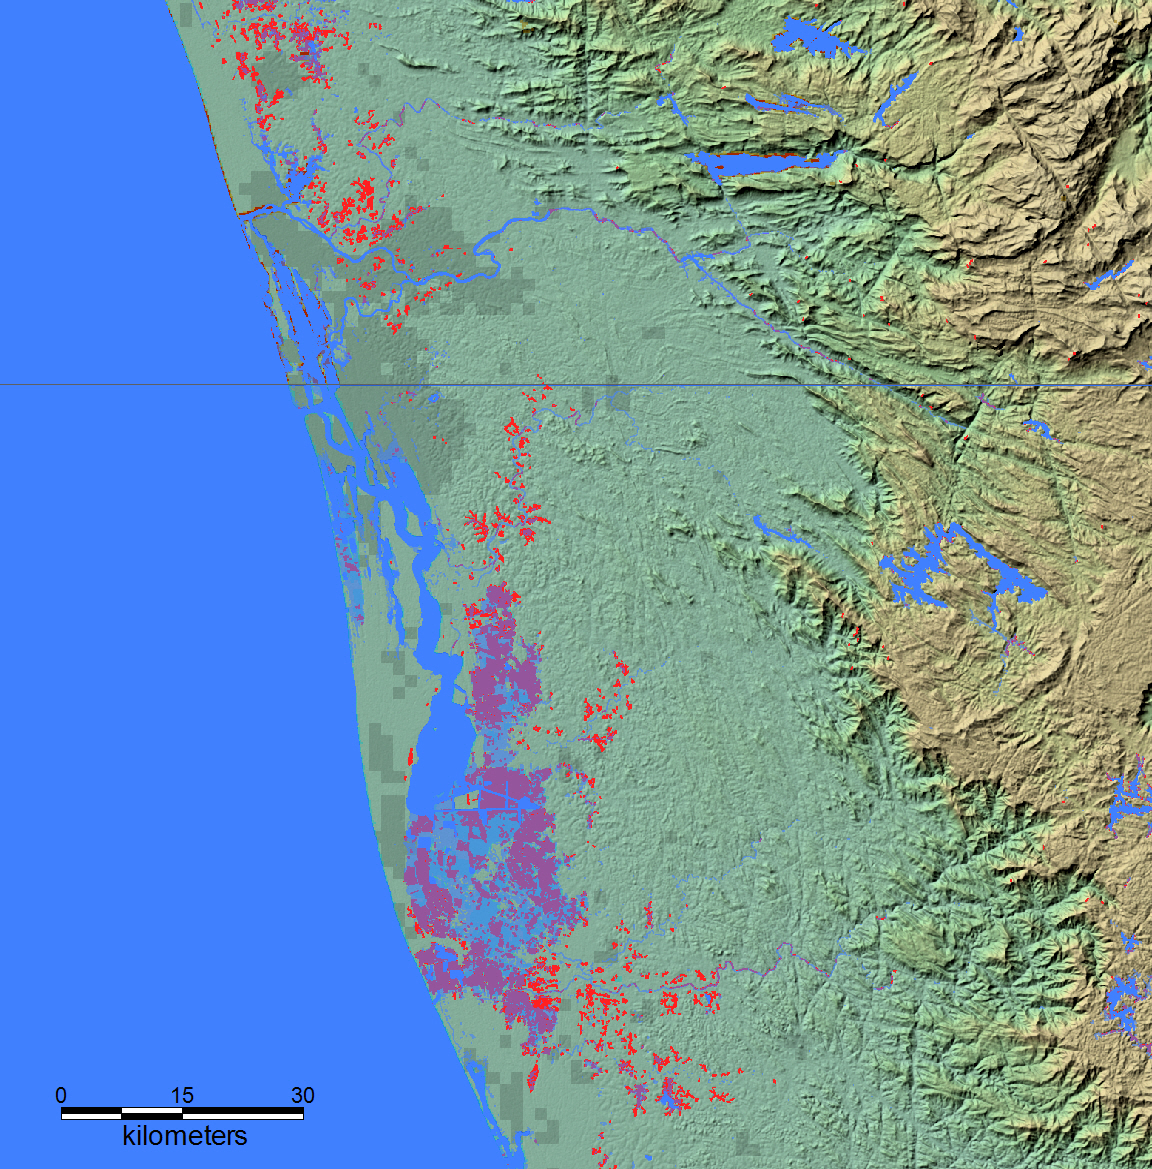
This event is selected for Observatory production of map and GIS data products.This web page and associated image and map (GIS) files will become the permanent Flood Observatory record of this event after all data are collected and integrated. The objective is mapping of the maximum extent flooded.
As part of collaborations with other organizations, including GEO and the Global Flood Partnership, the Observatory's maps and other data are made available here to the public. With attribution, they can be used for non-commercial purposes. With permission, they can be used for commercial purposes. Consult the Creative Commons license shown below and contact Robert.Brakenridge or Albert.Kettner (at Colorado.edu) if questions. Geotif versions and GIS files are also available.
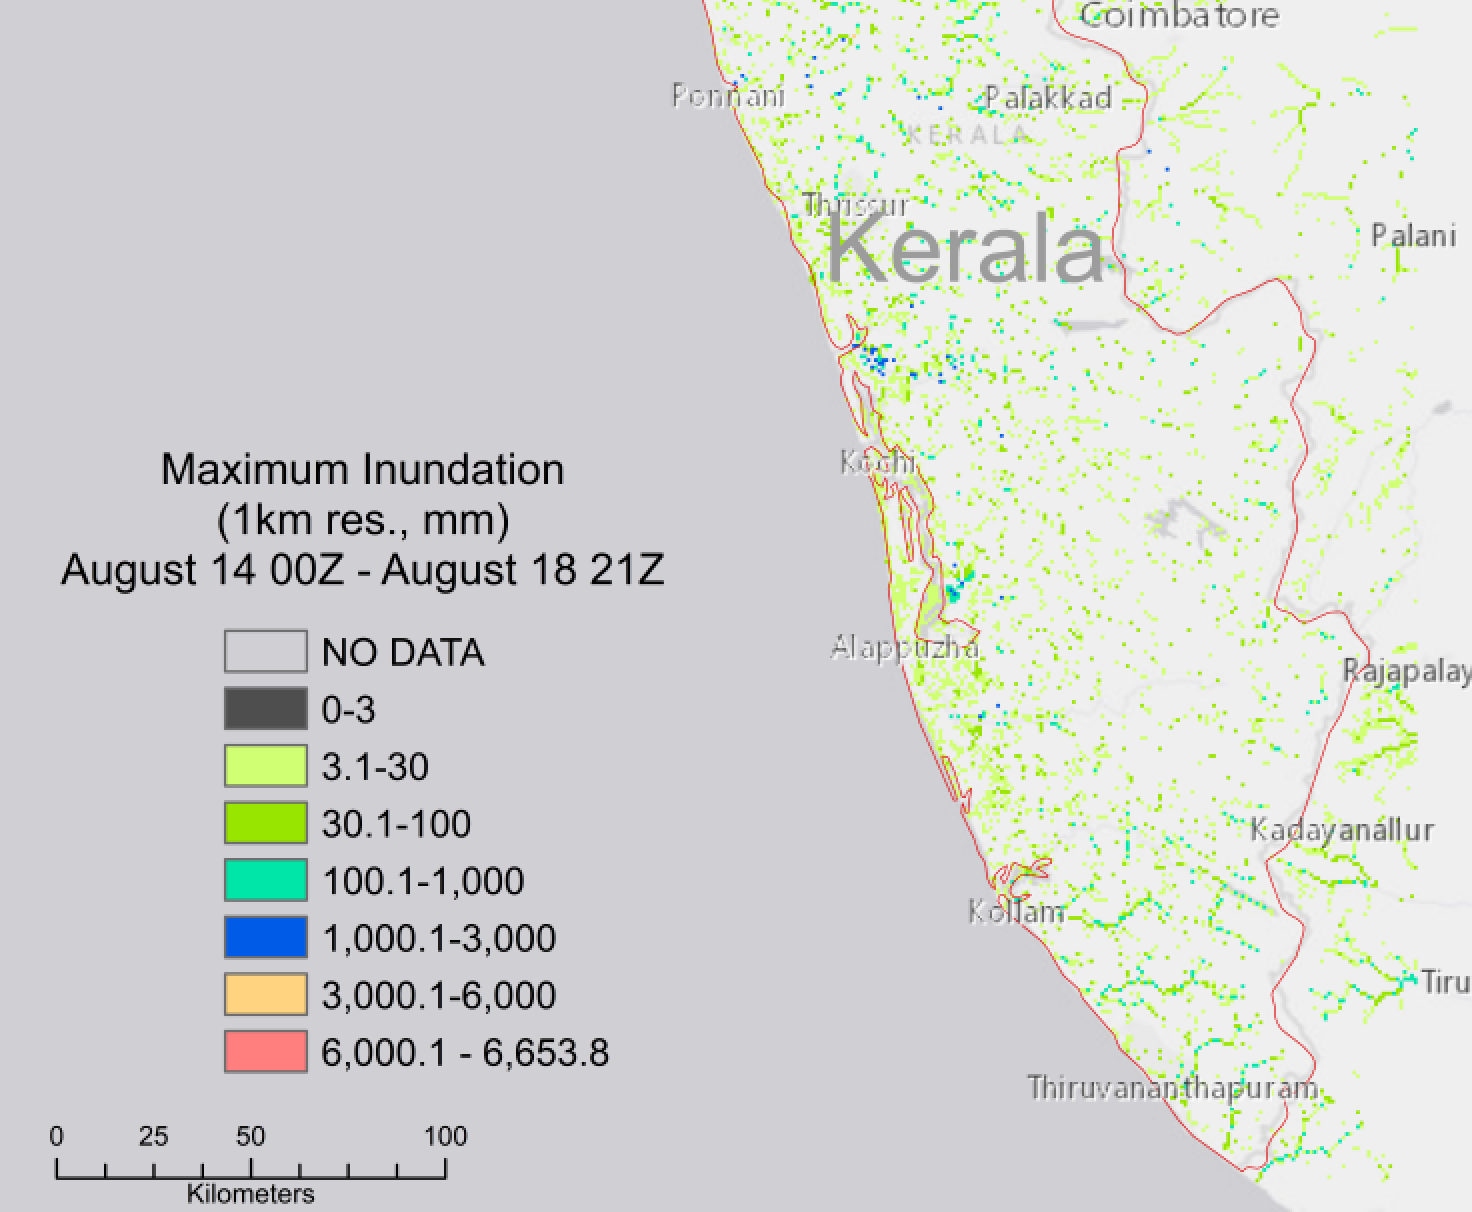
"As many as 324 people have lost their lives and over 300,000 have been displaced in Kerala, south west India. The Chief Minister of Kerala, Pinarayi Vijayan, said the state is facing its worst flood in 100 years. Disaster management authorities in India reported that the total area flooded in the state increased from 28, 737 hectares on 14 August to 50,119 hectares on 17 August. As of 17 August 24,948 hectares were flooded in Alappuzha and 14,006 in Kottayam districts. The Chief Minister said that 80 dams have been opened across the state". See more from FloodList
Brakenridge, G.R. and Kettner, A. J., date, "DFO Flood Event #", Dartmouth Flood Observatory, University of Colorado, Boulder, Colorado, USA, http address.

The maps and web pages provided here are by G. R. Brakenridge and A. J. Kettner and allowable use is guided by the terms of the Creative Commons Attribution-NonCommercial-ShareAlike 4.0 International License. Use for commercial purposes is by permission which is freely provided. Suggested attribution for this map: "Dartmouth Flood Observatory at the University of Colorado, from satellite data provided by NASA and Copernicus/European Space Agency".
NASA Landsat 8 and Copernicus/ESA Sentinel SAR data if used in this map were obtained from the the U.S. Geological Survey Hazards Data Distribution System. and the Sentinels Science Data hub, respectively. Landsat 8 is jointly managed by NASA and the United States Geological Survey. Copernicus is supported by the European Commission..
Flood extent files (Shp or Mapinfo) supporting this Flood Event Map are located here. Files for this event are still being prepared and, where posted already, may be subsequently revised.
These files may include high spatial resolution mapping such as from Sentinel or Landsat, or lower resolution files from MODIS. File names commonly include the sensor source (e.g., S1 for Sentinel 1, LS8 for Landsat, MODIS for MODIS) and the image date.
Data from the Global Surface Water Explorer is included as part of the light gray previous mapped maximum surface water extent. It is based on Landsat images at a spatial resolution of 30 m (Jean-Francois Pekel, Andrew Cottam, Noel Gorelick, Alan S. Belward, High-resolution mapping of global surface water and its long-term changes. Nature 540, 418-422, 2016). The NASA Shuttle Water Boundary Data (SWBD) surface water extent (90 m resolution), blue, was derived from NASA's the 11-day February, 2000, SRTM mission and this "permanent" water layer was also corrected using Landsat data. These data are not provided in the GIS directories.
When used in the maps, NASA NRT Global Flood Mapping maximum water extent for the years 2013-2015, at 250 m spatial resolution, provide part of the (light gray) previous satellite-mapped water extent layer. DFO creates these annual water extent layers from data provided by that project, by accumulating into one annual file all of the daily .shp files for each year. DFO has also produced flood extent files through mapping of individual floods (~ yr 2000 to present); these are also included in this layer.
When used in the maps, Copernicus Emergency Management Service GIS data are imported and installed in the GIS data folder labeled "Copernicus". Delineation" files refer to flood inundation extents. Dissemination Policy: Under Copernicus and Commission Delegated Regulations, the information produced by the Copernicus Emergency Management Service shall be made available to the public on a full, open and free-of-charge basis. Attribution of the source is required "Copernicus Emergency Management Service, Directorate Space, Security and Migration, European Commission Joint Research Centre (EC JRC). Accessed date. http://emergency.copernicus.eu/".
The NASA Earth Sciences Program, the Latin American Development Bank, the World Bank, the European Commission's Global Disaster Alert and Coordination System, GDACS, and Copernicus Emergency Management Service, the Google Earth Engine research awards program, the Committee on Earth Observation Satellites (CEOS) Disasters Working Group-Flood Pilot, the Japanese Space Agency, and the European Space Agency all have supported the Observatory's work via research grants and contracts or by provision of free satellite-derived data.
The Dartmouth Flood Observatory was founded in 1993 at Dartmouth College, Hanover, NH USA and moved to the University of Colorado, INSTAAR, CSDMS in 2010. Its sustained operation depends on continued grant and project support. Gift contributions can be accepted; if your organization uses these data and maps, please consider helping to sustain this effort. The institutional support of both universities is gratefully acknowledged.
(counting since August 23, 2018)