


(Note: Display may not refresh to latest version in Chrome. Test using another browser.)
The Flood Observatory maintains a Global Active Archive of large flood events, 1985 to present. New major flood events are entered into this archive each week. A hand-drawn GIS polygon for each event outlines the estimated total area affected.
In some cases, severe or damaging floods become the focus of Observatory flood extent mapping. As part of collaborations with other organizations, and the Global Flood Partnership, the Observatory's maps and other data are made available to the public. With attribution, they can be used and shared freely for non-commercial purposes. By permission, which is freely granted, they can be used for commercial purposes. Consult the Creative Commons license shown below. Geotif versions and GIS files are also provided for these maps.
This event is selected for Observatory production of map and GIS data products.This web page and associated image and map (GIS) files are the permanent Flood Observatory record of this event. As the flood event proceeds, additional flood extent layers and maps may be added. The objective is mapping of the maximum extent flooded.
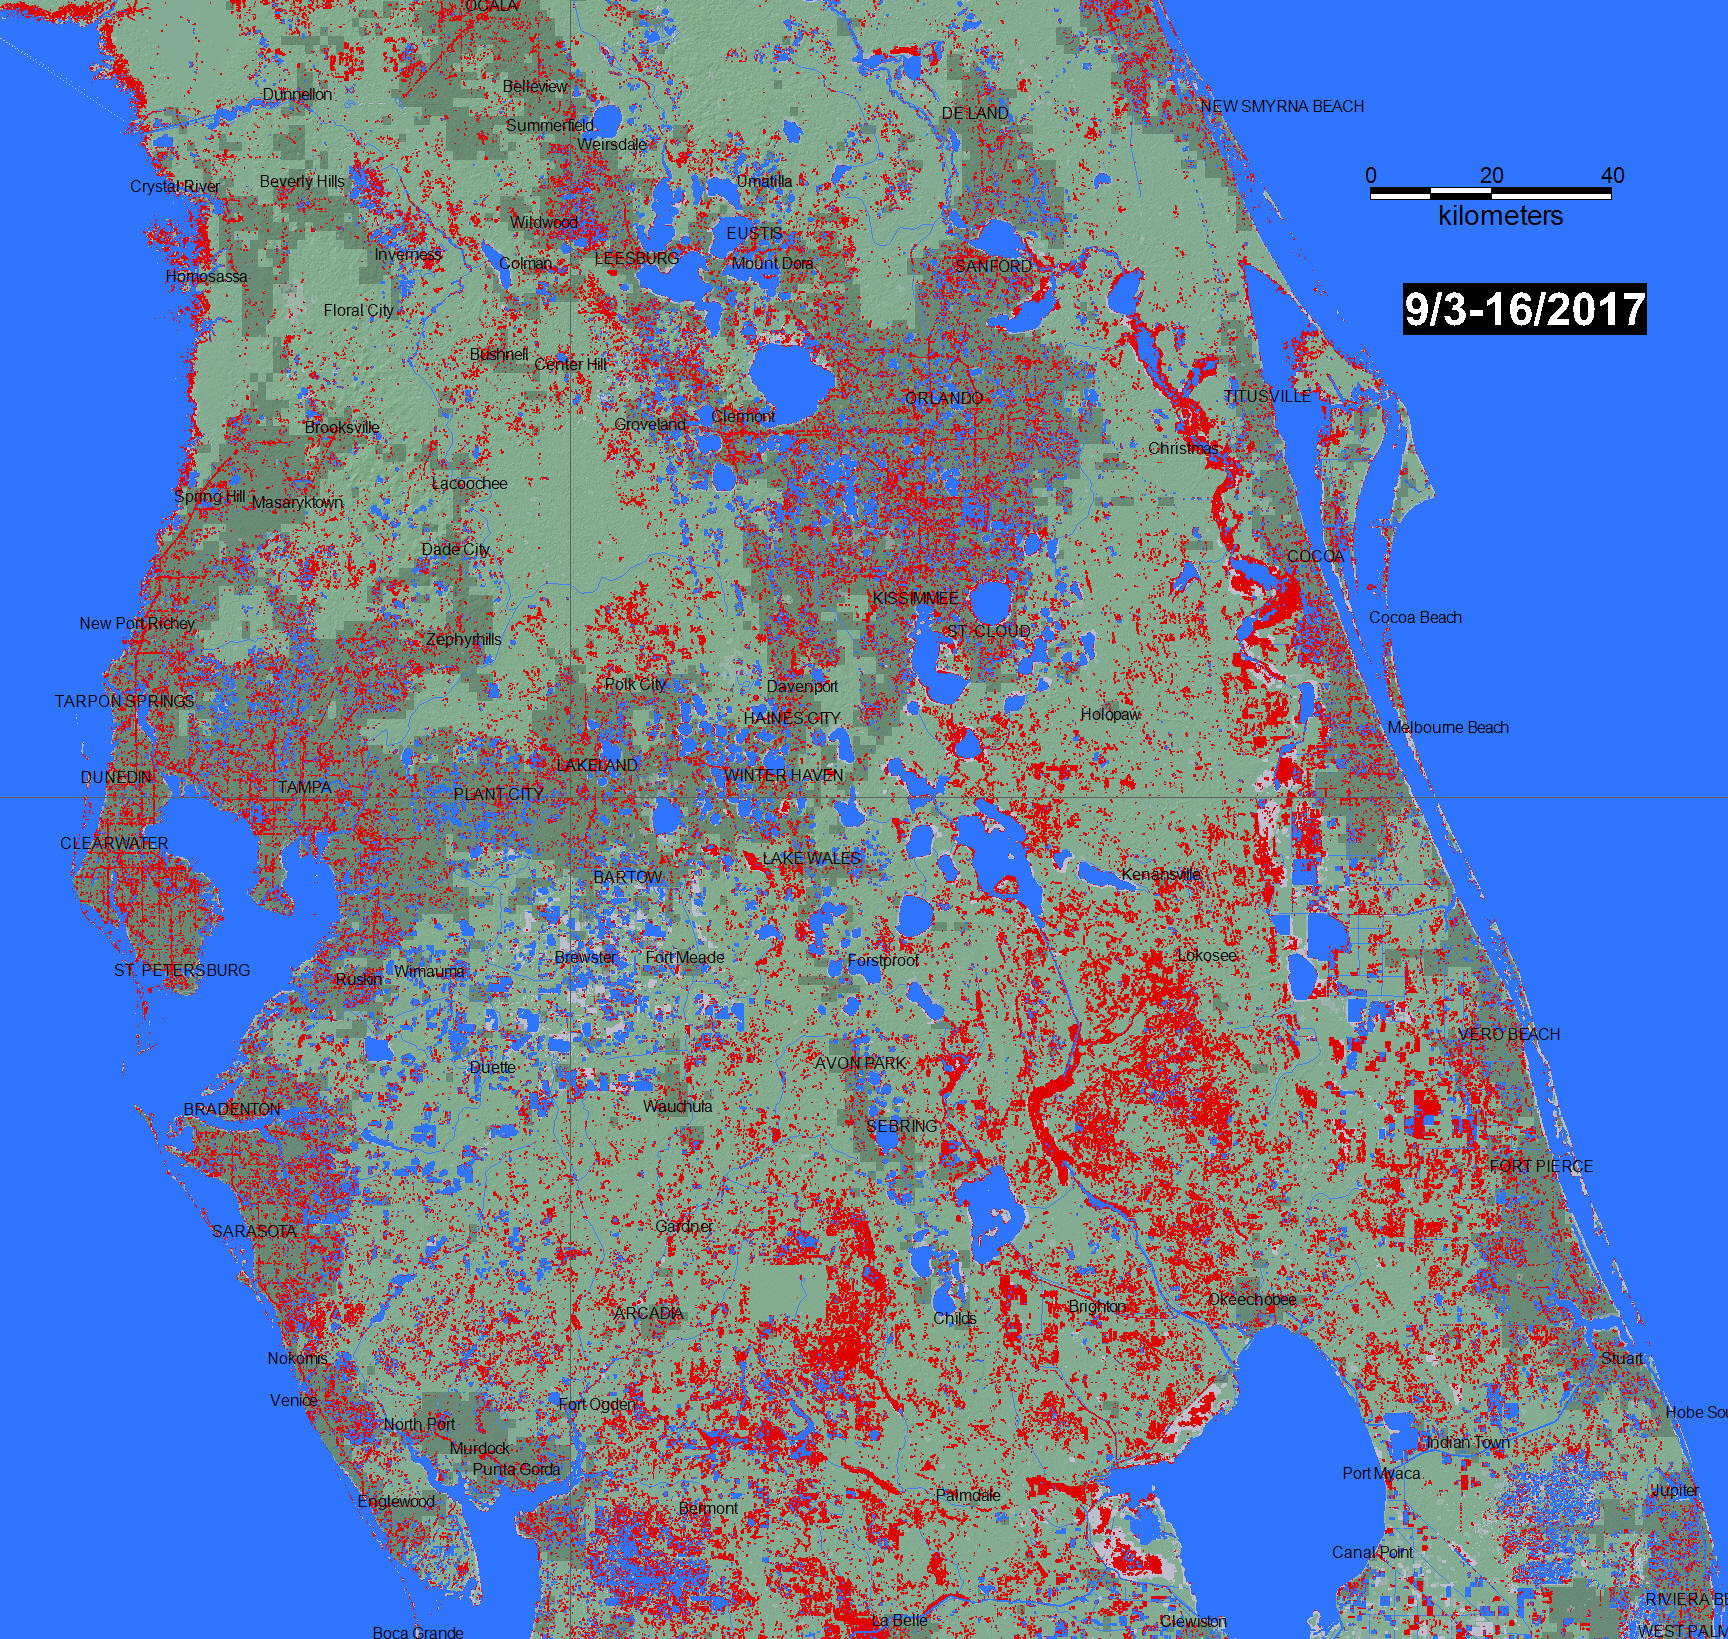
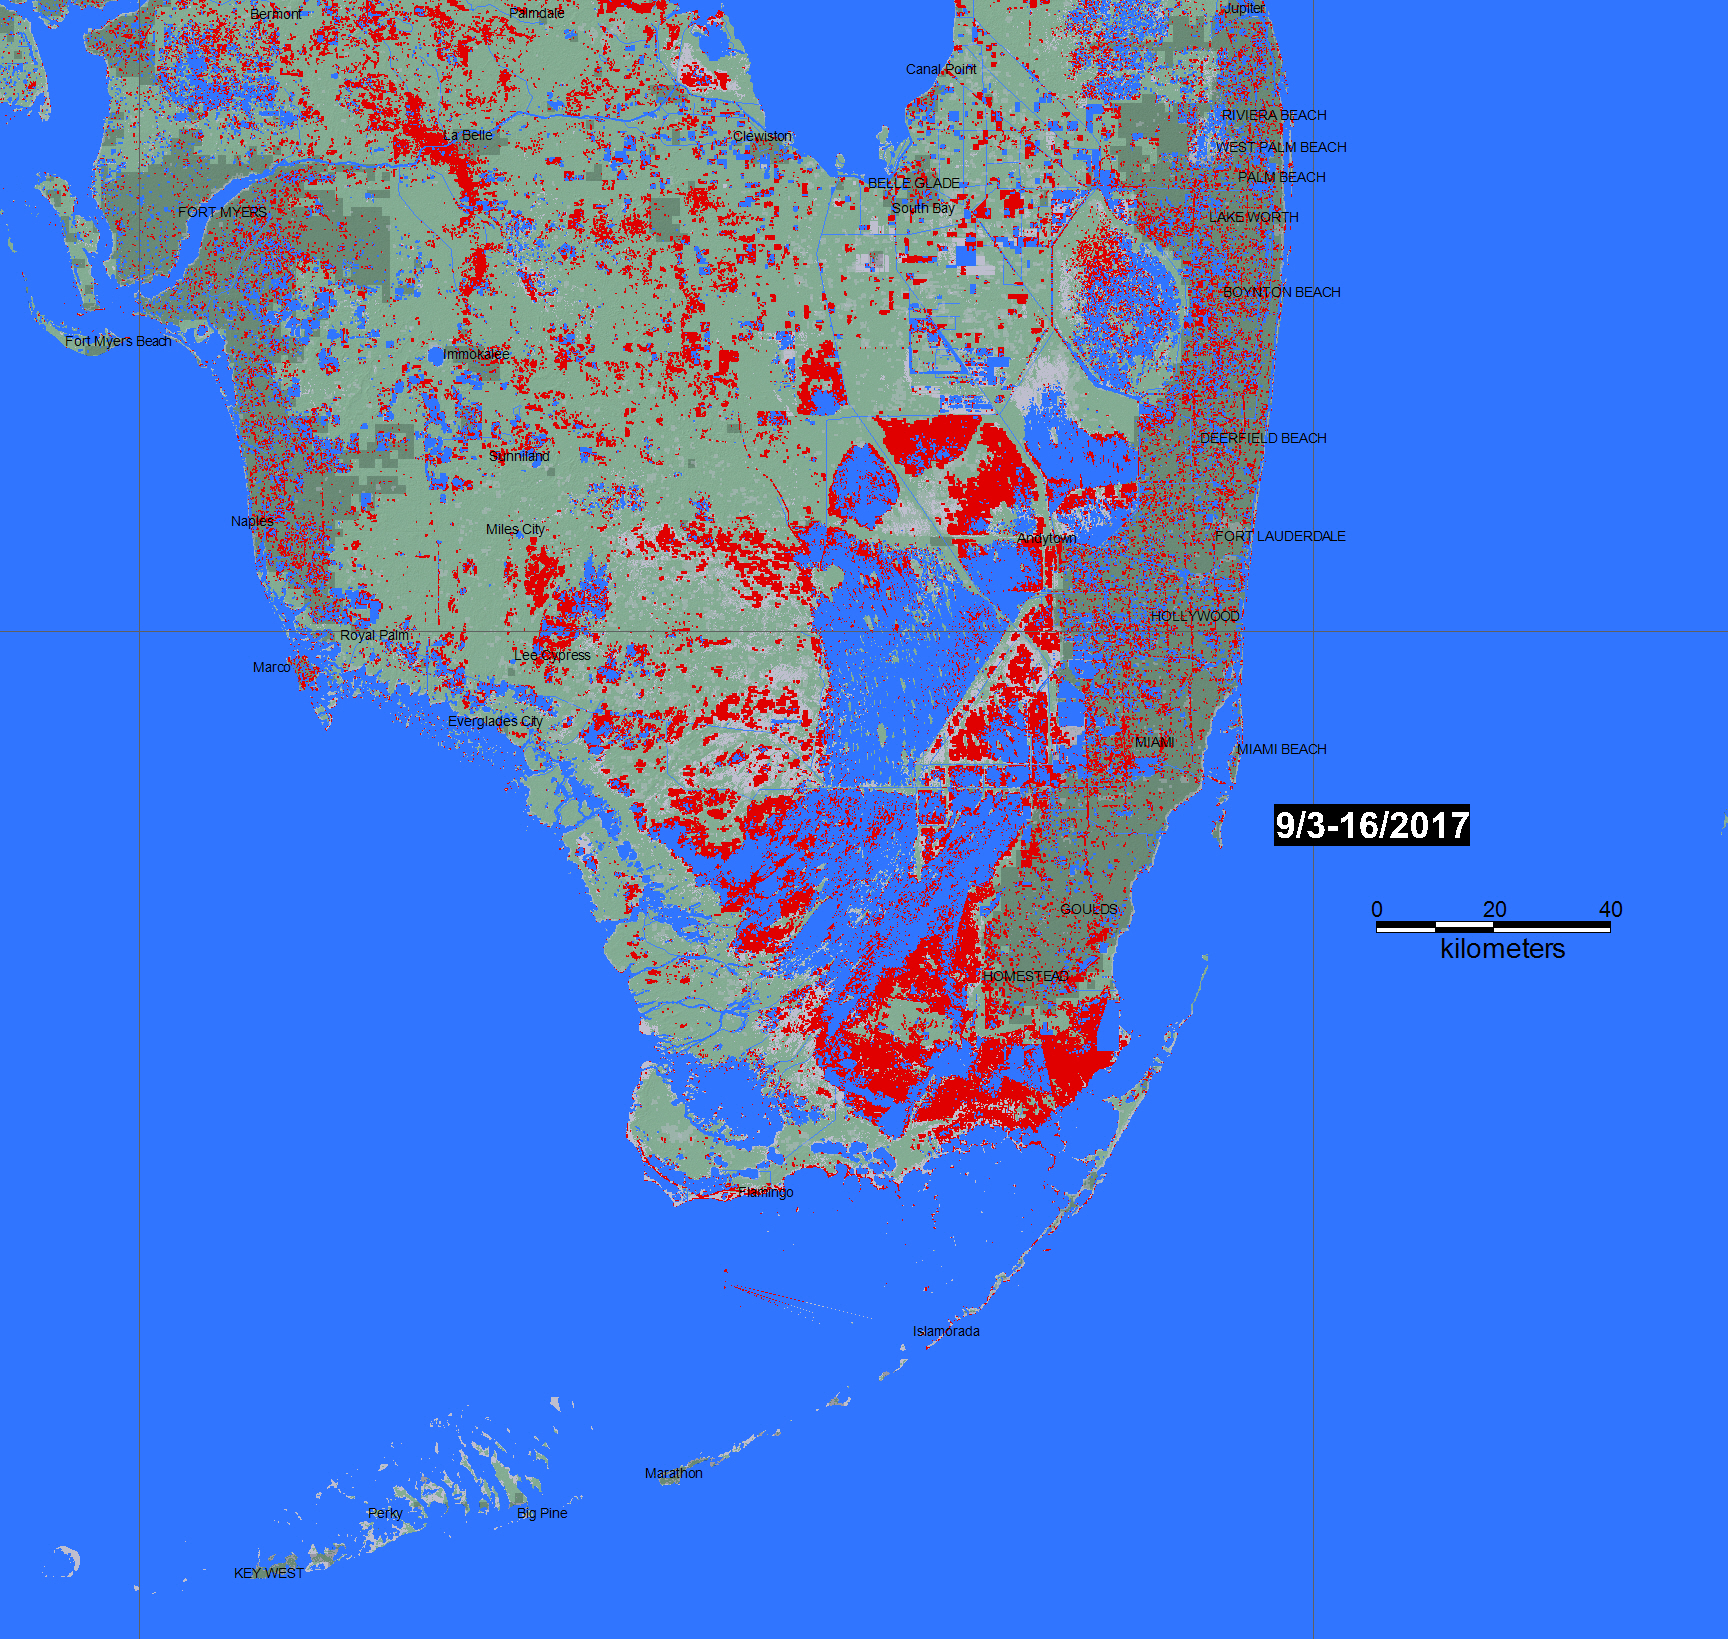
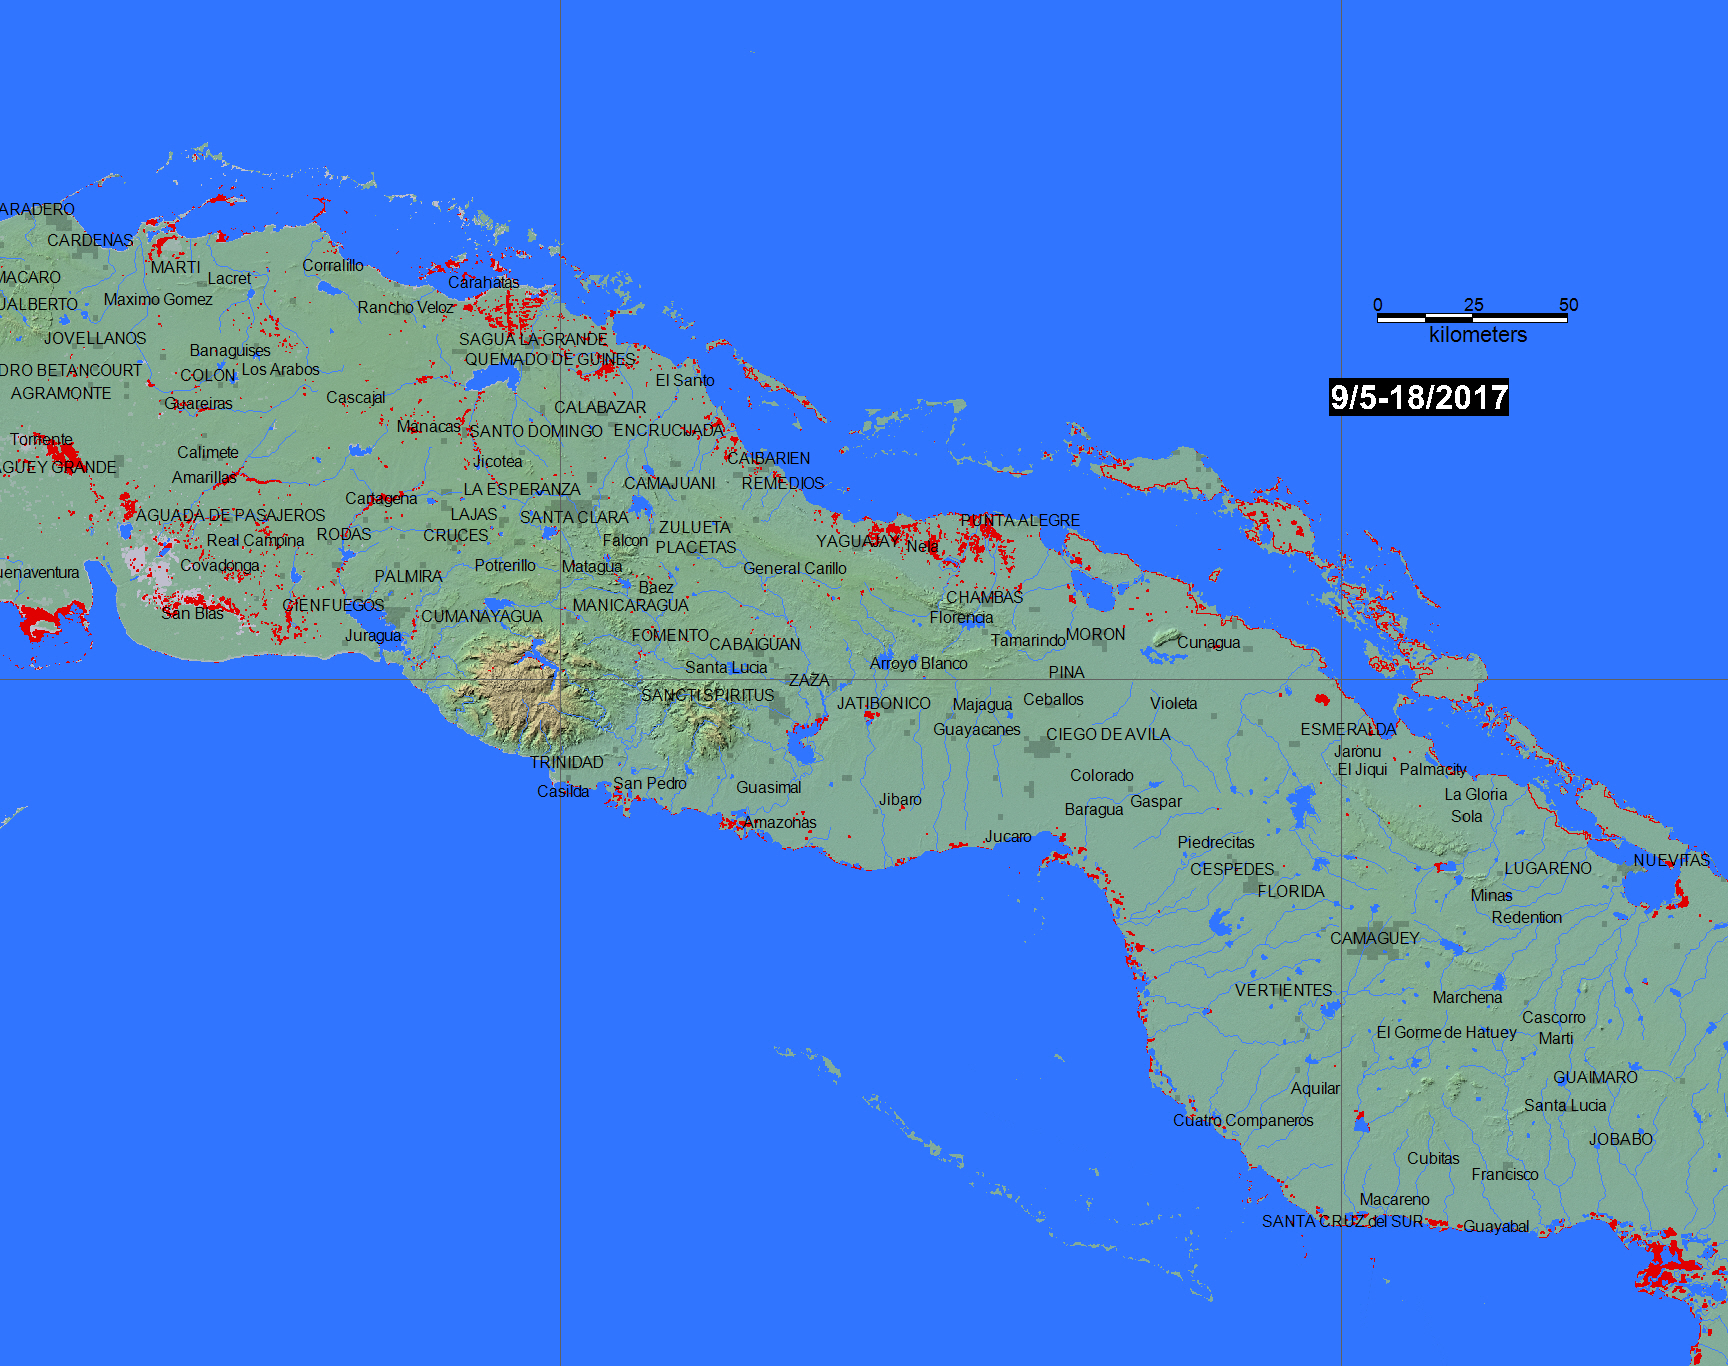
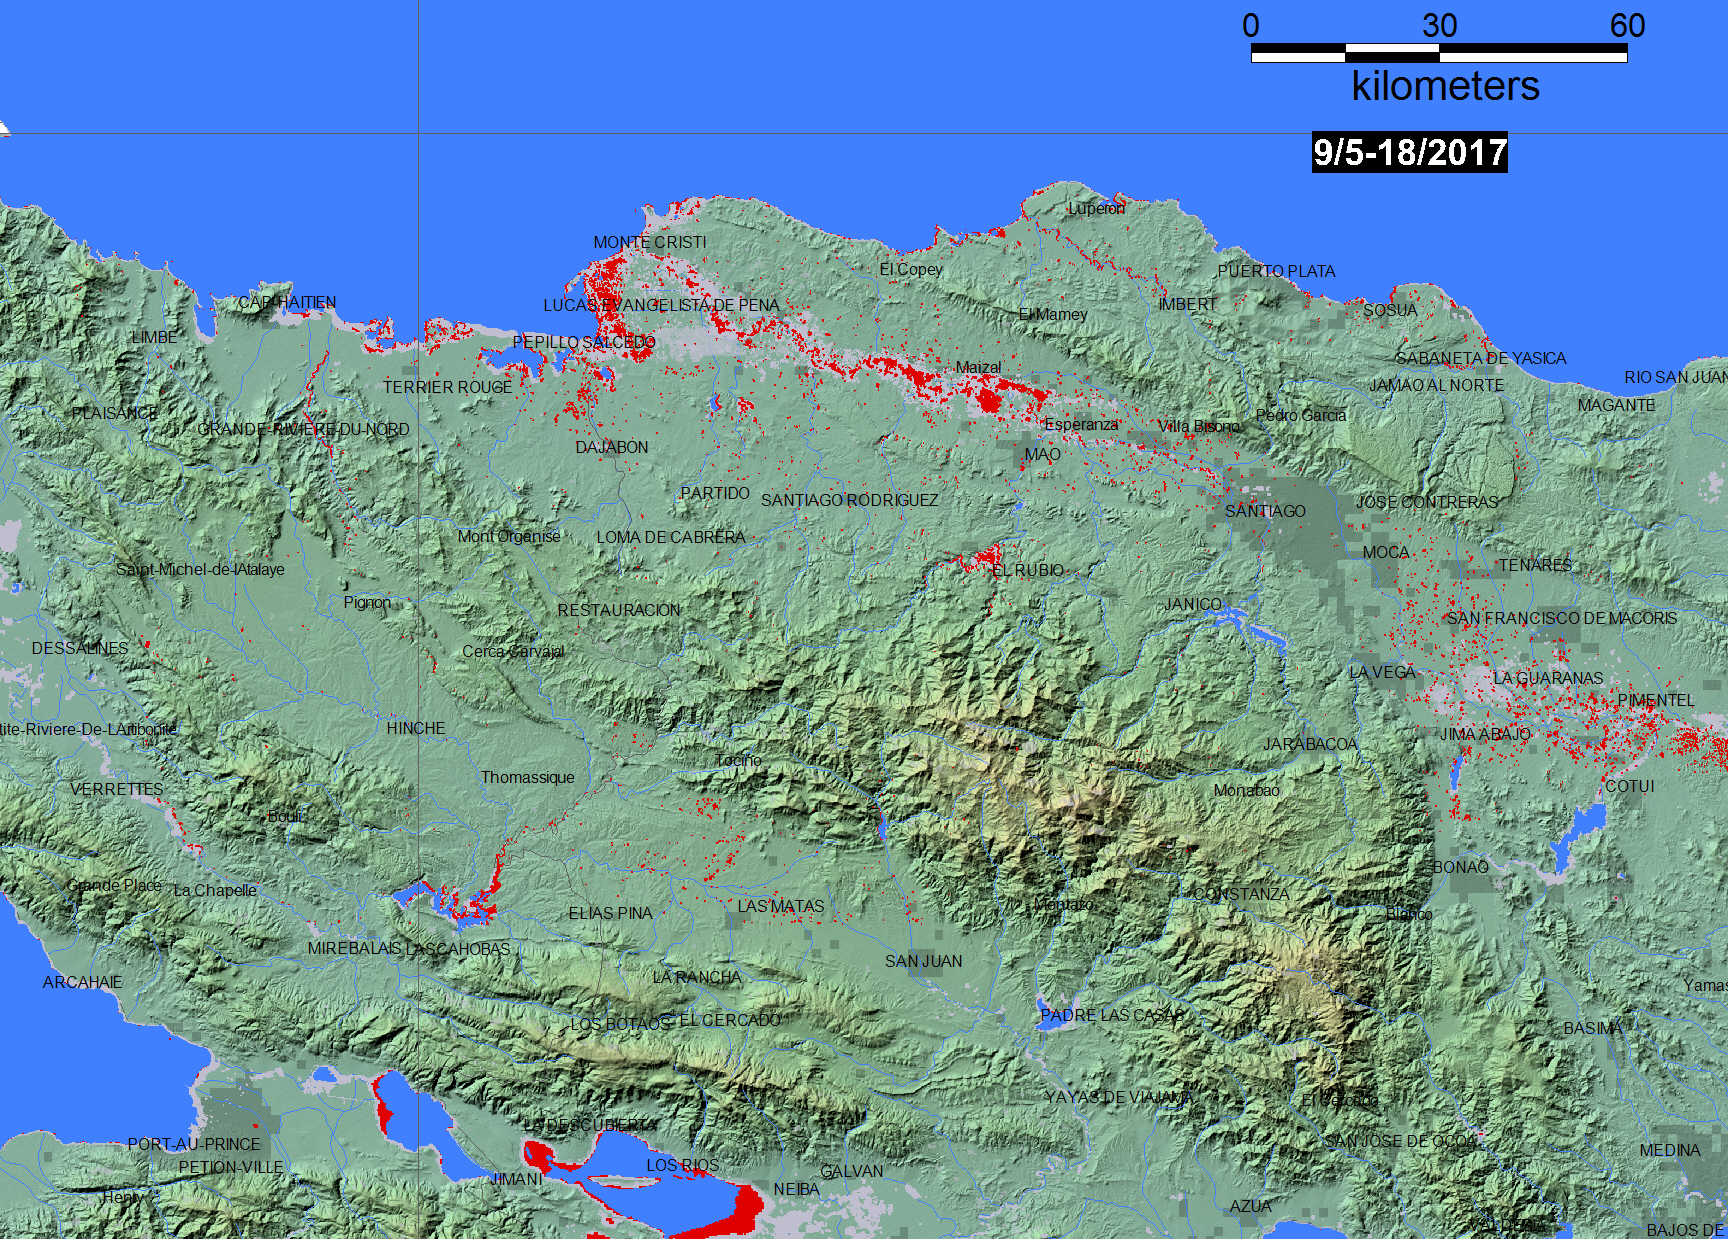
According to Flood List: "12 SEPTEMBER, 2017 BY RICHARD DAVIES IN NEWS, USA. After causing devastating damage across the Caribbean, Hurricane Irma made landfall in the Florida Keys on 10 September and worked it's way north, bringing with it strong winds, storm surge and flooding rain. Irma has since weakened to a Tropical Depression but heavy rainfall remains a threat for many south eastern states. While the Florida Keys and south western areas of the state suffered some of the worst of the winds – gusts of 131 mph (210 km/h) were recorded at Naples Municipal Airport – it was Florida's north east that appears to have taken the brunt of the flooding. Irma has dumped as much as 400 mm of rain in some areas of Florida in the last 3 days. Storm surge and heavy rain conspired to cause rivers to reach record highs in Jacksonville yesterday, 11 September. Flooding also affected coastal areas of Georgia and South Carolina, including Charleston. The city of Jacksonville said via Social Media that the St. Johns River experienced its worst flooding levels since 1846".
In addition to the maps above, for web map service-based (WMS) versions of the same mapping results, visit this DFO link. Zoom in to location of interest, and turn on appropriate event and other data layers.
For its own flood inundation outlines (GIS polygons), DFO provides the source image data information, and the algorithm used. This information allows others to test our approach and replicate the mapping results. Where GIS flood inundation files are used from other organizations, the source is provided. In this case, consult the original authors to determine image analysis, mapping methods and estimates of map accuracy.
Map accuracy depends on many factors, including:
1) Spatial resolution of the sensor used. For example, the DFO MODIS-based results use images at a resolution of 250 m, whereas the Sentinel SAR-based results use images at a spatial resolution of 10 m. Flood extents produced with the former may contain islands of dry land misclassified as water.
2) Geolocation positional accuracy. This depends on the quality of the geocoding information provided by the satellite operator. For example, tests of MODIS (Terra) accuracy show the geocoding globally is accurate to within approximately +/- 50 m.
3) Water or flood classification algorithm used. Within many such algorithms, numerical thresholds are used and are empirically determined. Because, as noted, some MODIS pixels may include both land and water, adjusting such thresholds can somewhat alter the "new water" results (for example, by including, as water, pixels with only fractional water coverage). In practice, DFO and other flood mapping organizations determine and validate such thresholds by comparison to different image data sources. DFO also provides the algorithms and threshold values used.
4) Comparison to a reference ("normal") surface water layer affects map accuracy. Different available data sets are used, as appropriate: a) The NASA SRTM-based SWBD surface water, based on data from February 2000, is at a spatial resolution of 90 m. In DFO online-maps, it is commonly located above the MODIS 250 m surface water results to mask all water imaged by the SRTM mission. b) Or, a masking "normal" water layer is obtained by the same sensor at the same spatial resolution as the new "flood" water. Thus, for Sentinel SAR-based mapping at 10 m resolution, comparison pre-flood surface water extents are obtained from Sentinel data and mask the flood water results.
Brakenridge, G.R. and Kettner, A. J., date, "DFO Flood Event #", Dartmouth Flood Observatory, University of Colorado, Boulder, Colorado, USA, http address.

The maps and web pages provided here are by G. R. Brakenridge and A. J. Kettner and allowable use is guided by the terms of the Creative Commons Attribution-NonCommercial-ShareAlike 4.0 International License. Use for commercial purposes is by permission. Suggested attribution for this map: "Dartmouth Flood Observatory at the University of Colorado, from satellite data provided by NASA and Copernicus/European Space Agency".
NASA Landsat 8 and Copernicus/ESA Sentinel SAR data if used in this map were obtained from the the U.S. Geological Survey Hazards Data Distribution System. and the Sentinels Science Data hub, respectively. Landsat 8 is jointly managed by NASA and the United States Geological Survey. Copernicus is supported by the European Commission.
Sentinel SAR data processing for flood water mapping: Two methods are being used and yield similar results:
Method 1 was developed by Prof. Robert Brakenridge at DFO: Two "exact repeat" images are retrieved from the Copernicus/ESA Sentinels Data hub, from before the flood and during the flood. ESA's SNAP software is used to reproject the two images into a geographic (latitude and longitude) coordinate system. A 7x7 pixel low pass filter is applied to both images. A threshold of 70 is applied to the flood image, resulting in a subset of only very dark (interpreted as water) pixels. A threshold of .7 is applied to a flood image/preflood image ratio product, resulting in a subset of pixels much darker in the flood image then before (this removes permanent surface water). A Boolean "AND" step then provides only pixels that satisfy both conditions. GIS vectors (polygons) are fit around pixels in the final "flood water" results: these are the red areas on the flood event maps, and the provided .shp and matching MapInfo files (whose file names provide the dates of images used). Polygons smaller than .0025 square km in area are removed.
Method 2 was developed by Dr. Son Nghiem, Jet Propulsion Laboratory (JPL), California Institute of Technology. A "Depolarization Reduction Algorithm for Global Observations of inundation ("DRAGON") uses the same SAR satellite data at a resolution of 10 meters. It maps total surface water. DFO subjects the resulting binary single image (water=1/land=2) geotif files to a 7x7 pixel low pass filter, and classifies as "water" pixels on the result showing values <1.6. A GIS polygon is then fit to these water pixels. The resulting .shp file names include "JPL". Work was carried out at the Jet Propulsion Laboratory, California Institute of Technology, and supported by the NASA Land-Cover and Land-Use Change Program and by the NASA Terrestrial Hydrology Program. These results contained modified Copernicus/ESA Sentinel data (2017), processed and analyzed at JPL.
Dr. Patrick Matgen, Luxembourg Institute of Science and Technology (LIST), in collaboration with the ESA Research and Service Support Team and the Global Flood Partnership, also contributes mapping results for some flood events. We have compared results to those from DFO and they are very similar when using the same image data pairs. The method is explained in the following paper "in press": Chini, M., Hostache, R., Giustarini, L., & Matgen, P. 2017. A Hierarchical Split-Based Approach (HSBA) for parametric thresholding of SAR images: flood inundation as a test case, Transactions on Geoscience and Remote Sensing. Flood extent files converted into GIS formats are stored in a separate sub-folder in the GIS data folder.
MODIS data processing
Click here for access to an automated daily MODIS-derived .shp file GIS record (record commences in 2011). Choose appropriate 10 deg x 10 deg map sheet directory and appropriate dates; longitude and latitudes refer to upper left map sheet corner. Not all floods are mappable at the MODIS spatial resolution of 250 m. Some DFO event maps also include these automated MODIS data. If provided in the GIS file directories, the relevant MODIS "Current" file used is renamed to show the date used. These files are an accumulation of all MODIS water for that date and 13 days prior. The data shown on the maximum flood extent maps also refer to the MODIS date range; other satellite image dates are within that date range.
Flood extent files (Shp or Mapinfo) supporting this Flood Event Map are located here.
These files may include high spatial resolution mapping such as from Sentinel or Landsat, or lower resolution files from MODIS. File names commonly include the sensor source (e.g., S1 for Sentinel 1, LS8 for Landsat, MODIS for MODIS) and the image date.
Data from the Global Surface Water Explorer is included as part of the light gray previous mapped maximum surface water extent. It is based on Landsat images at a spatial resolution of 30 m (Jean-Francois Pekel, Andrew Cottam, Noel Gorelick, Alan S. Belward, High-resolution mapping of global surface water and its long-term changes. Nature 540, 418-422, 2016). The NASA Shuttle Water Boundary Data (SWBD) surface water extent (90 m resolution), blue, was derived from NASA's the 11-day February, 2000, SRTM mission and this "permanent" water layer was also corrected using Landsat data. These data are not provided in the GIS directories.
When used in the maps, NASA NRT Global Flood Mapping maximum water extent for the years 2013-2015, at 250 m spatial resolution, provide part of the (light gray) previous satellite-mapped water extent layer. DFO creates these annual water extent layers from data provided by that project, by accumulating into one annual file all of the daily .shp files for each year. DFO has also produced flood extent files through mapping of individual floods (~ yr 2000 to present); these are also included in this layer.
When used in the maps, Copernicus Emergency Management Service data are imported as GIS files and installed in the GIS data folder. "Delineation" files refer to flood inundation extents. Dissemination Policy: Under Copernicus and Commission Delegated Regulations, the information produced by the Copernicus Emergency Management Service shall be made available to the public on a full, open and free-of-charge basis. Attribution of the source is required "Copernicus Emergency Management Service, Directorate Space, Security and Migration, European Commission Joint Research Centre (EC JRC). Accessed date. http://emergency.copernicus.eu/".
 |
 |
 |
|---|---|---|
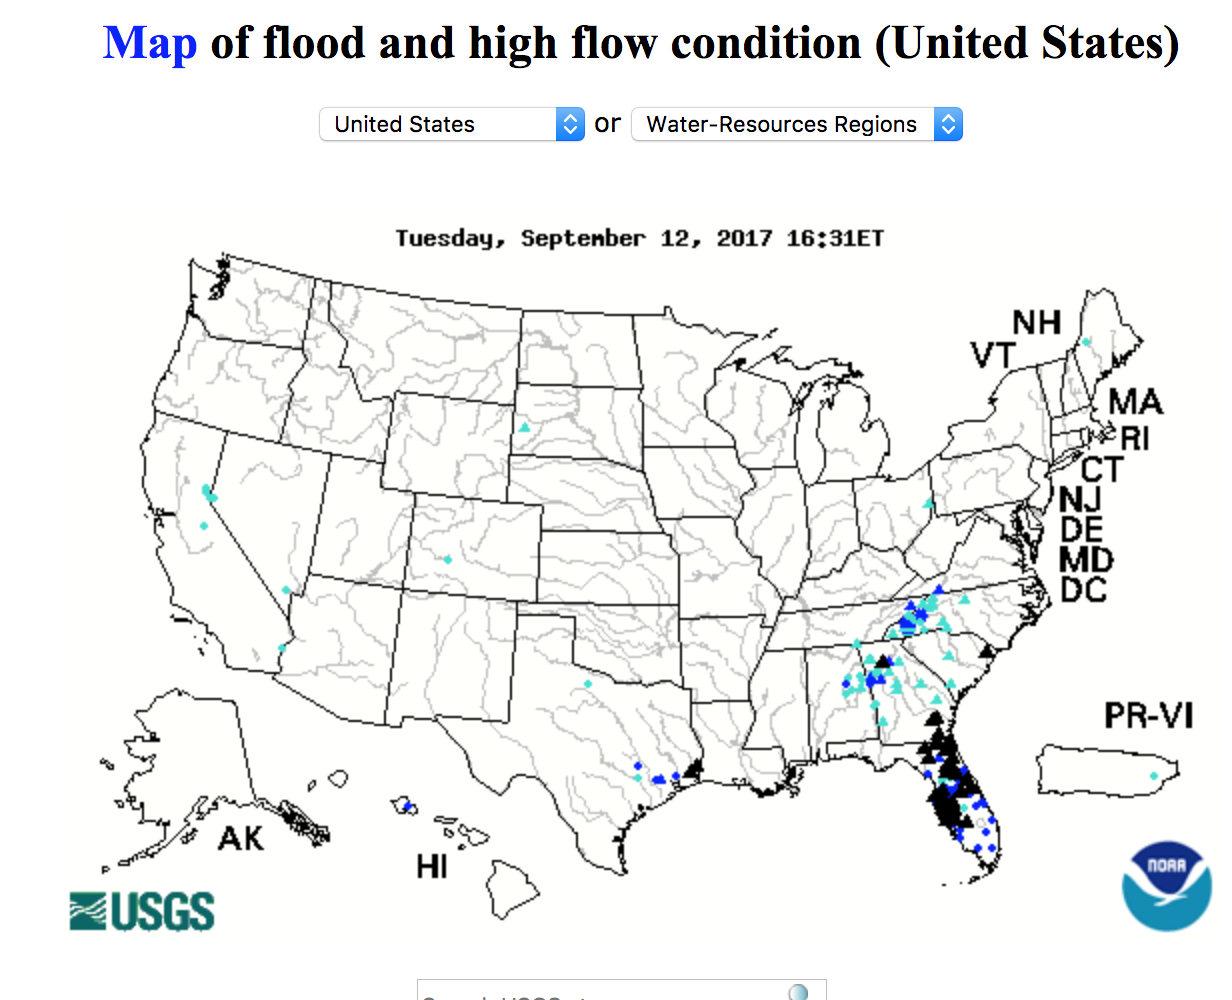
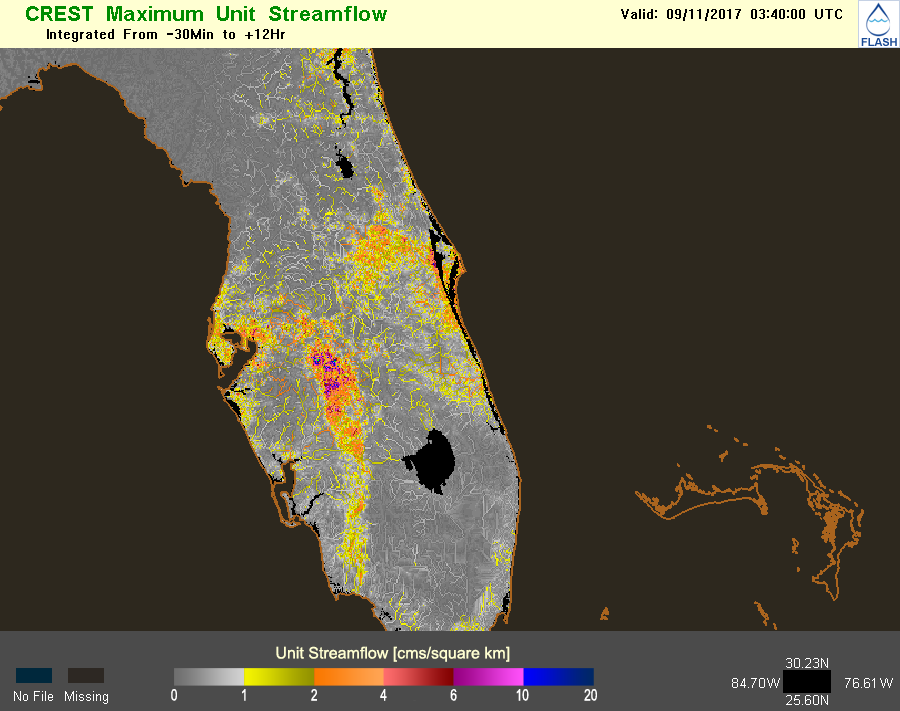
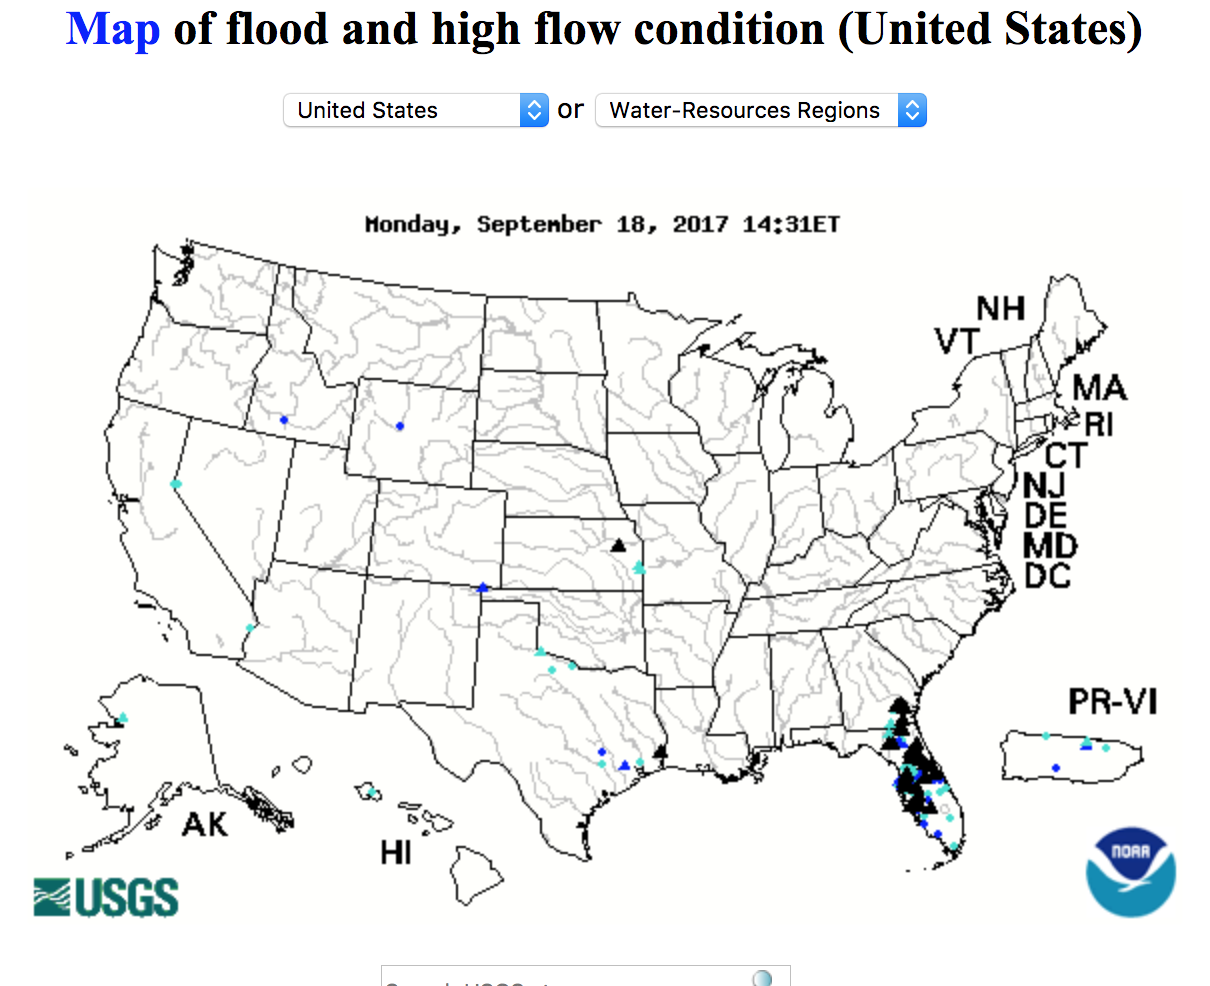
| USGS Water Watch | CREST Model U.S. flash flood system, 1-km/2-minute resolution forced with radar QPE. Triangles are stream gauges with observed flooding stages of purple -> major, red -> moderate, orange -> minor, yellow ->action. Courtesy Zac Flamig, NOAA CIMSS Operational Flash. | USGS Water Watch |
.gif) |
 |
|
|---|---|---|
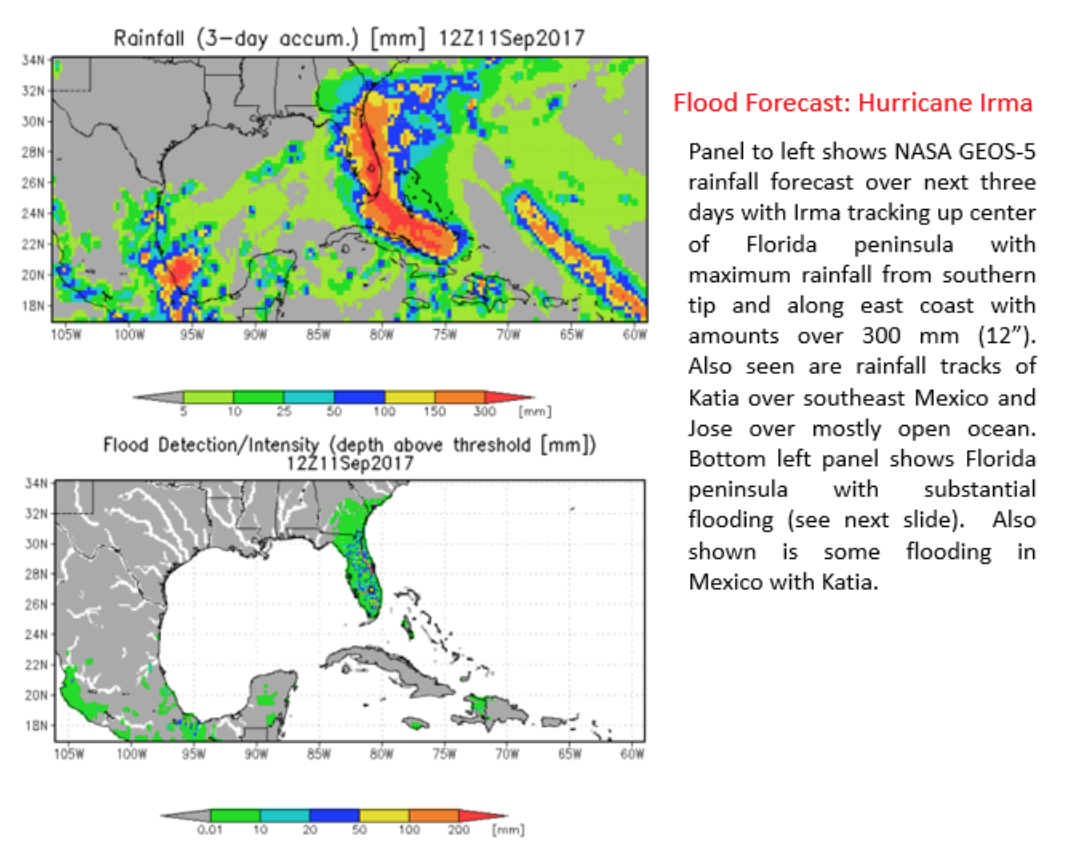
| Colorado State Univesity/NOAA Cooperative Institute for Research in the Atmosphere NOAA GOES-16 Loop: Irma. | Flood forecasting information courtesy Dr. Robert Adler, University of Maryland |
 |
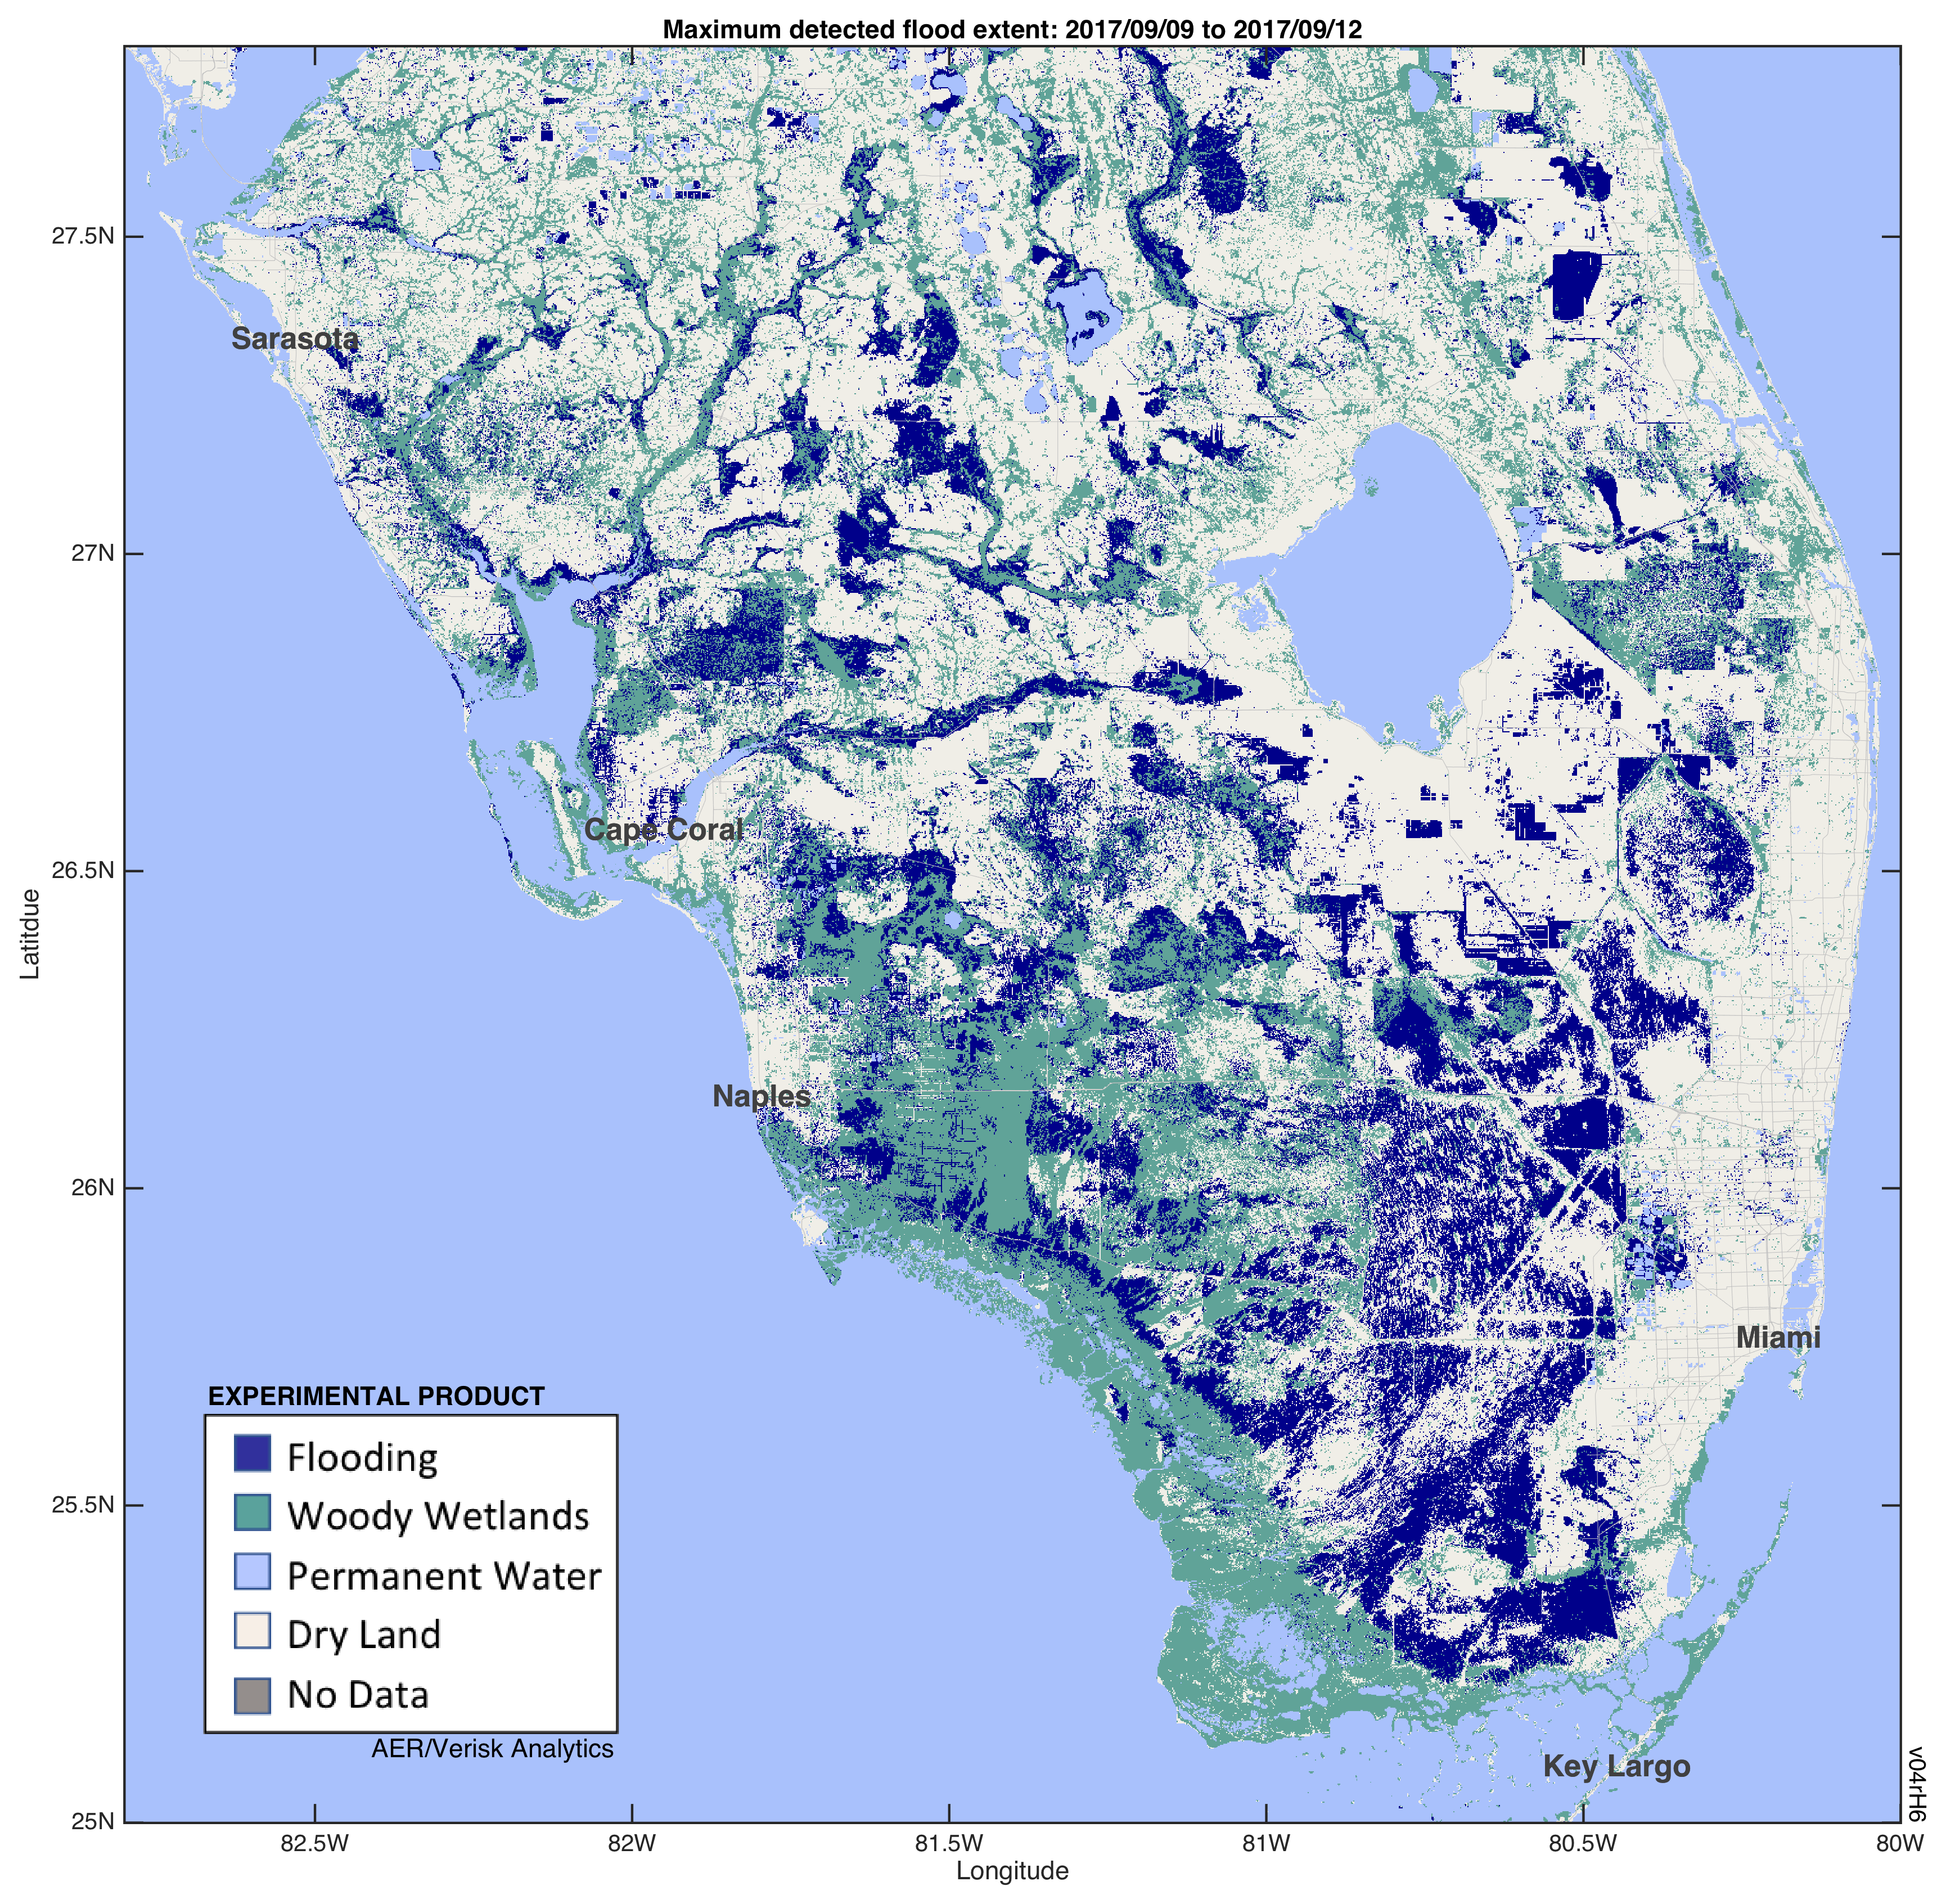 |
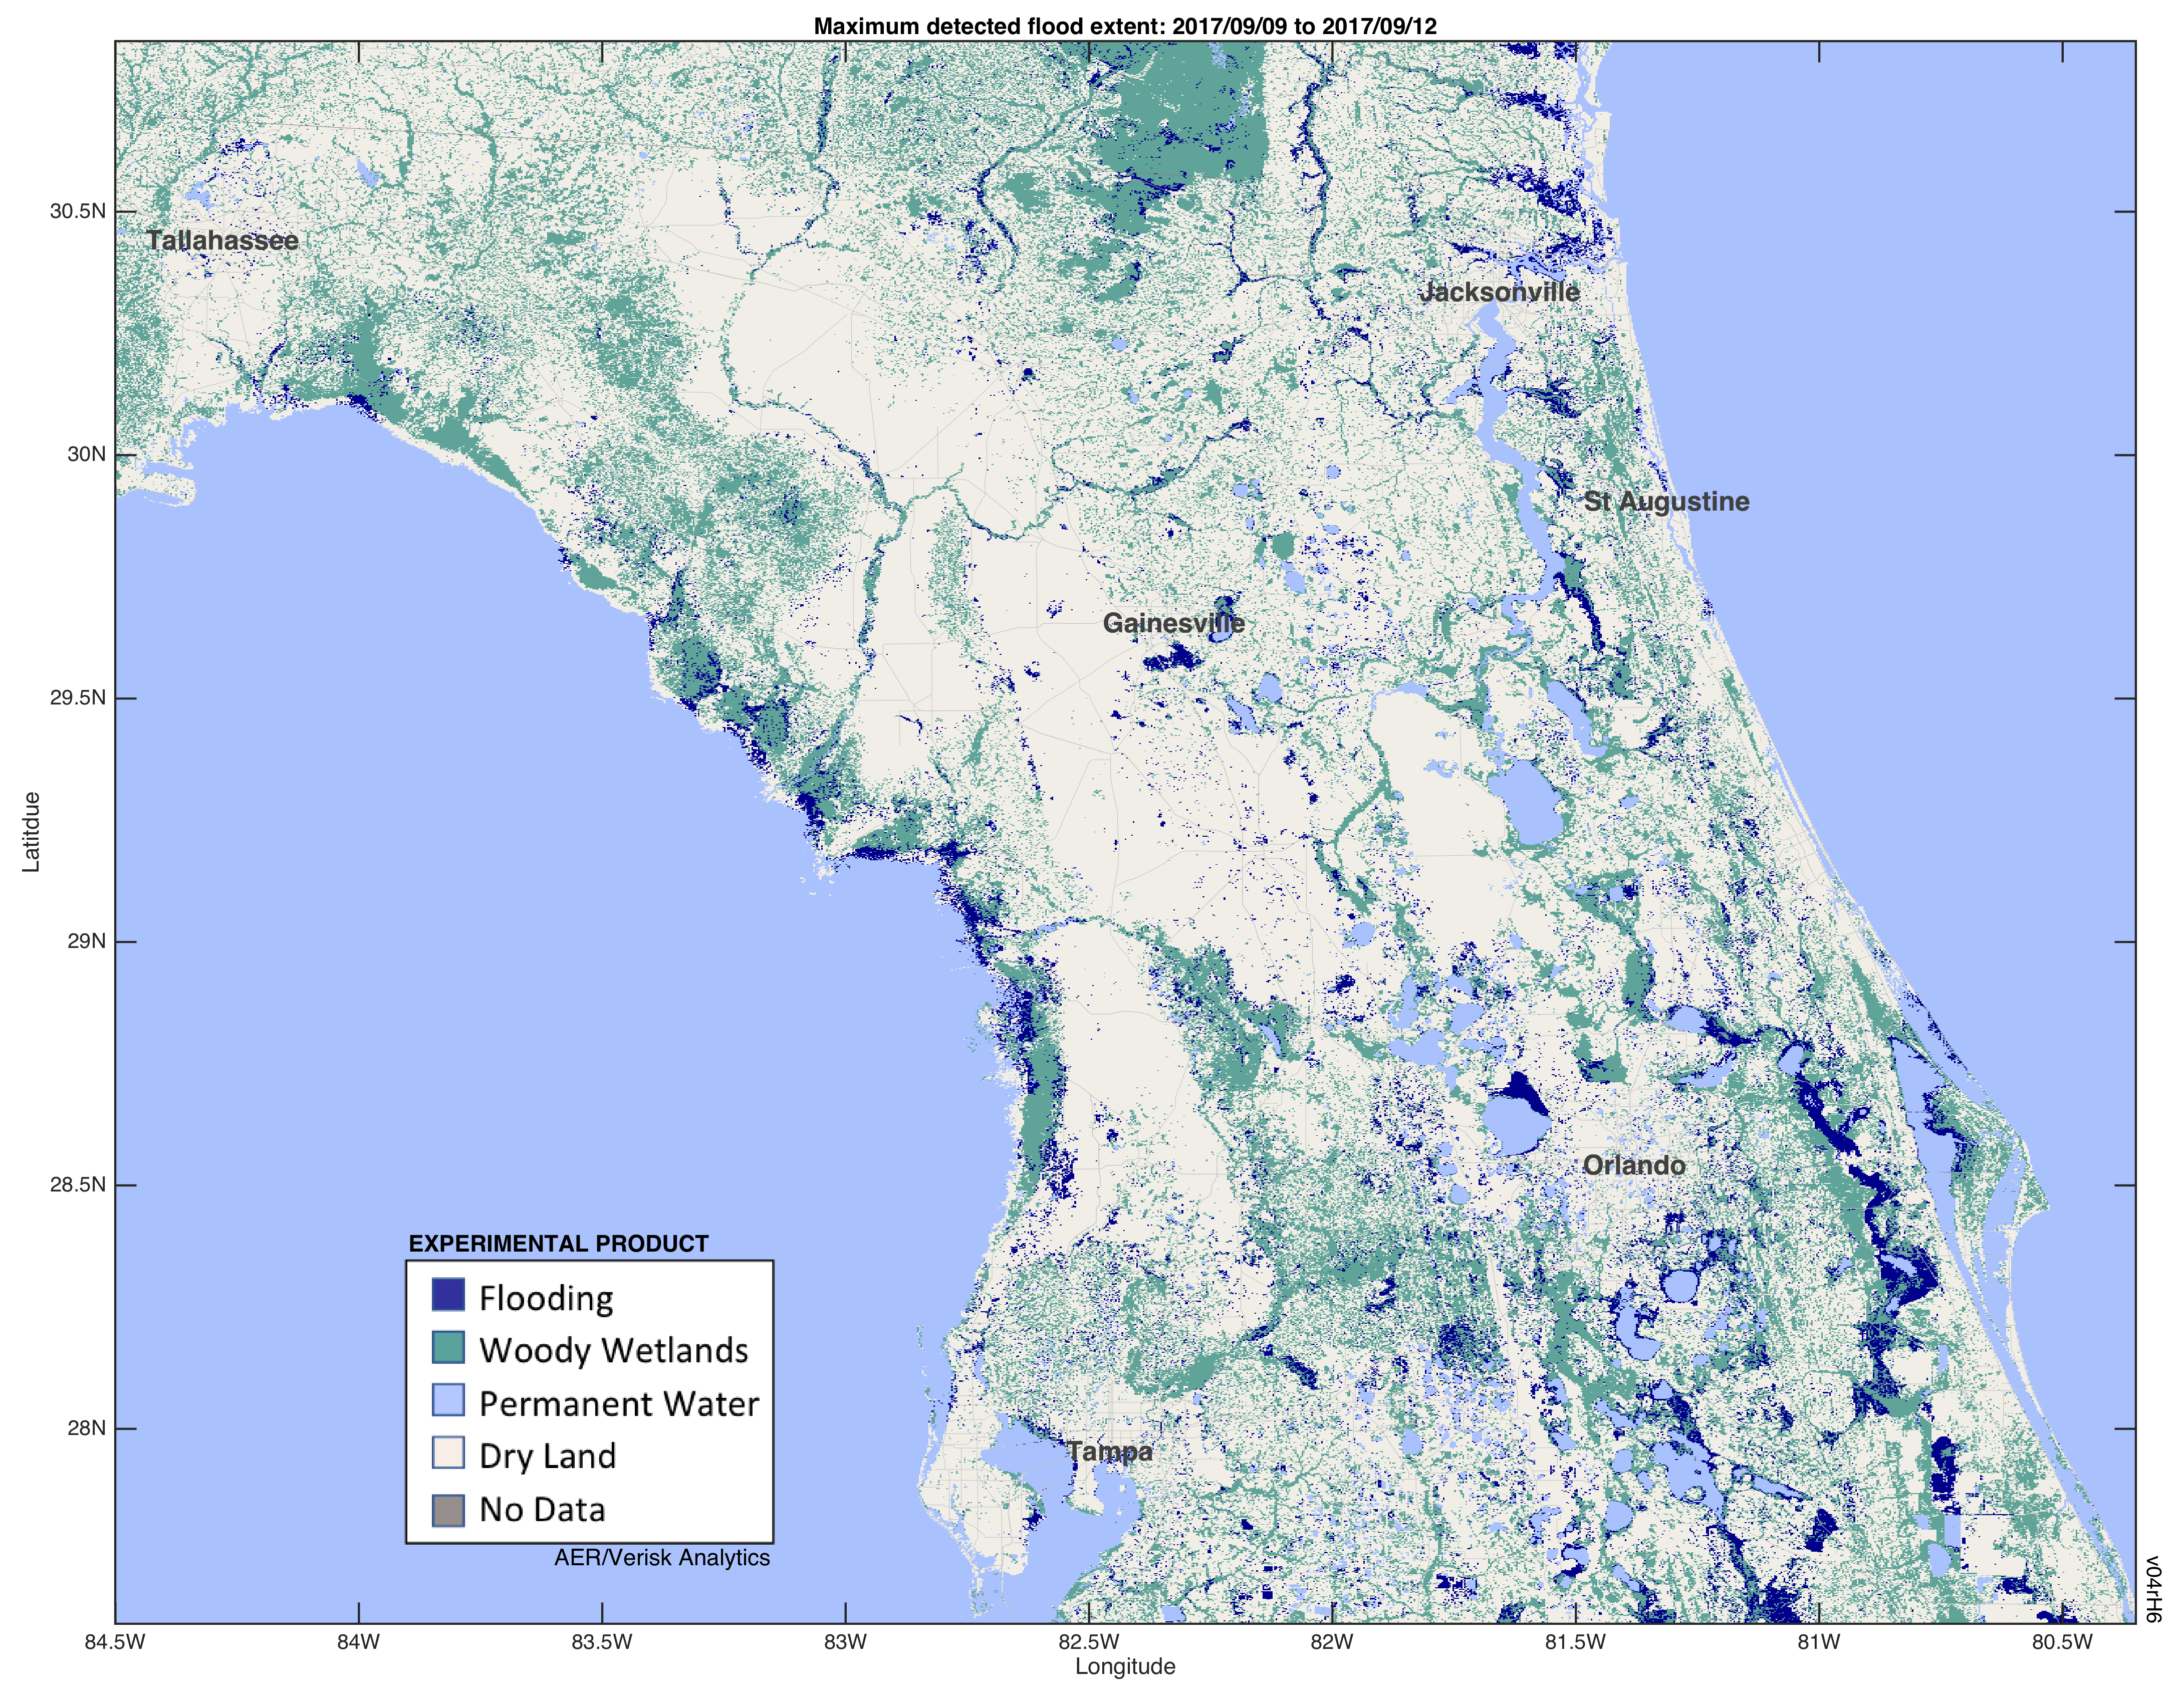
| Experimental version of product designed to rapidly map maximum flood extent based on passive microwave satellite information. as soon as possible. Flooded fraction is derived from 22-km data (AMSR2 or GMI) and downscaled using a footprint-matched database built from topography and Global Surface Water Explorer data. Inland flood extent is mapped where there is at least ~6% flooding within a ~22-km diameter area. Some islands are too small for flood detection (e.g., Galveston Island is ~3km wide; it would have to be >50% under water to trigger a detection). Woody wetlands are included as a class here automatically because algorithm assumes they are flooded in this situation. From: John Galantowicz, Ph.D., Principal Scientist, Atmospheric and Environmental Research, Inc. (AER), 131 Hartwell Ave., Lexington, MA 02421-3126, http://www.aer.com, jgalanto@aer.com. Versions of the regular flood mapping products can be found at: http://product.aer.com/index.php/floodscan (covering Africa and S. America
). | |
|---|---|---|---|
| AER's microwave-derived maximum detected flood extent algorithm using AMSR2 data through 12 Sept ~2am local time. | AER's microwave-derived maximum detected flood extent algorithm using AMSR2 data through 12 Sept ~2am local time. |
 |
||
|---|---|---|
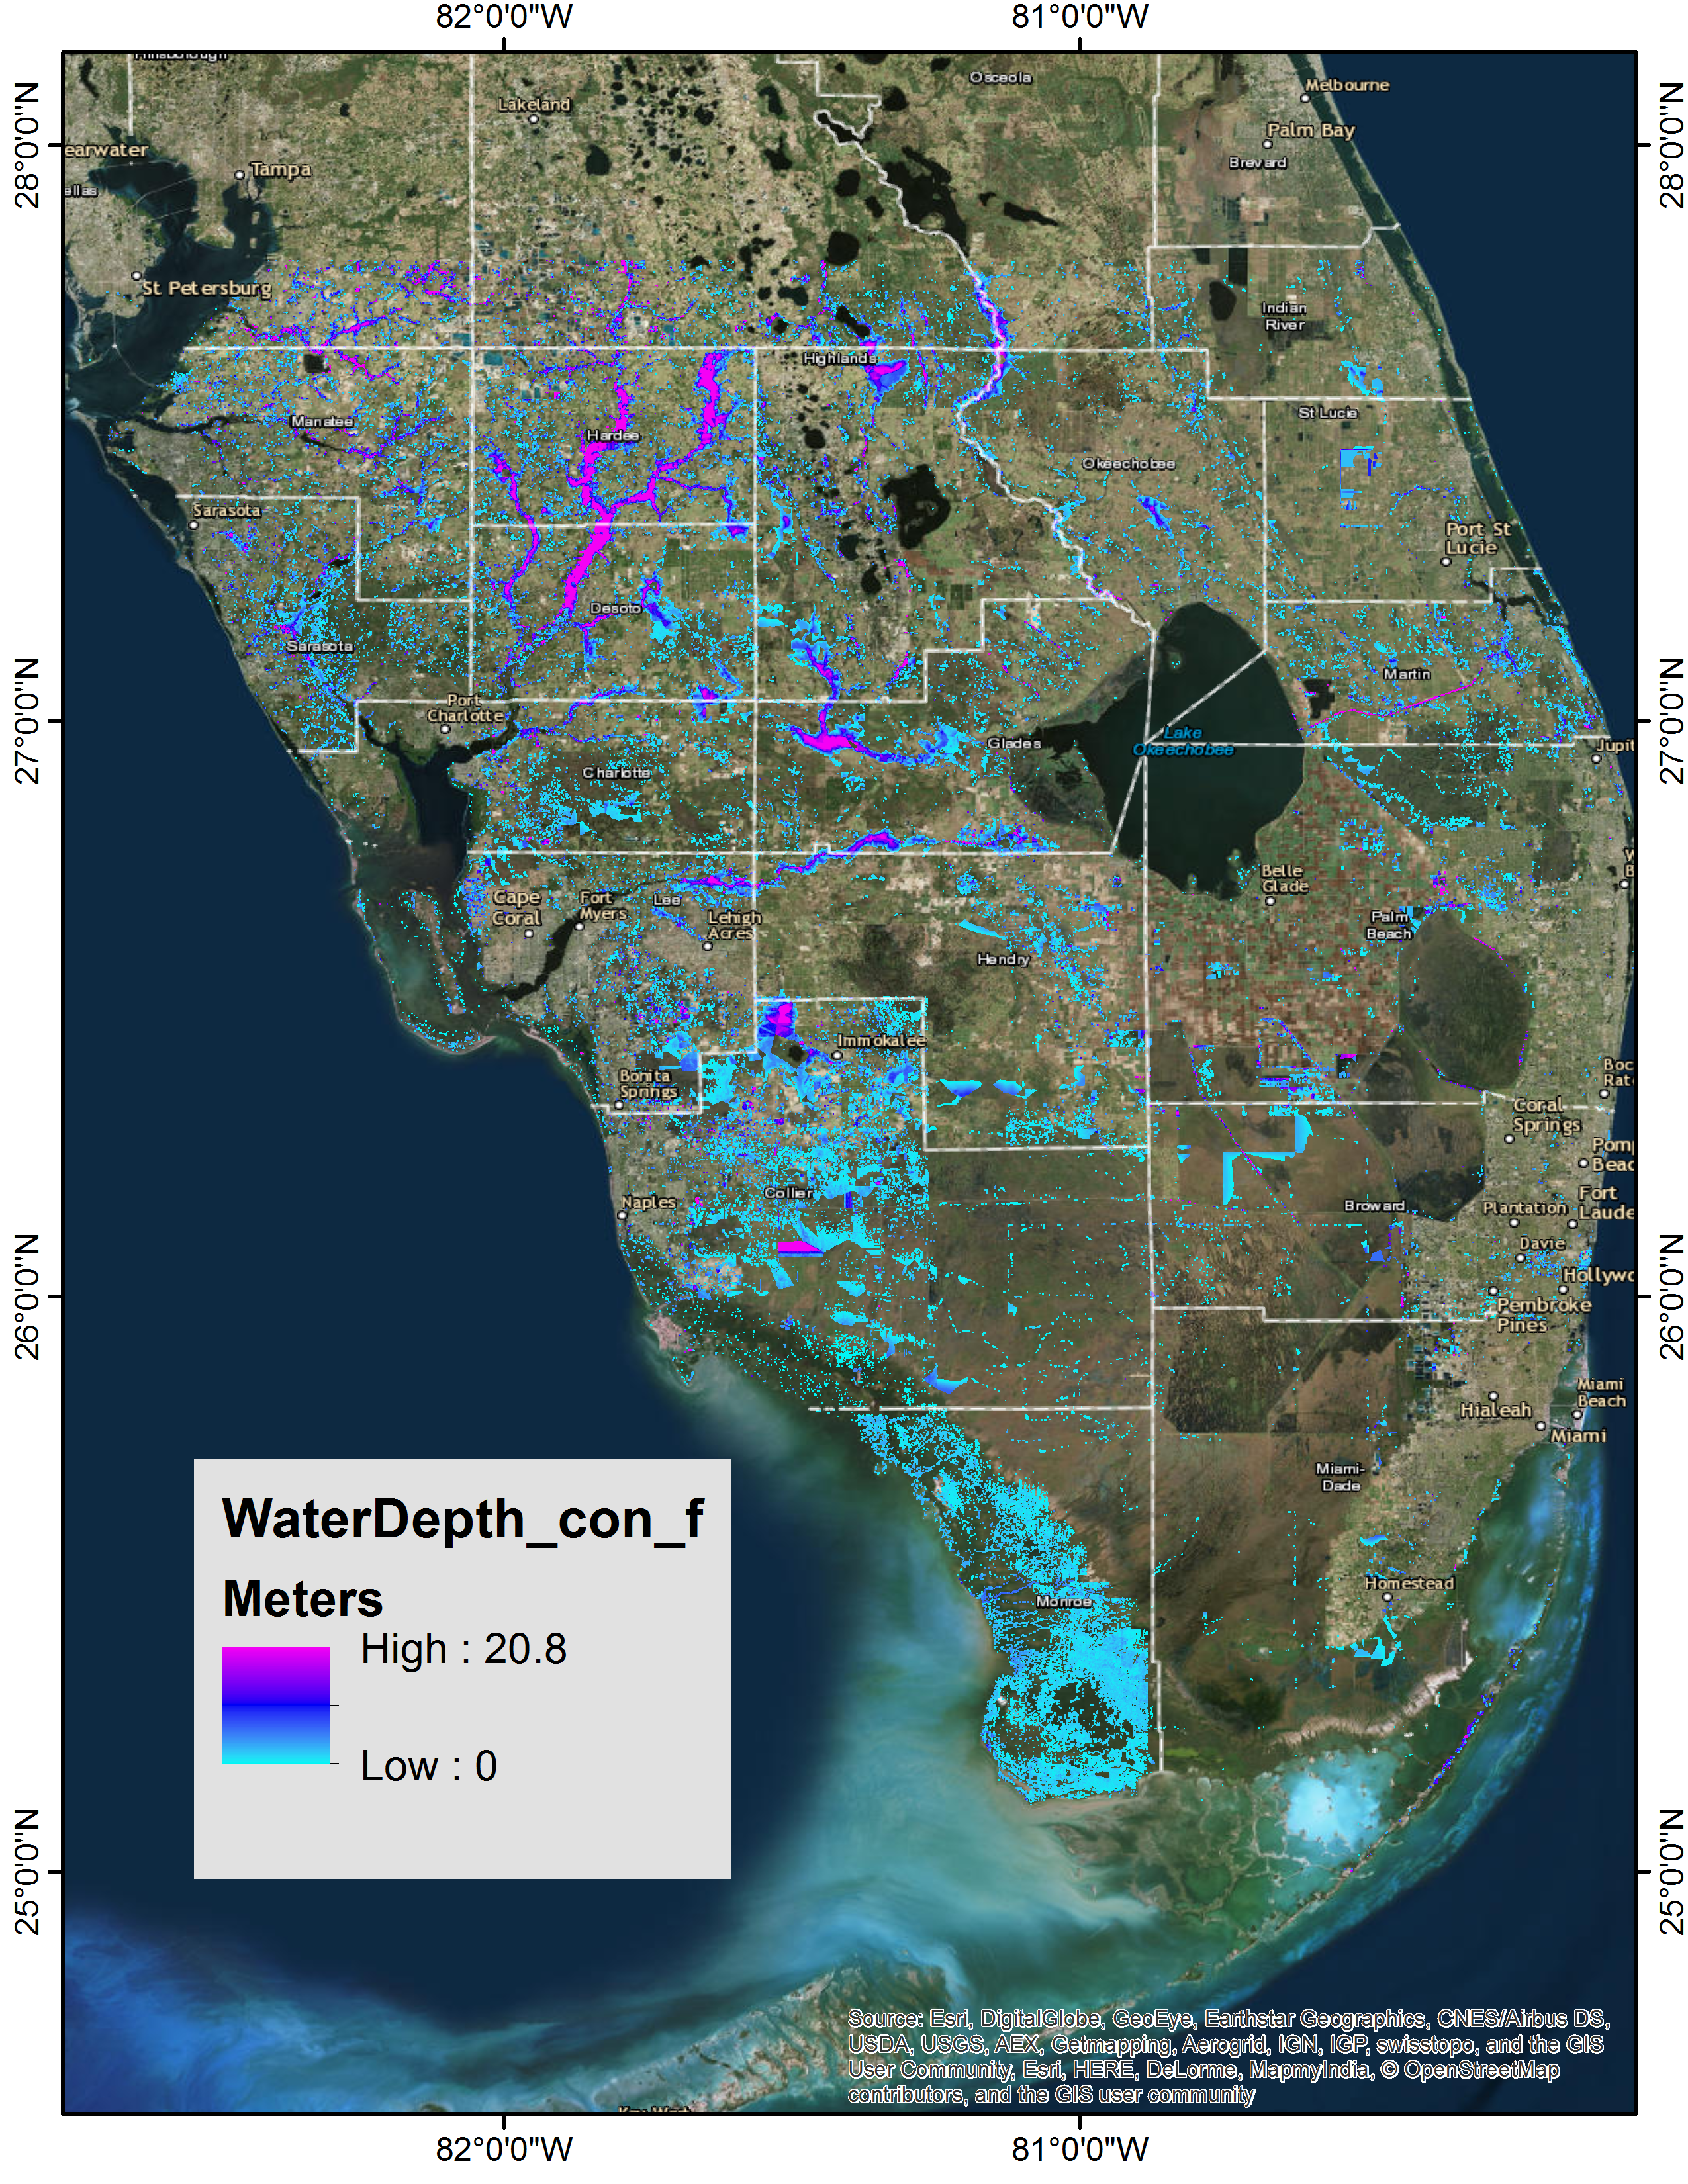
| Floodwater depths (meters) calculated with a simplified version of the Floodwater Depth Estimation Tool (FwDET; Cohen et ., in press at Journal of the American Water Resources Association). FwDET use a DEM and a flood extent map to calculate water depth for each cell within the flooded domain based on the elevation difference between itself and its nearest flood boundary cell. This map was calculated based on John Galantowicz (AER) flood map information (see above) using an AMSR2 overpass of Florida at ~0200 local time on 11 Sept. and a 90m DEM from the National Elevation Dataset (NED). Retrieve full resolution geotif version. |
The NASA Earth Sciences Program, the Latin American Development Bank, the World Bank, the European Commission's Global Disaster Alert and Coordination System, GDACS, and Copernicus Emergency Management Service, the Google Earth Engine research awards program, the Committee on Earth Observation Satellites (CEOS) Disasters Working Group-Flood Pilot, the Japanese Space Agency, and the European Space Agency all have supported the Observatory's work via research grants and contracts or by provision of free satellite-derived data.
The Dartmouth Flood Observatory was founded in 1993 at Dartmouth College, Hanover, NH USA and moved to the University of Colorado, INSTAAR, CSDMS in 2010. Its sustained operation depends on continued grant and project support. Gift contributions can be accepted; if your organization uses these data and maps, please consider helping to sustain this effort. The institutional support of both universities is gratefully acknowledged.
(counting since September 10, 2017)