


The Flood Observatory maintains a Global Active Archive of large flood events, 1985 to present. New major flood events are entered into this archive each week. A single GIS polygon for each event defines in approximate terms the total area affected.
In some cases, severe or damaging floods become the focus of Observatory inundation mapping. As part of collaborations with other organizations, and the Global Flood Partnership, the Observatory's maps and other data are made available to the public. With attribution, they can be used and shared freely for non-commercial purposes. By permission, which is freely granted, they can be used for commercial purposes. Consult the Creative Commons license shown below. Geotif versions and GIS files are also provided for these maps.
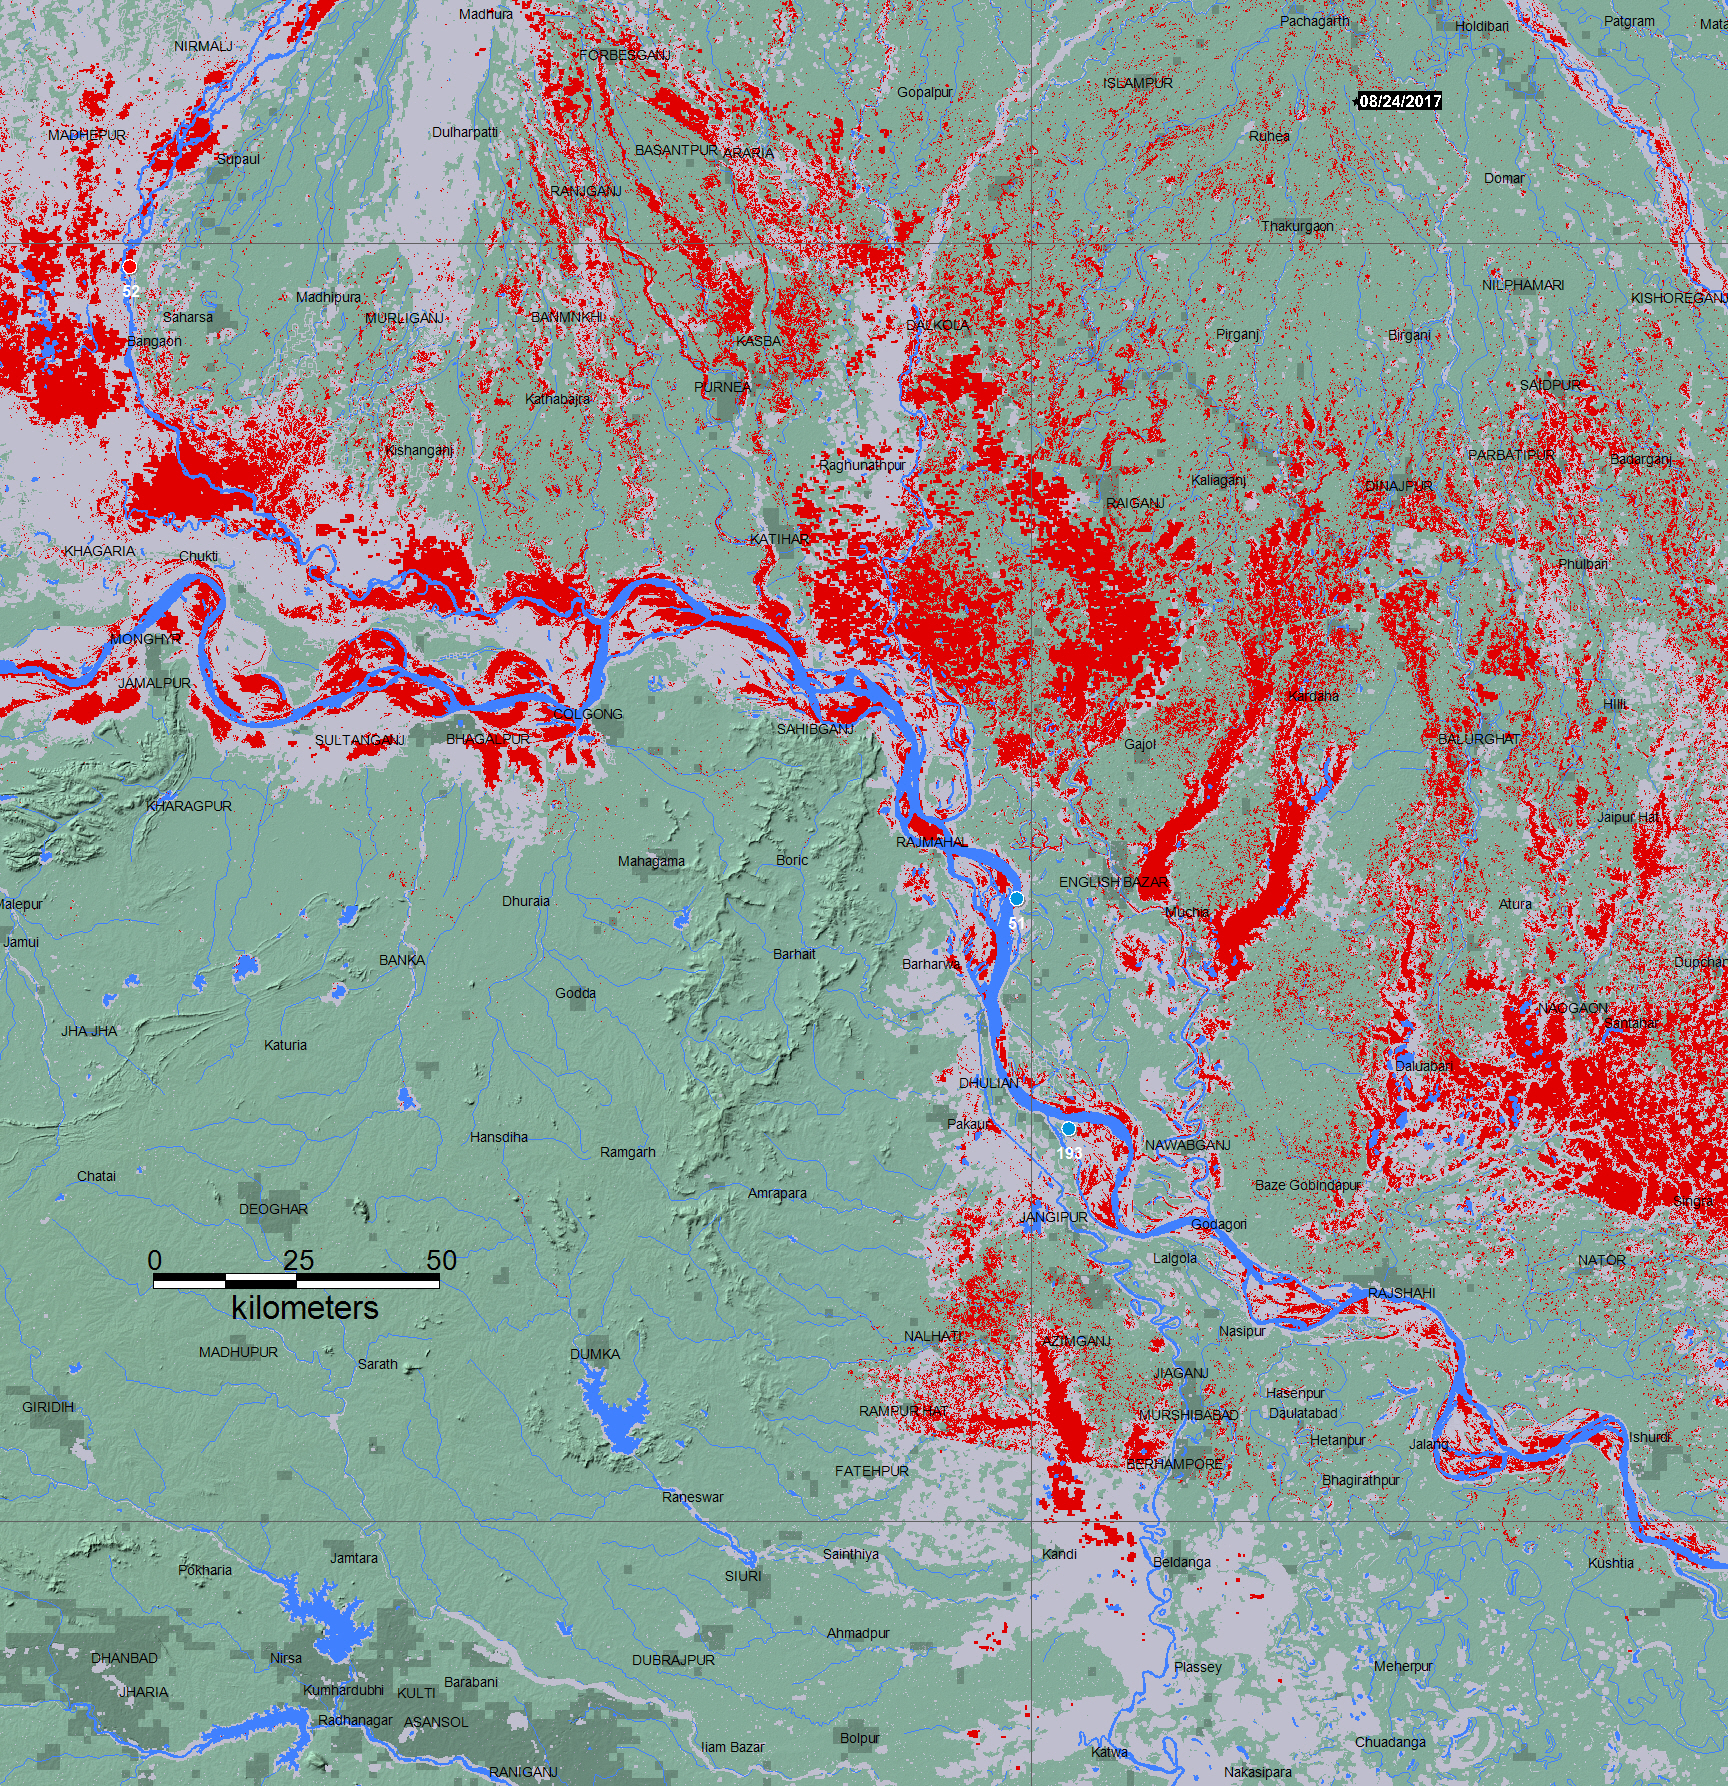
This event is selected for Observatory production of map and GIS data products.This web page and associated image and map (GIS) files are the permanent Flood Observatory record of this event. As the flood event proceeds, additional flood extent layers and maps may be added; the objective is mapping of the maximum extent flooded.
According to Flood List: ":India – Bihar Floods Death Toll Rises to 253, Almost 700,000 Displaced 21 August, 2017 by Richard Davies in Asia, News. The flood situation in the state of Bihar, India, worsened over the weekend when a further 51 deaths were reported. Aerial survey of the flood-affected areas of Purnia, Bihar, 14 August 2017. The recent fatalities bring the death toll to 253 in the state since flooding first began after a period of heavy rain from 10 August. Almost 7,000 villages in 20 districts (of 38 in total) have now been affected, according to Bihar’s Disaster Management Department. A total of 19,000 homes have been damaged or destroyed and 696,811 people displaced, including 70,000 in the last 2 days. Authorities have set up 1,358 relief camps, currently housing 422,106 people. As of 20 August, the Flood Monitoring Cell of the Water Resources Department, Government of Bihar, reported that rivers are above danger levels in 14 different locations, including the Kosi river at Kursela, Katihar district, the Mahananda river at Dhengraghat, Purnia and the Gandak at Dumariaghat, Gopalganj district. The government of Bihar is calling for donations to help all those affected by the flooding".
In addition to the maps above, for web map service-based (WMS) information visit this DFO link. Zoom in to location of interest, and turn on appropriate event and other data layers. See this link for examples of WMS output for this flood.
At selected locations, a time series of satellite microwave-based daily river discharge measurements are available from the Flood Observatory. See River Watch Global Display for more information. A sample from Site 52 is shown below.
Brakenridge, G.R. and Kettner, A. J., date accessed, "DFO Flood Event #", Dartmouth Flood Observatory, University of Colorado, Boulder, Colorado, USA, http address.

The maps and web pages provided here are by G. R. Brakenridge and A. J. Kettner and use should be guided by the terms of the Creative Commons Attribution-NonCommercial-ShareAlike 4.0 International License.
NASA Landsat 8 and ESA Sentinel SAR data if used in this map were obtained from the the U.S. Geological Survey Hazards Data Distribution System. and the Sentinels Science Data hub, respectively. Landsat 8 is jointly managed by NASA and the United States Geological Survey.
Notes on Sentinel SAR data processing: Most commonly, two "exact repeat" images are retrieved from ESA's Sentinels Data hub, from before the flood and during the flood. ESA SNAP software is used to reproject the two images into a geographic (latitude and longitude) coordinate system. A 7x7 pixel low pass filter is applied to both images. A threshold ranging from 50-70 is applied to the flood image, resulting in a subset of only very dark (interpreted as water) pixels. A threshold of .5-.7 is applied to a flood image/preflood image ratio product, resulting in a subset of pixels much darker in the flood image then before (this removes permanent surface water). A Boolean "AND" step then provides only pixels that satisfy both conditions.The exact thresholds used vary in the ranges provided; more strict thresholds map less flood water but also produce less false-positive errors. GIS vectors (polygons) are fit around pixels in the final "flood water" results: these are the red areas on the flood event maps, and the provided .shp and matching MapInfo files. Polygons smaller than .0025 square km in area are removed. Dates of image pair(s) used: August 18 and May 14, 2017 (before).
Notes on MODIS data processing
Click here for access to an automated daily MODIS-derived .shp file GIS record (record commences in 2011). Choose appropriate 10 deg x 10 deg map sheet directory and appropriate dates; longitude and latitudes refer to upper left map sheet corner. Not all floods are mappable at the MODIS spatial resolution of 250 m. Some DFO event maps also include these automated MODIS data. If provided in the GIS file directories, the MODIS "Current" file used is provided with its date; the file is an accumulation of all MODIS water for that date and 13 days prior. Date of MODIS data used: August 10-24, 2017.
Flood extent files (Shp or Mapinfo) supporting this Flood Event Map are located here.
These files may include high spatial resolution mapping such as from Sentinel or Landsat, or lower resolution files from MODIS. File names commonly include the sensor source (e.g., S1 for Sentinel 1, LS8 for Landsat, MODIS for MODIS).
Data from the Global Surface Water Explorer is included as part of the light gray previous satellite-mapped water extent. It is based on Landsat data at a spatial resolution of 30 m (Jean-Francois Pekel, Andrew Cottam, Noel Gorelick, Alan S. Belward, High-resolution mapping of global surface water and its long-term changes. Nature 540, 418-422, 2016). The NASA Shuttle Water Boundary Data (SWBD) surface water extent (90 m resolution), blue, was derived from NASA's the 11-day February, 2000, SRTM mission and this "permanent" water layer was also corrected using Landsat data. These data are not provided in the GIS directories.
When used, NASA NRT Global Flood Mapping maximum water extent for the years 2013-2015, at 250 m spatial resolution, provide part of the (light gray) previous satellite-mapped water extent layer. DFO creates these annual water extent layers from data provided by that project, by accumulating into one annual file all of the daily .shp files for each year. DFO has also produced flood extent files through mapping of individual floods (~ yr 2000 to present); these are also included in this layer.
The NASA Earth Sciences Program, the Latin American Development Bank, the World Bank, the European Commission (Global Disaster Alert and Coordination System, GDACS), the Google Earth Engine research awards program, the Committee on Earth Observation Satellites (CEOS) Disasters Working Group-Flood Pilot, the Japanese Space Agency, and the European Space Agency all support or have supported this work via research grants and contracts or by provision of free satellite-derived data.
The Dartmouth Flood Observatory was founded in 1993 at Dartmouth College, Hanover, NH USA and moved to the University of Colorado, INSTAAR, CSDMS in 2010. The institutional support of both universities is gratefully acknowledged.
(counting since August 23, 2017)