


The Flood Observatory created and maintains a global active archive of large flood events, 1985 to present. It is available to the public in both spreadsheet and GIS formats. New events are entered into this archive each week. As of the end of 2015, there were 4319 events; each has a unique archive number and, starting in 2016, a unique name (example: "2016-Southern USA-4337").
The event information inludes: a polygon outlining the geographic area affected, estimated start and end dates, centroid of the polygon, reported deaths and displaced (occupants of flooded dwellings are included), text location information, causation, and a numerical severity estimate: 1 (relatively frequent but damaging), 1.5 (major), and 2 (extreme). News and other media reports during the flood are used; our resources do not permit further evaluation with more accurate data afterwards.
In some cases, large floods then become the focus of Observatory remote sensing data collection and flood inundation mapping. As part of collaborations with other organizations, and the Global Flood Partnership, the Observatory's maps and other data are made available to the public. With appropriate citation of the source, they can be used freely, including for commercial purposes, under the terms of the Creative Commons Attribution 3.0 Unported License.
Because this event has been selected for Observatory production of map and GIS data products, additional event infomation is provided below in the form of images and with links to their sources. Please make sure to cite the primary source and follow any restrictions provided. New maps and links to related data are added as the event evolves. Afterwards, this web page and associated linked files reside here permanently as the Flood Observatory map record of this event.
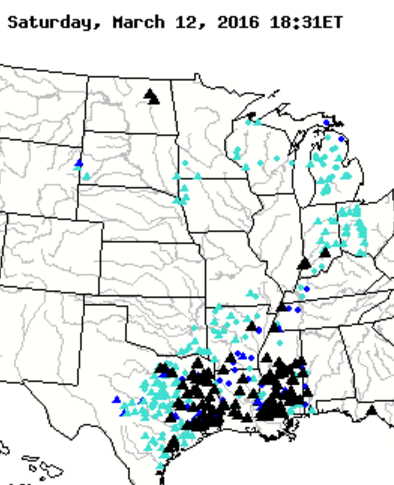
At selected locations, a time series of satellite microwave-based daily river discharge measurements are available from the Flood Observatory. See River Watch Global Display for more information. A sample from Site 100176 in this map sheet is shown below. In the online version of this map sheet, the river reaches monitored by each site are clickable and provide data access. White triangles: ice covered. Yellow dots: low flow (<5th percentile mean daily runoff for this date, 1998-2012); Blue dots: normal flow; Purple dots: moderate flooding (>1.5 yr recurrence); Red dots, major flooding (> 5 yr recurrence).

Citation: Brakenridge, G.R., Kettner, A.J., Slayback, D. and Policelli, F., date accessed, "Flood Event Map, 2015USA4314", Dartmouth Flood Observatory, University of Colorado, Boulder, CO, USA, http://floodobservatory.colorado.edu/.
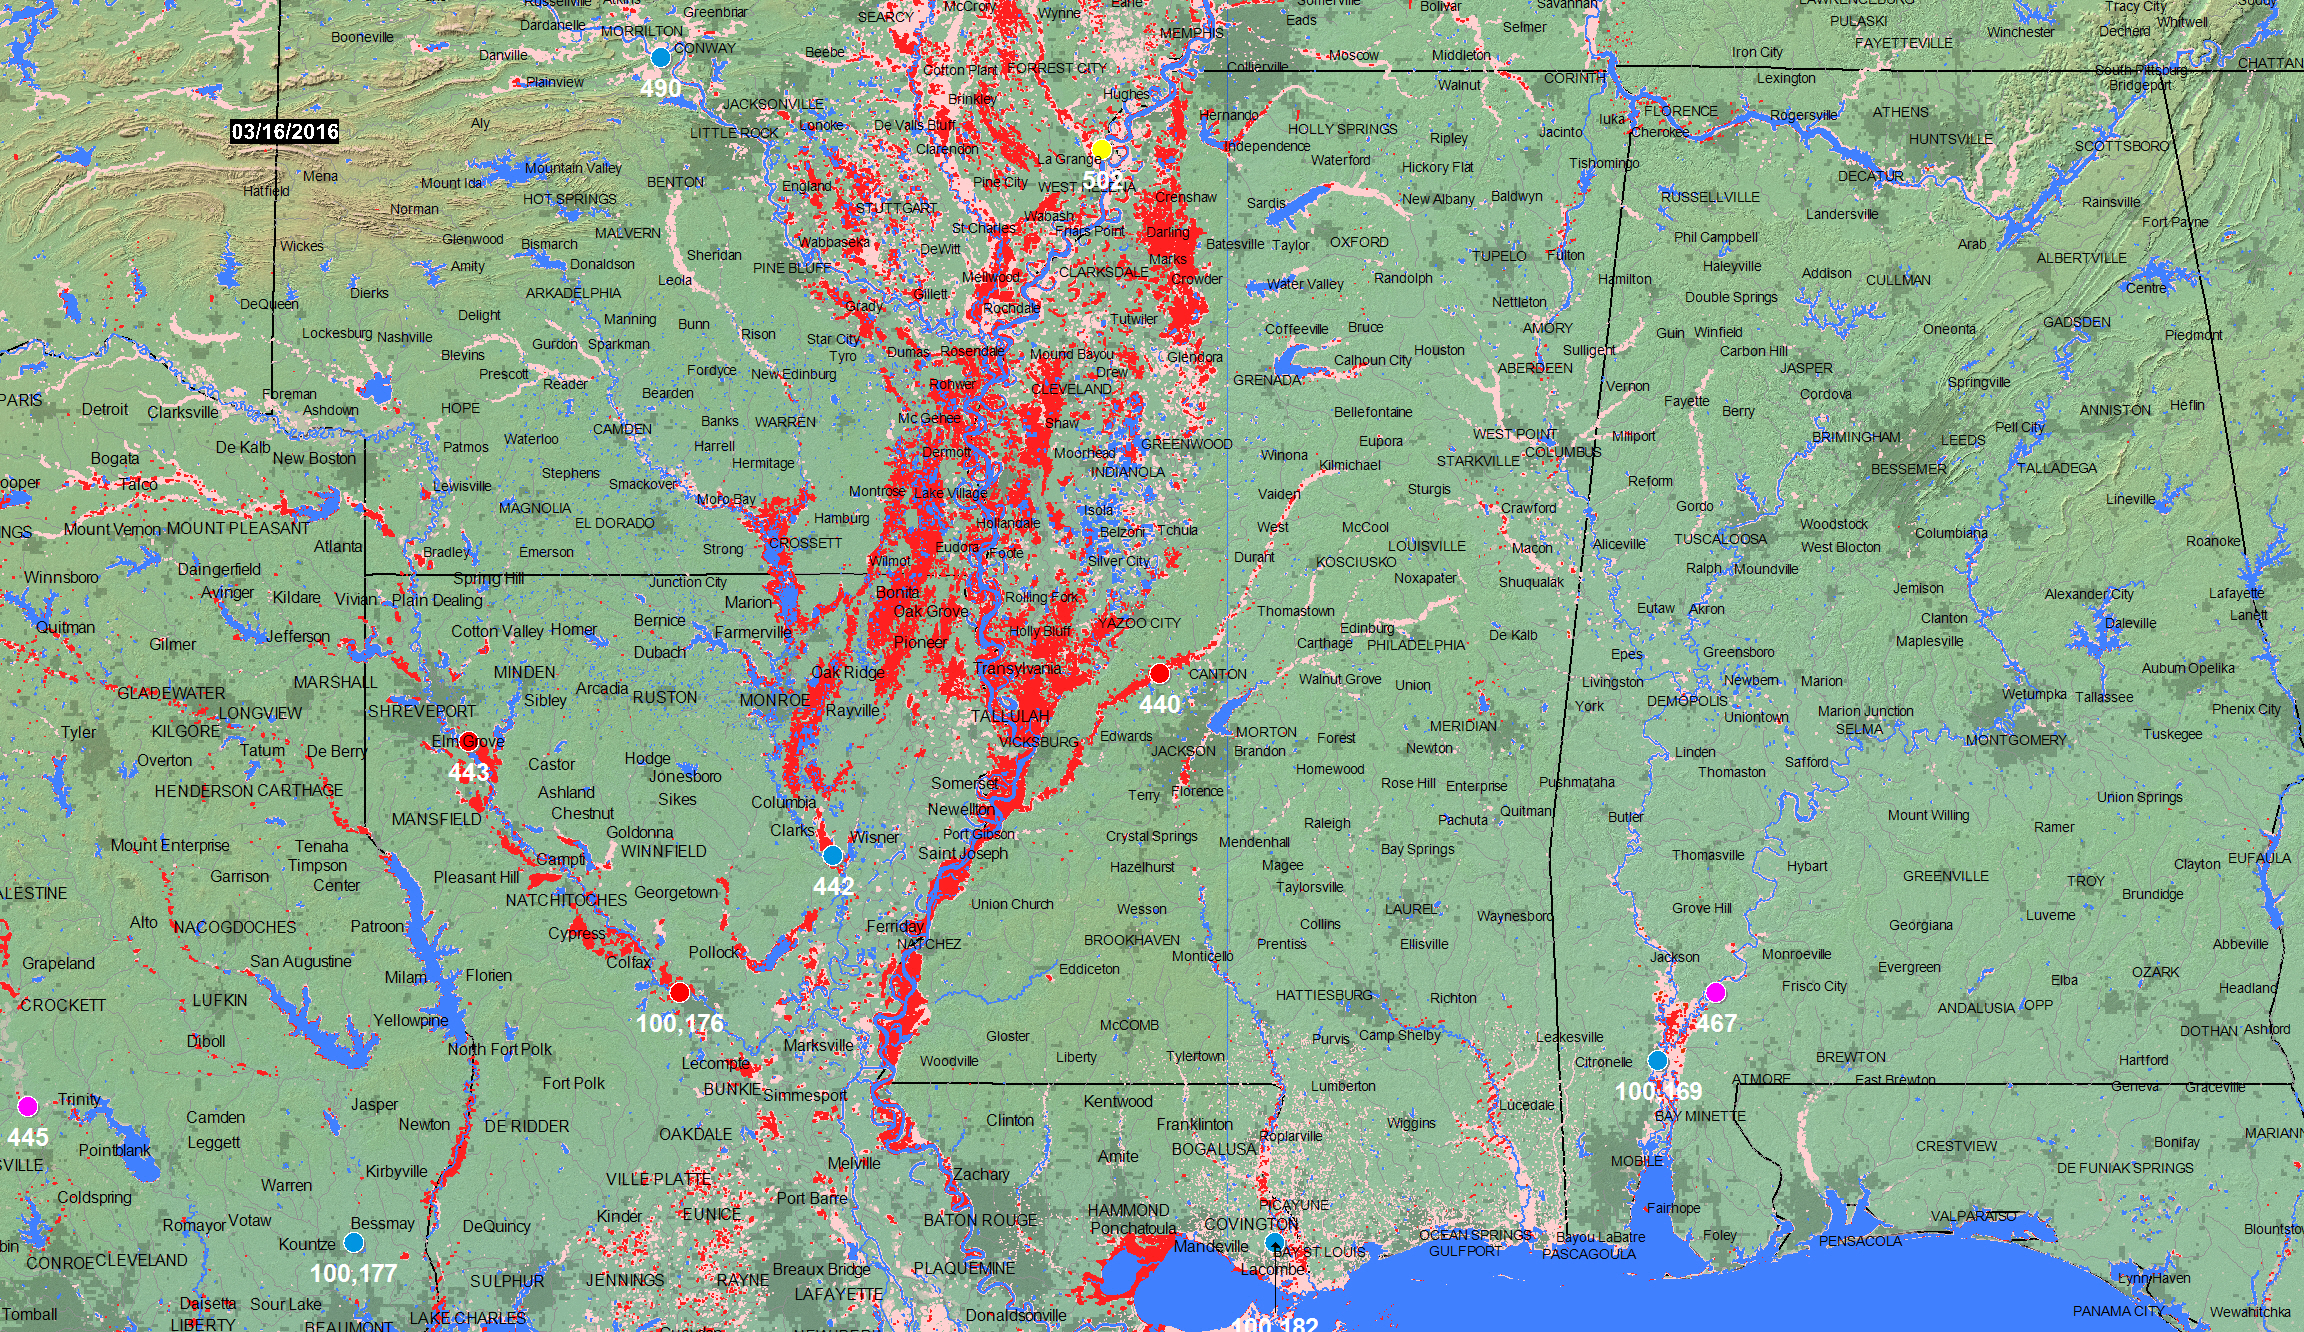
To create this display, satellite data are obtained by the Flood Observatory, processed to detect water/land boundaries, and analyzed to produce current surface water extent in vector GIS format. The Observatory also accepts GIS flood inundation limits from other sources and incorporates this information with permission of the authors. The date of last update is shown on each map. A large scale Geotif version is also available.
Color coding for previous flooding: 2015, 2014, 2013, 2012, 2011, 2010, 2009, 2008, 2007, 2006, 2005, 2004, 2003, 2002, 2001, 2000, pre-2000. The Shuttle Water Boundary Data (SWBD, February, 2002) are at 90 m spatial resolution and provide a useful reference water between latitudes 60 degrees south and 56 degrees north. Where used, it is the uppermost map layer (this color). Otherwise, the map layers are arranged sequentially by year, with oldest at bottom.
Red is current surface water (flooding) where it is extending beyond the SWBD information. Twice-daily imaging (Terra-MODIS and Aqua-MODIS, at 250 m spatial resolution) of surface water is accumulated over 14 days to remove nearly all cloud obscuration. The map date refers to a two week period ending on that date.
Floods in mountainous regions are exceptionally hazardous, but they are difficult remote sensing targets and not always observable. Additionally, cloud cover or other constraints sometimes restrict the ability to capture peak inundation everywhere. The displays do not illustrate all areas of possible current flooding.
At selected locations, a time series of satellite microwave-based daily river discharge measurements are available from the Flood Observatory. See River Watch Global Display for more information. A sample from Site 857 in this map sheet is shown below. In the online version of this map sheet, the river reaches monitored by each site are clickable and provide data access. White triangles: ice covered. Yellow dots: low flow (<5th percentile mean daily runoff for this date, 1998-2012); Blue dots: normal flow; Purple dots: moderate flooding (>1.5 yr recurrence); Red dots, major flooding (> 5 yr recurrence).
The Land Atmosphere Near-real time Capability for EOS (LANCE) system, operated by NASA/GSFC, provides daily MODIS data at 250 m spatial resolution. Landsat 8 data, if used, are provided by the U.S. Geological Survey Hazards Data Distribution System. Landsat 8 is jointly managed by NASA and the United States Geological Survey. COSMO-SkyMed synthetic aperture radar (SAR) data are occasionally provided by the Italian Space Agency (ASI) as contribution to the CEOS Flood Pilot. Sentinel 1 SAR data, when used, are provided by the European Space Agency. NASA EO-1satellite tasking and data are provided by Stuart Frye and colleagues at the NASA Goddard Space Flight Center. MODIS data beginning in year 2012 are based on an automated product provided by NASA Goddard Space Flight Center. The non-automated, MODIS-based .shp or MapInfo files before year 2012 are located in a special map sheet folder here together with any other high resolution (Landsat 8, EO-1, etc) .shp or MapInfo files (including all third party data available for redistribution). Click here for access to the automated daily .shp file GIS record (record commences in 2011). Choose map sheet directory and appropriate dates.
As part of collaborations with other disaster response/satelllite mapping organizations, and the Global Flood Partnership, our maps and other data are provided through the above links. With appropriate citation, they can be used freely, including for commercial purposes, under the terms of the Creative Commons Attribution 3.0 Unported License.