Active Archive of Large Floods, 1985-Present
Master Index of Inundation Maps

Flood Event 2016-Texas-4359
East Texas Flooding, May 28, 2016, from NASA/USGS Landsat 8 and NASA MODIS
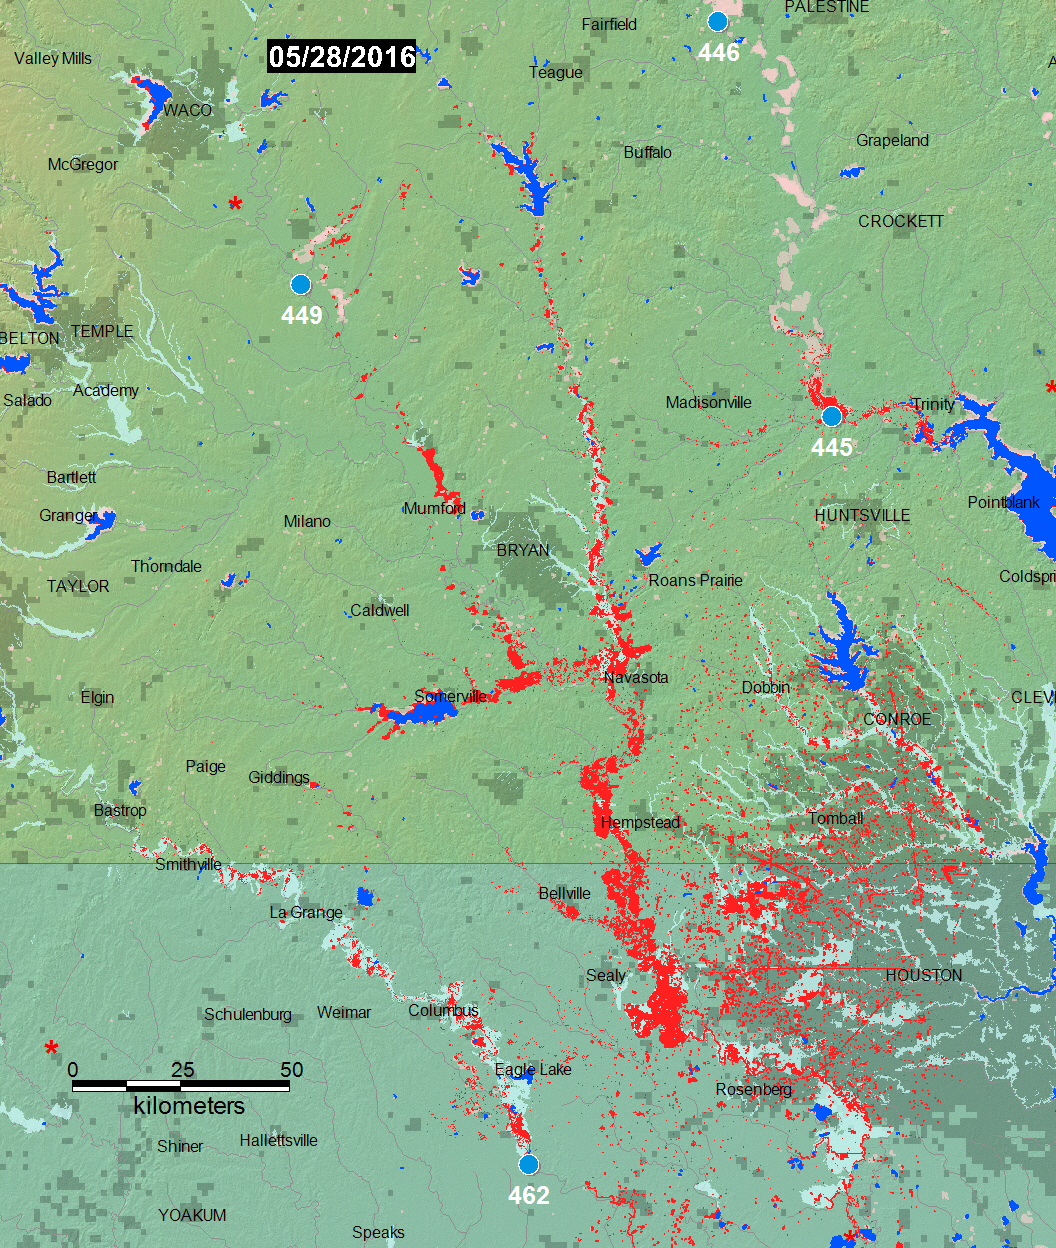
Red is flood water, blue is permanent water, light blue is FEMA 100 yr floodplain (where available), light red is previously mapped floodingOverview Flood Map
(includes MODIS, Landsat 8, and Sentinel 1 data, May 28-30, 2016)
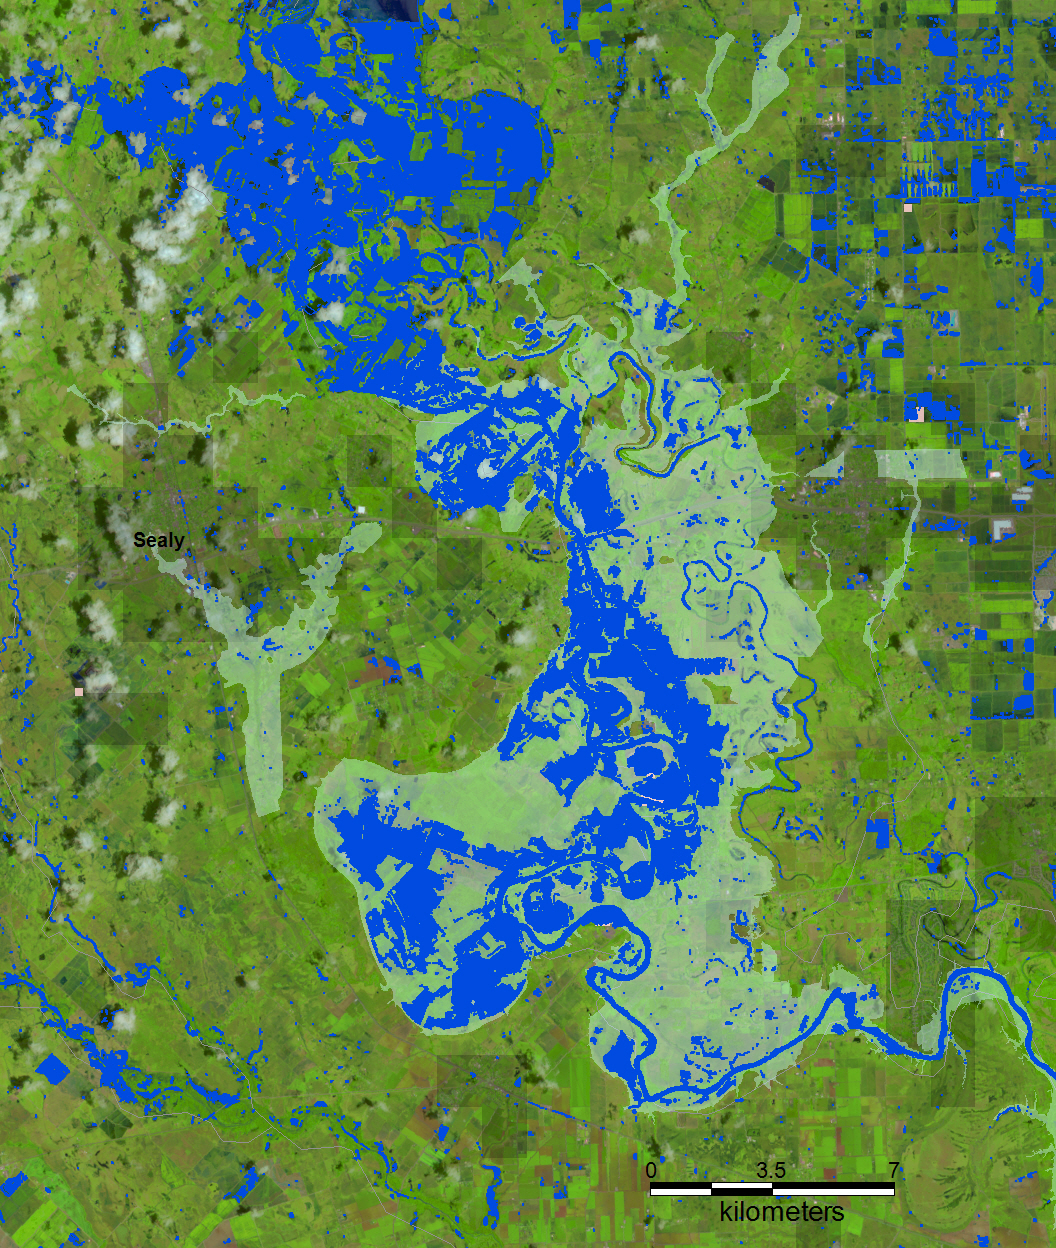
Detailed Flood Map 1
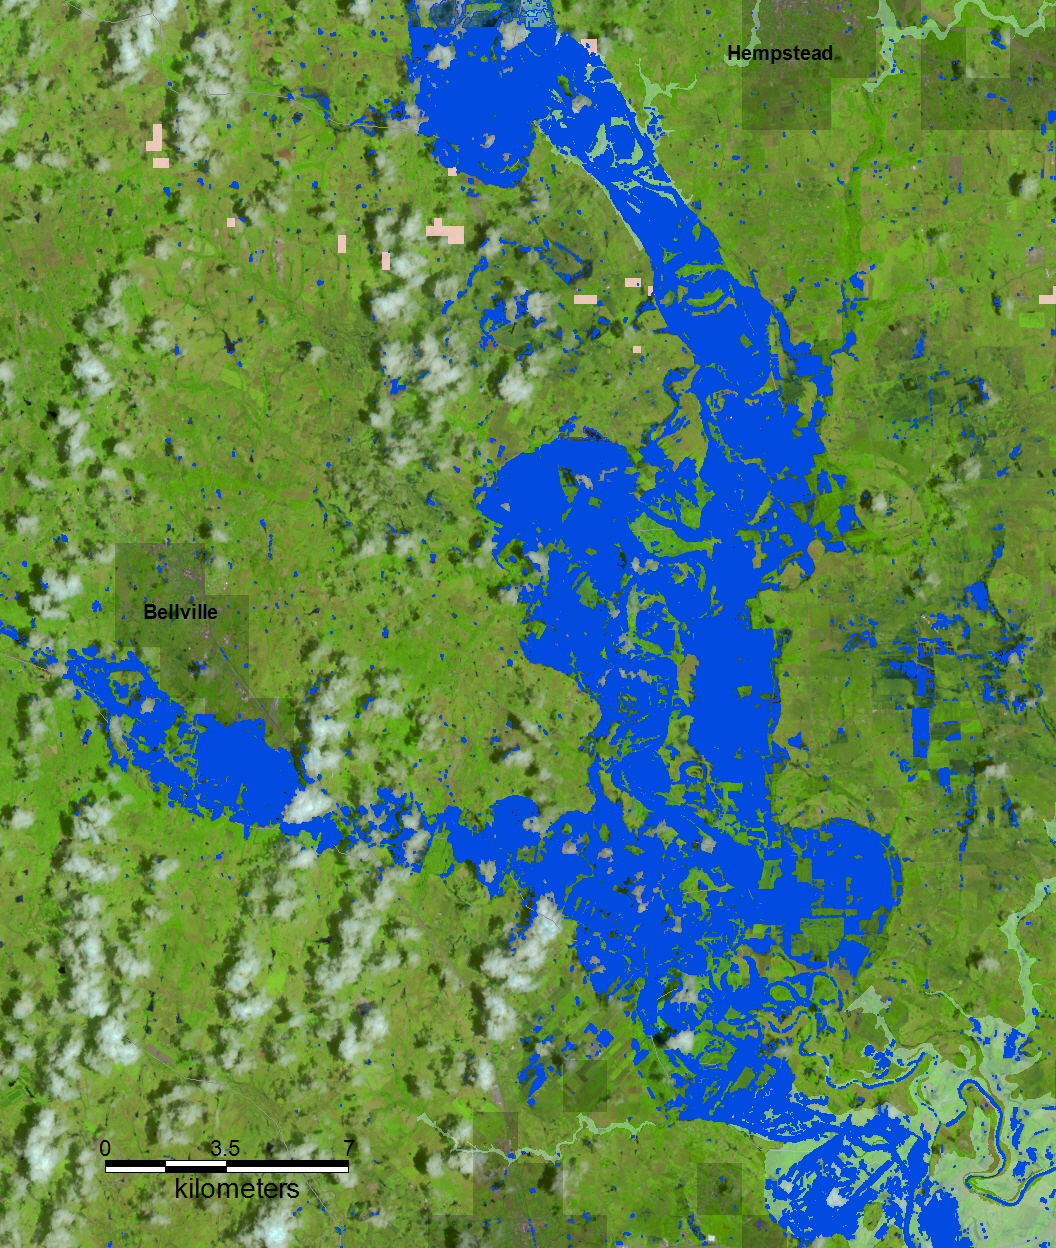
Detailed Flood Map 2
Representative River Watch Flood Hydrograph (clickable dots above)
At selected locations, a time series of satellite microwave-based daily river discharge measurements are available from the Flood Observatory. See River Watch Global Display for more information. A sample from Site 449 is shown below.

Explanation
Event Reporting:
The Flood Observatory maintains a Global Active Archive of large flood events, 1985 to present. It is freely available to the public in both spreadsheet and GIS formats (both formats together provide the complete Archive). New events are entered into this archive each week. As of the end of 2015, there were 4319 events; each has a unique archive number and, starting in 2016, a unique name (example: "2016-Southern USA-4337").Event Mapping:
In some cases, severe or damaging floods become the focus of Observatory inundation mapping. As part of collaborations with other organizations, and the Global Flood Partnership, the Observatory's maps and other data are made available to the public. With appropriate attribution, they can be used freely, including for commercial purposes, under the terms of the Creative Commons Attribution 3.0 Unported License. Geotif versions and GIS files are also provided for these maps through the links below. This event is selected for Observatory production of map and GIS data products.This Event:
This Flood List link provides a summary. According to Flood List: "Heavy rain has been falling in parts of Texas since late May. Brenham in Washington County, recorded 16.62 inches (42 cm) of rain in 24 hours on 26 May 2016. Rivers have burst their banks and flooding has affected 31 counties (see list below). Around 1,400 homes have been damaged by flooding in Fort Bend County, near Houston. Texas Governor Greg Abbott has declared a state of disaster across the affected counties as the rain continues to fall. Over 7 inches (177 mm) of rain was recorded in Houston for the first two days of this month, already surpassing the monthly average (5.9 inches) for June. There are currently 5 locations around Houston where rivers are at major flood stage: Neches River at Saltwater Barrier, West Fork San Jacinto River near Humble, Trininty River at Liberty and the Brazos River at Richmond and near Rosharon. Around 400 families have been ordered to evacuate their homes in Brazoria County."Information From The Maps and River Watch Sites:
The Overview Flood Map below shows in red flooding imaged by Landsat 8 on May 28, 2016 and also by MODIS, same date. Detail maps 1 and 2, below, show the same data draped on a color composite of three bands of the Landsat data. Several River Watch sites (click on the dots) show the flood hydrographs at those locations. If available, time-similar comparisons of the UMD Global Flood Monitoring System and Global Flood Awareness System are also provided below. Please cite the primary source and follow any restrictions provided. New maps and links may be added to this page as the event evolves. This web page and associated image and map (GIS) files are the permanent Flood Observatory record of this event.Caution:
Floods in hilly or mountainous regions are difficult remote sensing targets and not always observable. Also, cloud cover or heavy vegetation may restrict the ability to capture peak inundation everywhere. The maps may not illustrate all areas of flooding, and cloud and terrain shadows may be misclassified and falsely mapped as flood water. Finally, due to the relatively coarse resolution of MODIS 250 m bands, some areas mapped as flooded may include smaller parcels of dry land.Suggested citation:
Brakenridge, G.R., Kettner, A.J., Slayback, D. and Policelli, F., date accessed, "Flood Event 2016-Texas-4359", Dartmouth Flood Observatory, University of Colorado, Boulder, Colorado, USA, http://floodobservatory.colorado.edu/Events/2016Texas4359/2016Texas4359.htmlMapping Data Sources:
The Land Atmosphere Near-real-time Capability for EOS(LANCE) system provides daily NASA MODIS data at 250 m spatial resolution. Landsat 8 data, if used, are provided by the U.S. Geological Survey Hazards Data Distribution System. Landsat 8 is jointly managed by NASA and the United States Geological Survey. COSMO-SkyMed synthetic aperture radar (SAR) data are occasionally provided by the Italian Space Agency (ASI) as a contribution to the CEOS Flood Pilot. Sentinel SAR data, when used, are provided by the European Space Agency. NASA EO-1satellite tasking and data are provided by Stuart Frye and colleagues at the NASA Goddard Space Flight Center. MODIS data beginning in year 2012 are based on an automated product provided by the MODIS NRT Flood project at the NASA Goddard Space Flight Center. Non-automated, MODIS-based .shp or MapInfo GIS files supporting this Flood Event Map are located in a map sheet folder here together with any other high resolution (using Landsat 8, EO-1, etc) GIS files.Click here for access to the automated daily .shp file GIS record (record commences in 2011). Choose appropriate 10 deg x 10 deg map sheet directory and appropriate dates; longitude and latitudes refer to upper left map sheet corner.Related Data:
Global Flood Monitoring System (GFMS) displays, if provided, are from the University of Maryland. Reference: Wu, H., R. F. Adler, Y. Tian, G. J. Huffman, H. Li, and J. Wang (2014), Real-time global flood estimation using satellite-based precipitation and a coupled land surface and routing model, Water Resour. Res., 50, doi:10.1002/2013WR014710. Global Flood Awareness System (GloFAS) displays, if provided, are from the European Commission Joint Research Centre and the European Centre for Medium-Range Weather Forecasts. Reference: Alfieri, L., Burek, P., Dutra, E., Krzeminski, B., Muraro, D., Thielen, J., and Pappenberger, F.: GloFAS – global ensemble streamflow forecasting and flood early warning, Hydrol. Earth Syst. Sci., 17, 1161-1175, doi:10.5194/hess-17-1161-2013, 2013.(counting since June 5, 2016)

This web site and associated data by G. Robert Brakenridge and Albert J. Kettner are licensed under a Creative Commons Attribution 3.0 Unported License.
This work is made possible by data acquired by NASA, the Japanese Space Agency, and the European Space Agency, and funding support from NASA and the European Commission, through the Global Disaster Alert and Coordination System (GDACS) project, Joint Research Centre, Ispra, Italy. The Observatory was founded in 1993 at Dartmouth College, Hanover, NH USA and moved to the University of Colorado, INSTAAR, CSDMS in 2010. The institutional support of both universities is gratefully acknowledged.
http://floodobservatory.colorado.edu/Flood Observatory