


Event Reporting: The Flood Observatory maintains a Global Active Archive of large flood events, 1985 to present. It is freely available to the public in both spreadsheet and GIS formats (both formats together provide the complete Archive). New events are entered into this archive each week. As of the end of 2015, there were 4319 events; each has a unique archive number and, starting in 2016, a unique name (example: "2016-Southern USA-4337").
Event Mapping: In some cases, severe or damaging floods become the focus of Observatory inundation mapping. As part of collaborations with other organizations, and the Global Flood Partnership, the Observatory's maps and other data are made available to the public. With appropriate attribution, they can be used freely, including for commercial purposes, under the terms of the Creative Commons Attribution 3.0 Unported License. Geotif versions and GIS files are also provided for these maps through the links below. This event is selected for Observatory production of map and GIS data products.
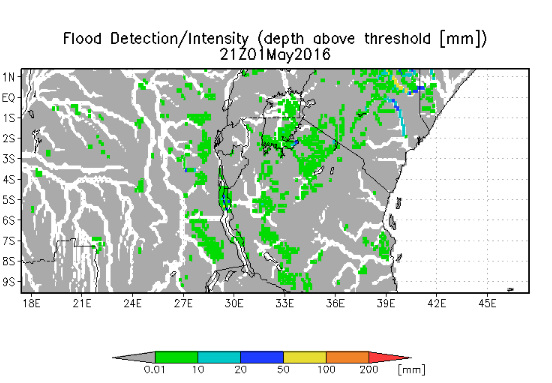
This Event: This Flood List link provides a summary. According to Flood List, the Tanzania News Agency reported 5 people died and almost 14,000 people were left homeless as a result of floods in the Morogoro Region in eastern Tanzania. "The area endured ongoing rain for the past 3 weeks. Heavy rainfall between 22 to 24 April, fell on already saturated ground and caused rivers to overflow, leaving wide areas under water". The Overview Flood Map below shows flooding imaged by MODIS, April 29-May 11, 2016 along a reach of the Mnyera River within the Ulanga Valley: a natural wetland/inland delta ecosystem with multiple parallel rivers. This is the largest seasonal wetland in East Africa. A River Watch Site (1292; click on the dot) shows the flood hydrograph at this location. This river and associated wetland experienced flooding with a recurrence interval of approximately 10 years. The UMD Global Flood Monitoring System (sample display below) indicates high runoff occurring over several days centering on May 1, 2016. The Global Flood Awareness System (sample display below) also predicted flooding at this time.
Related infomation is provided below. Please cite the primary source and follow any restrictions provided. New maps and links may be added to this page as the event evolves. This web page and associated image and map (GIS) files are the permanent Flood Observatory record of this event.
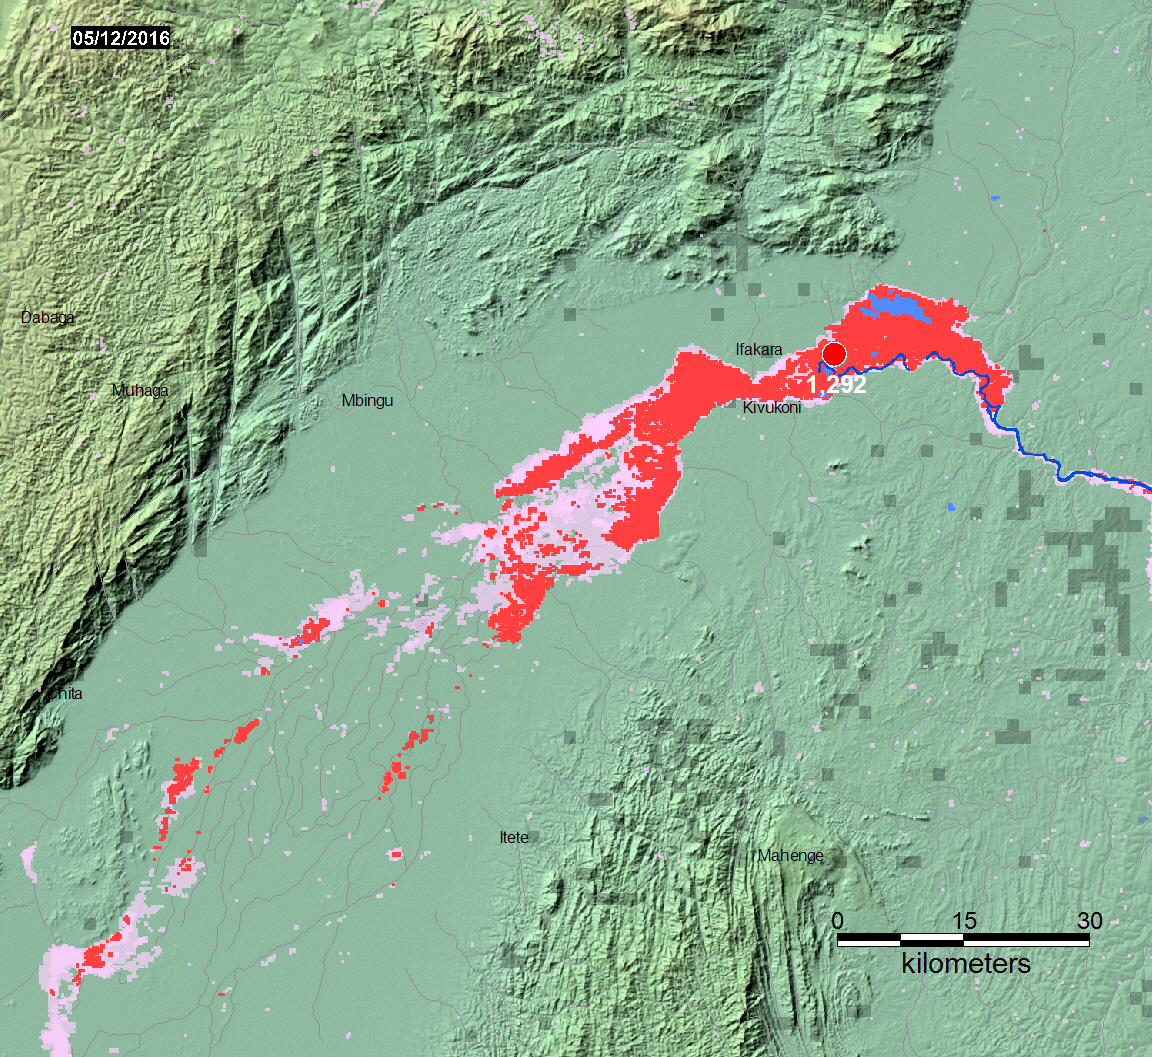
Symbology: Dark blue: Winter flow (February 2002). Medium blue: 2015 Flooding. Red: Flooding (this event; two week accumulation of daily data). Light Red: all flooding mapped by the Observatory since 1999. Updating ends when the flood begins to decrease in areal extent.
At selected locations, a time series of satellite microwave-based daily river discharge measurements are available from the Flood Observatory. See River Watch Global Display for more information. A sample from Site 1292 in this map sheet is shown below. White triangles: ice covered. Yellow dots: low flow (<5th percentile mean for this date, 1998-2012); Blue dots: normal flow; Purple dots: moderate flooding (>1.5 yr recurrence interval); Red dots, major flooding (> 5 yr recurrence interval).

 |
 |
Global Flood Monitoring System, University of Maryland |
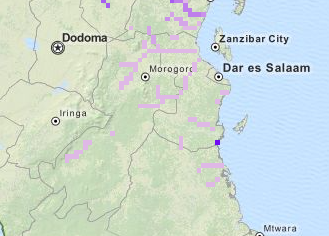
7-day Accumulated Rainfall |
Notes: Floods in hilly or mountainous regions are difficult remote sensing targets and not always observable. Also, cloud cover or heavy vegetation may restrict the ability to capture peak inundation everywhere. The maps may not illustrate all areas of flooding, and cloud and terrain shadows may be misclassified and falsely mapped as flood water. Finally, due to the relatively coarse resolution of the primary data source (MODIS 250 m bands), some areas mapped as flooded may include smaller parcels of dry land.
Suggested citation: Brakenridge, G.R., Kettner, A.J., Slayback, D. and Policelli, F., date accessed, "Flood Event 2016-Tanzania-4357", Dartmouth Flood Observatory, University of Colorado, Boulder, Colorado, USA, http://floodobservatory.colorado.edu/Events/2016Tanzania4357/2016Tanzania4357.html
Data Sources: The Land Atmosphere Near-real-time Capability for EOS(LANCE) system provides daily NASA MODIS data at 250 m spatial resolution. Landsat 8 data, if used, are provided by the U.S. Geological Survey Hazards Data Distribution System. Landsat 8 is jointly managed by NASA and the United States Geological Survey. COSMO-SkyMed synthetic aperture radar (SAR) data are occasionally provided by the Italian Space Agency (ASI) as a contribution to the CEOS Flood Pilot. Sentinel SAR data, when used, are provided by the European Space Agency. NASA EO-1satellite tasking and data are provided by Stuart Frye and colleagues at the NASA Goddard Space Flight Center. MODIS data beginning in year 2012 are based on an automated product provided by the MODIS NRT Flood project at the NASA Goddard Space Flight Center. Non-automated, MODIS-based .shp or MapInfo GIS files supporting this Flood Event Map are located in a map sheet folder here together with any other high resolution (using Landsat 8, EO-1, etc) GIS files.Click here for access to the automated daily .shp file GIS record (record commences in 2011). Choose appropriate 10 deg x 10 deg map sheet directory and appropriate dates; longitude and latitudes refer to upper left map sheet corner.
Global Flood Monitoring System (GFMS) displays, if provided, are from the University of Maryland. Reference: Wu, H., R. F. Adler, Y. Tian, G. J. Huffman, H. Li, and J. Wang (2014), Real-time global flood estimation using satellite-based precipitation and a coupled land surface and routing model, Water Resour. Res., 50, doi:10.1002/2013WR014710. Global Flood Awareness System (GloFAS) displays, if provided, are from the European Commission Joint Research Centre and the European Centre for Medium-Range Weather Forecasts. Reference: Alfieri, L., Burek, P., Dutra, E., Krzeminski, B., Muraro, D., Thielen, J., and Pappenberger, F.: GloFAS – global ensemble streamflow forecasting and flood early warning, Hydrol. Earth Syst. Sci., 17, 1161-1175, doi:10.5194/hess-17-1161-2013, 2013.
(Counting started: May 11, 2016)