


The Flood Observatory maintains a Global Active Archive of large flood events, 1985 to present. It is freely available to the public in both spreadsheet and GIS formats (both formats together provide the complete Archive). New events are entered into this archive each week. As of the end of 2015, there were 4319 events; each has a unique archive number and, starting in 2016, a unique name (example: "2016-Southern USA-4337").
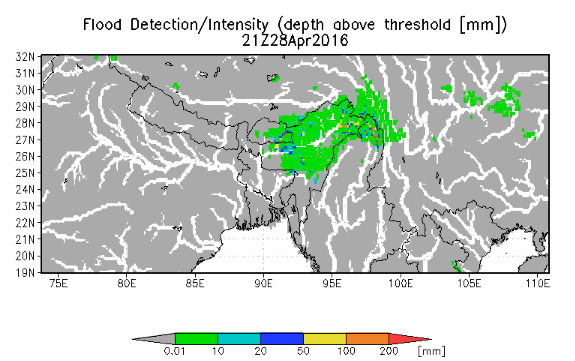
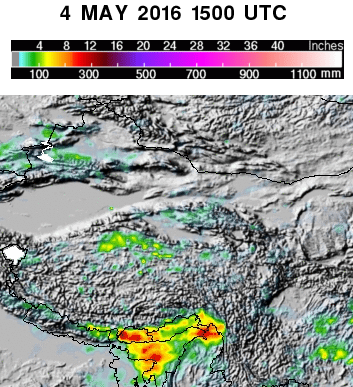
This Flood List link provides a summary of the present event. Flood List indicates a week of heavy rain prior to its posting, April 25, with 18 dead from floods and landslides in India's Northeast. The Overview flood map below shows flooding in the upstream Brahamputra (red areas are flooding imaged during the 14 day accumulation period prior to map date). Annual monsoonal flooding is normal in this area but normally commences in June; this is "pre-monsoon flooding". An upstream River Watch Site (1937; click on the dot) shows an unusual early rise towards the 1.5 yr threshold. The UMD GFMS system (displays below) indicates high runoff occurring in days centered at approximately April 28. Satellite precipitation products show an usually high 7-day rainfall total with amounts reaching to ~200 m in the extreme eastern portion of Assam.
In some cases, severe or damaging floods become the focus of Observatory inundation mapping. As part of collaborations with other organizations, and the Global Flood Partnership, the Observatory's maps and other data are made available to the public. With appropriate attribution, they can be used freely, including for commercial purposes, under the terms of the Creative Commons Attribution 3.0 Unported License. Geotif versions and GIS files are also provided for these maps through the links below. This event is selected for Observatory production of map and GIS data products.
Related infomation from other sources is also provided below, as images with links to their origins. Please cite the primary source and follow any restrictions provided. New maps and links may be added to this page as the event evolves. This web page and associated image and map files are the permanent Flood Observatory record of this event.
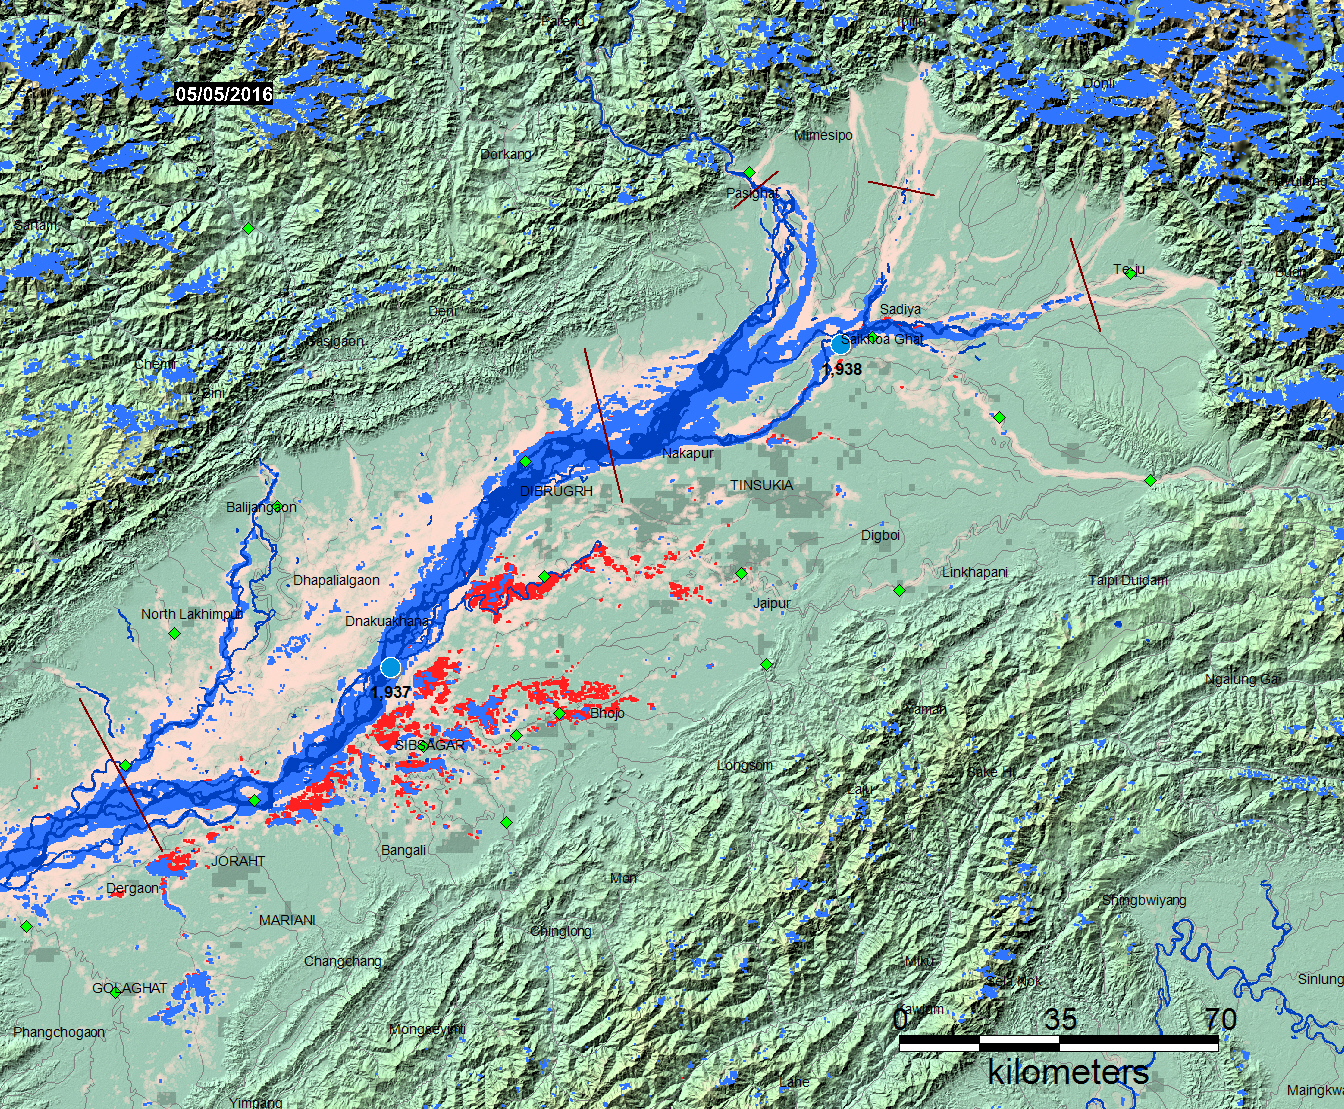
Symbology: Dark blue: Winter flow (February 2002). Light blue: Bankfull flow (summer, 2013). Red: Flooding (two week accumulation of daily data). Light Red: all flooding mapped by the Observatory since 1999. Updating ends when the flood begins to decrease in areal extent.
 |
 |
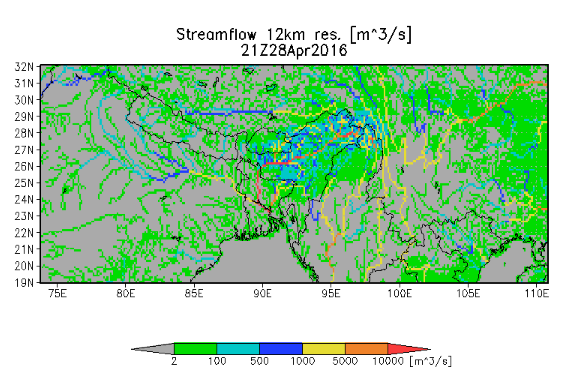
Global Flood Monitoring System, University of Maryland |
7-day Accumulated Rainfall |
 |
 |
Notes: Floods in hilly or mountainous regions are hazardous, but are difficult remote sensing targets and not always observable. Additionally, cloud cover or other constraints may restrict the ability to capture peak inundation everywhere. The maps may not illustrate all areas of flooding. Also, cloud and terrain shadows may be misclassified and mapped as flood water. Finally, due to the relatively coarse resolution of the primary data source (MODIS 250 m bands), some areas enclosed as "flooding" may include smaller parcels of dry land. Suggested citation: Brakenridge, G.R., Kettner, A.J., Slayback, D. and Policelli, F., date accessed, "Flood Event 2016-India-4352", Dartmouth Flood Observatory, University of Colorado, Boulder, Colorado, USA, http://floodobservatory.colorado.edu/Events/2016India4352/2016India4352.html
Data Sources: The Land Atmosphere Near-real time Capability for EOS (LANCE) system provides daily NASA MODIS data at 250 m spatial resolution. Landsat 8 data, if used, are provided by the U.S. Geological Survey Hazards Data Distribution System. Landsat 8 is jointly managed by NASA and the United States Geological Survey. COSMO-SkyMed synthetic aperture radar (SAR) data are occasionally provided by the Italian Space Agency (ASI) as a contribution to the CEOS Flood Pilot. Sentinel 1 SAR data, when used, are provided by the European Space Agency. NASA EO-1satellite tasking and data are provided by Stuart Frye and colleagues at the NASA Goddard Space Flight Center. MODIS data beginning in year 2012 are based on an automated product provided by the MODIS NRT Flood project at the NASA Goddard Space Flight Center. Non-automated, MODIS-based .shp or MapInfo GIS files supporting this Flood Event Map are located in a map sheet folder here together with any other high resolution (using Landsat 8, EO-1, etc) GIS files.Click here for access to the automated daily .shp file GIS record (record commences in 2011). Choose appropriate 10 deg x 10 deg map sheet directory and appropriate dates; longitude and latitudes refere to upper left map sheet corner.
Global Flood Monitoring System (GFMS) displays, if provided, are from the University of Maryland. Reference: Wu, H., R. F. Adler, Y. Tian, G. J. Huffman, H. Li, and J. Wang (2014), Real-time global flood estimation using satellite-based precipitation and a coupled land surface and routing model, Water Resour. Res., 50, doi:10.1002/2013WR014710. Global Flood Awareness System (GloFAS) displays, if provided, are from the European Commission Joint Research Centre and the European Centre for Medium-Range Weather Forecasts. Reference: Alfieri, L., Burek, P., Dutra, E., Krzeminski, B., Muraro, D., Thielen, J., and Pappenberger, F.: GloFAS – global ensemble streamflow forecasting and flood early warning, Hydrol. Earth Syst. Sci., 17, 1161-1175, doi:10.5194/hess-17-1161-2013, 2013.
(Counting started: May 4, 2016)