


See also Geotif version, KMZ (Google Earth) versioon, and PDF version
This map and all source data are freely available under the terms of the Creative Commons Attribution 3.0 Unported License. Authors and citation: Brakenridge, G.R., Kettner, A.J., Slayback, D. and Policelli, F., date accessed, "Maximum Flood Extent, 2015 Flooding in Southern India", Dartmouth Flood Observatory, University of Colorado, Boulder, CO, USA.
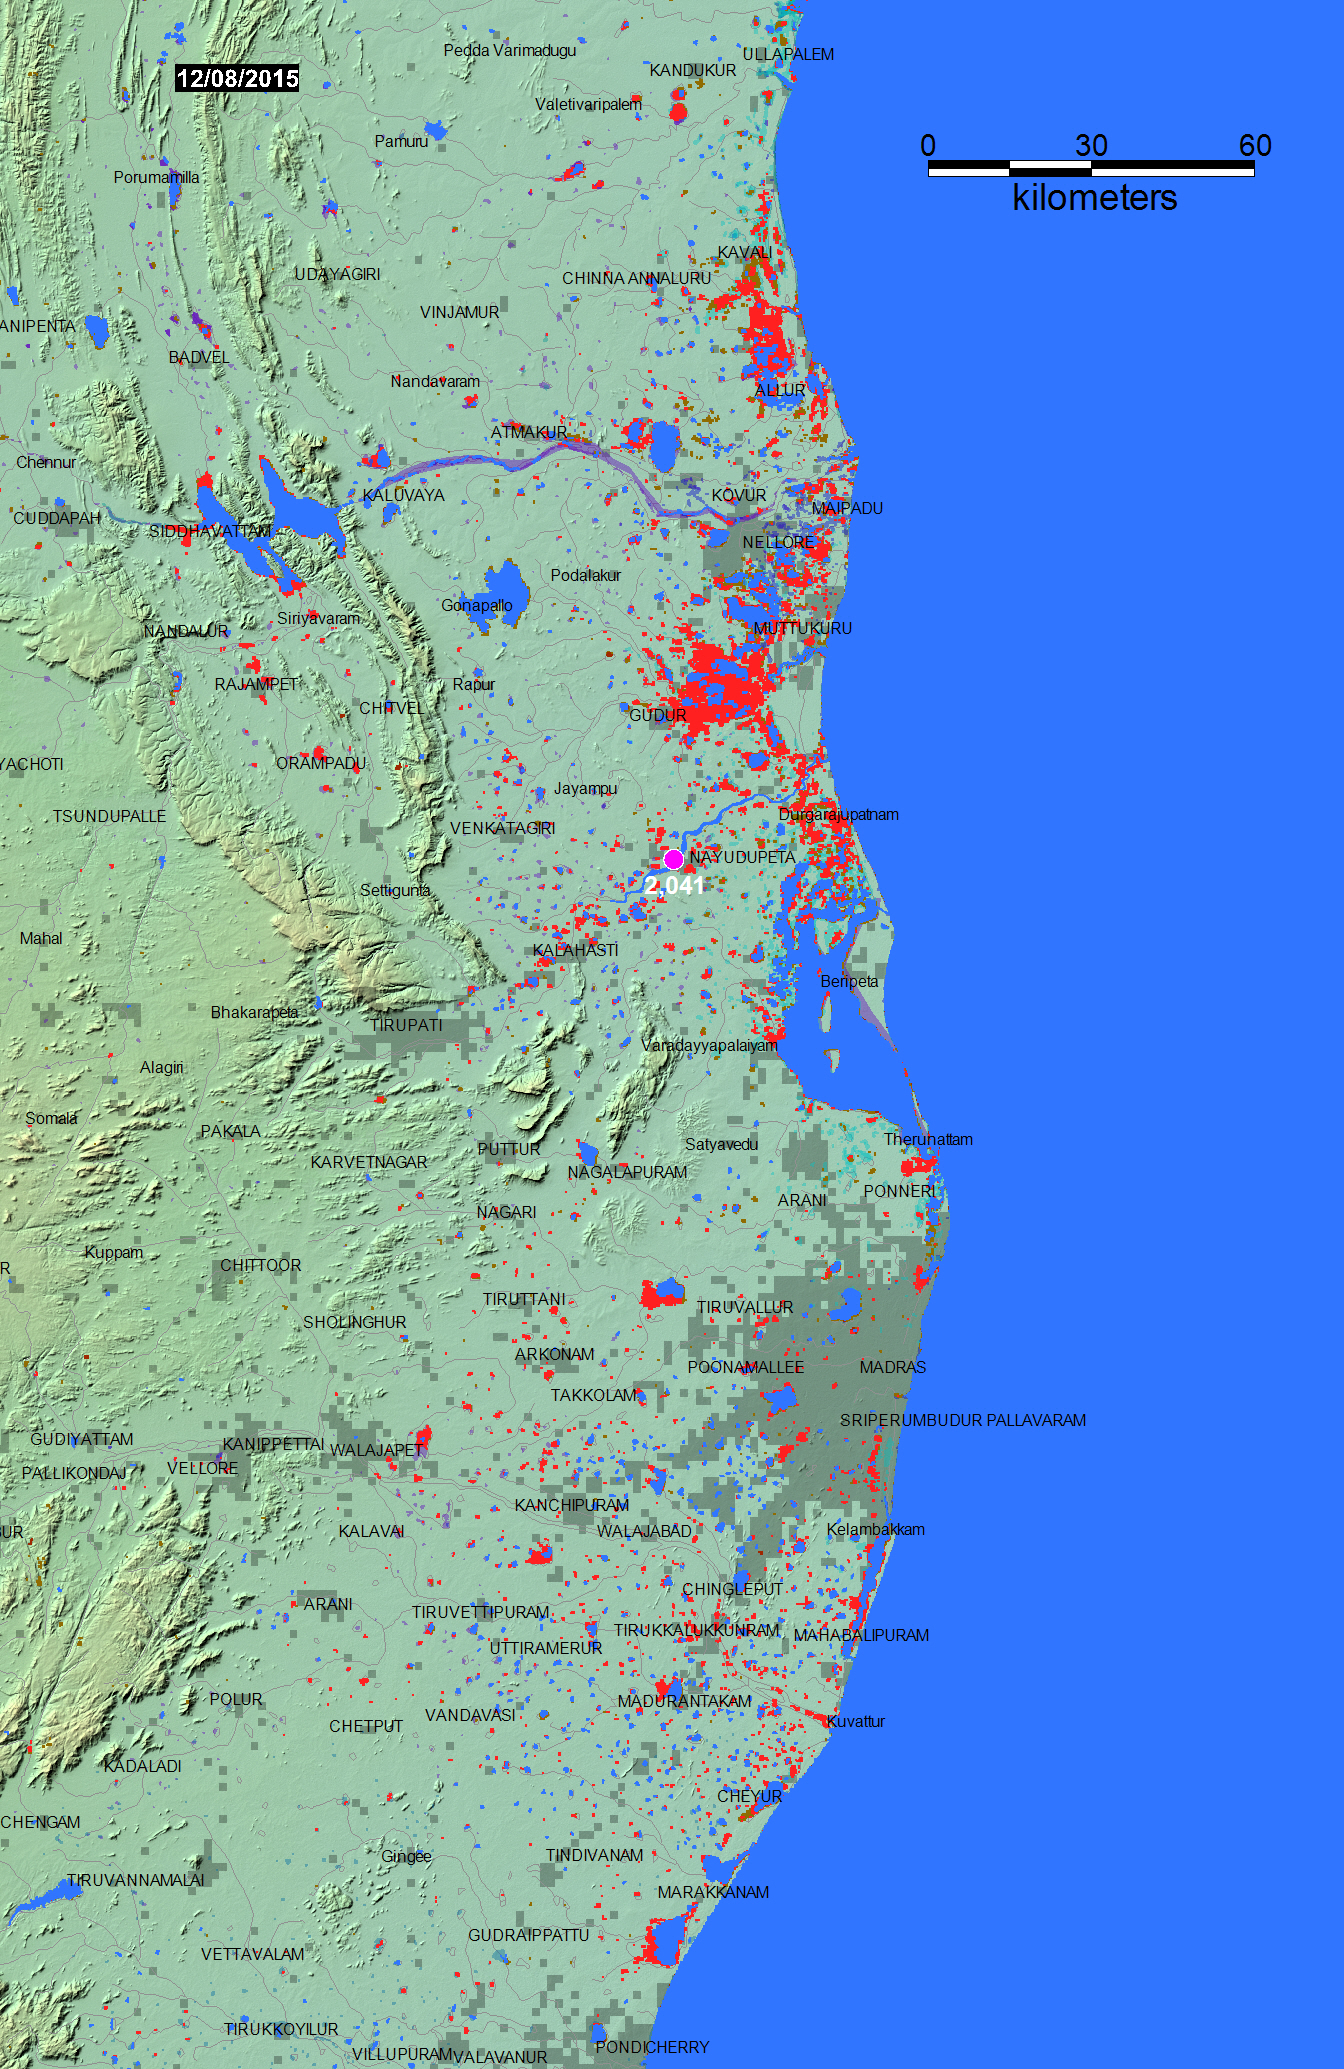
To create this display, satellite data are obtained by the Flood Observatory, processed to detect water/land boundaries, and analyzed to produce current surface water extent in vector GIS format. These displays are updated daily. Most commonly, twice-daily imaging (Terra-MODIS and Aqua-MODIS, at 250 m spatial resolution) of surface water is accumulated over 14 days to remove nearly all cloud obscuration. The map date refers to a two week period ending on that date. In some cases, the Observatory also uses other satellite images, or accepts GIS flood inundation limits from other sources and incorporates this information. Other data sources are always noted here. The date of last update is shown on the map.
The map and associated Geotif file are in plate-carree (equirectangular) projection.
Previously mapped flooding is illustrated as layers below the flood extent from this event (in red). Color coding for older data: 2015, 2014, 2013, 2012, 2011, 2010, 2009, 2008, 2007, 2006, 2005, 2004, 2003, 2002, 2001, 2000.
Flooding is surface water where its presence is unusual. The Shuttle Water Boundary Data (SWBD, February, 2002) are at 90 m spatial resolution and provide a useful reference "normal" water between latitudes 60 degrees south and 56 degrees north. SWDB is the uppermost map layer (this color). Otherwise, the map layers are arranged sequentially by year, with oldest at bottom.
Floods in mountainous regions are difficult remote sensing targets and not always observable. Heavily vegetated floodplains may obscure flooding from satellite imaging. Additionally, cloud cover or other constraints sometimes restrict the ability to capture peak inundation everywhere. The map does not illustrate all areas of possible current flooding.
At selected locations, a time series of satellite microwave-based daily river discharge measurements are available from the Flood Observatory. See River Watch Global Display for more information. A series from Site 2041 in this map sheet is shown below. In the online version of this map sheet, the river reaches monitored by each site are clickable and provide data access. White triangles: ice covered. Yellow dots: low flow (<5th percentile mean daily runoff for this date, 1998-2012); Blue dots: normal flow; Purple dots: moderate flooding (>1.5 yr recurrence); Red dots, major flooding (> 5 yr recurrence).
Most Recent Record:

Complete Record:

General description of flood event from Wikipedia
According to River Watch site 2041, the 2015 flood is the largest in the period of record and is approximately a 25 year event.
In order to emphasize unusual flooding, instead of normal monsoonal high water conditions, an additional "normal" water mask is used. It is also shown in blue together with the SWBD data. This mask is the MODIS NRT accumulated annual maximum flood extent for 2014. Red areas are observed flooding in excess of the 2014 maximum extent.
A daily-updated 14-day accumulation .shp (and associated files) are named "current" and provided in the MODISlance_2wkpro directory for each map sheet. The non-automated, MODIS-based .shp or MapInfo files are located here, together with any high resolution (Landsat 8, Sentinel 1, etc) .shp or MapInfo files.